INTEGRATION OF AUTOMATED DECISION AIDS WITH A PROTOTYPE AIR TRAFFIC CONTROL INTERFACE IN SUPPORT OF TIME-BASED SURFACE OPERATIONS KENYON T.
|
|
|
- Zoe Short
- 6 years ago
- Views:
Transcription
1 INTEGRATION OF AUTOMATED DECISION AIDS WITH A PROTOTYPE AIR TRAFFIC CONTROL INTERFACE IN SUPPORT OF TIME-BASED SURFACE OPERATIONS BY KENYON T. RIDDLE THESIS Submitted in partial fulfillment of the requirements for the degree of Master of Science in Human Factors in the Graduate College of the University of Illinois at Urbana-Champaign, 2012 Urbana, Illinois Adviser: Professor Alex Kirlik
2 Abstract The implementation of the Next Generation Air Transportation System (NextGen) will necessarily require new types of air traffic control automation to support advanced procedures. In addition, existing forms of automation will need to be enhanced to reduce controller workload in support of these new procedures. It is critical that automated systems, often performing multiple functions, be appropriately designed to support high levels of operator situation awareness and maintain adequate failure performance. Three different versions of a prototype ground controller interface were tested in a simulation of Dallas/Forth-Worth International Airport for their effect on efficiency of surface operations. Two versions featured automated decision aids based on a near to mid-term NextGen equipage assumption and a third served as a baseline with no automated decision aid. The two automated decision aids filled fundamentally different functions within the overall system, with a Temporal Constraint Visualization (TCV) providing a graphical presentation of spatiotemporal constraints on the departure sequence and a Timeline display providing a graphical presentation of a scripted release sequence based on an optimization algorithm. Results indicate that aircraft controlled in the TCV display condition had significantly less taxi delay and stops in the departure queue than the Baseline and Timeline conditions. No significant differences were found between conditions for mean departure time deviation or response time to arrival aircraft. These results indicate that, by appropriately utilizing automation in decision aid design, task performance in complex domains can be improved while allowing the human operator to ii
3 retain full control of the decision making process. Additional research is warranted to investigate failure mode performance using these decision aids. iii
4 Acknowledgements I would first and foremost like to thank Ronald Carbonari for his amazing dedication to this research project. Of his own accord, Ron stuck with me through many sleepless nights to ensure this project was completed, and without his efforts it certainly would not have been. I am glad that future students will be fortunate enough to work with Ron and I am truly grateful that I had the opportunity. I would also like to extend a special thank you to my adviser, Alex Kirlik; not only for his guidance, but for providing me with a research and funding opportunity when I was out of other options after my first year. I don t think I realized it at the time, but looking back I m frankly not sure if I would have been able to complete this program had he not gone out of his way to help me. In addition, I want to extend thanks to the rest of the research team, including Donald Talleur, Johnathan Sivier, and Yijing Zhang. Their input and hard work was absolutely critical in determining a research problem, performing the experiment, and preparing this thesis. Finally, I would like to thank my parents for their continued support and advice. I hope they are proud knowing that they are directly responsible for everything I ve been able to achieve. iv
5 Table of Contents List of Acronyms... vi 1. Introduction Automation Situation Awareness Displays and Interfaces Present Research Method Results Discussion Conclusion References Appendix A: Participant Training Appendix B: Individual Results Appendix C: Informed Consent Form Appendix D: Debriefing Script v
6 List of Acronyms 4DT ANOVA ARTCC ASDE-X ATC ATM DFW DMI EID ETA ETD LCD NAS NextGen OTW RTA SA SODAA SRK TBO TMA TCV 4-Dimensional trajectory Analysis of variance Air Route Traffic Control Center Airport Surface Detection Equipment, Model X Air traffic control Air traffic management Dallas-Fort Worth International Airport Direct-manipulation interface Ecological interface design Estimated time of arrival Estimated time of departure Liquid crystal display National airspace Next Generation Air Transportation System Out-the-window Required time of arrival Situation awareness Surface Operations Data Analysis and Adaptation Skills, rules, knowledge Trajectory-based operations Traffic Management Advisor Temporal constraint visualization vi
7 1. Introduction The Next Generation Air Transportation System (NextGen) seeks to dramatically increase both the volume and efficiency of air traffic in the national airspace (NAS), while maintaining or increasing the current level of safety (Erzberger, 2004; JPDO, 2010). NextGen will attempt to leverage technological advances to reduce aircraft separation and facilitate a shift from traditional, rules-based operations to performance-based operations (JPDO, 2010). In complex operational settings such as NextGen, automated decision aids are playing an ever increasing role (Wickens, Mavor, Parasuraman, & McGee, 1998; Erzberger, 2004). Optimization algorithms are often utilized to bring system efficiency to a level not achievable by humans alone or to perform tasks which humans simply do not have the cognitive resources to perform effectively. This is a seemingly prudent approach because, as Rasmussen (1986) describes, humans are more effective at skill and rule-based behavior than knowledge-based behavior, which is to be avoided in dynamic control tasks whenever possible. However, the use of such algorithms almost always necessitates automating the more advanced functions of decision selection or action implementation (Parasuraman, Sheridan, & Wickens, 2000), or otherwise reducing the level of human involvement in the decision process. The inappropriate implementation of advanced automation can result in declines in human performance (Norman, 1990; Sheridan, 2002; Parasuraman & Wickens, 2008), loss of situation awareness (Endsley, 1993; Wickens, 2008), and other issues with human-automation interaction (Parasuraman, 1997). Additionally, algorithms can produce results ranging from sub-optimal to catastrophic if 1
8 certain assumptions are not met or some variables are unknown. In complex dynamic environments such as air traffic control, rare is the case in which all constraints are known and all assumptions are met. A human that is simply executing algorithm-derived instructions or acting in a passive monitoring role is ill-equipped to handle off-nominal situations for which the algorithm is not effective. An alternative to algorithm-based decision aids, which may not be robust to violations of assumptions, is a visualization of the constraints on effective human operator decision making. This is similar in concept to Ecological Interface Design, as described by Vicente and Rasmussen (1992) and Burns and Hajdukiewicz (2004). Kirlik, Walker, Fisk, and Nagel (1996) state that, due to time pressure and complexity, humans often opt for heuristic solutions to dynamic decision making tasks. Knowing that humans will naturally adopt perceptual heuristics, presenting key system constraints in a manner that can be easily processed allows the decision aid design to positively influence the development of these heuristics. Presenting information such that relevant system variables can be included in perceptual heuristics can leverage and amplify the natural processes of skilled dynamic decision making, rather than requiring the operator to turn over part or all of the decision making process to automation that may not be equipped to deal with all situations. 2
9 2. Automation With the ever-increasing role of automation in aviation operations (Wickens, Mavor, Parasuraman, & McGee, 1998; Erzberger, 2004), properly integrating both human and automated decision makers in the control loop becomes critical. Inappropriate implementation of automated systems can result in declines in human performance (Norman, 1990; Endsley & Kiris, 1995; Parasuraman, 1997; Sheridan, 2002; Parasuraman & Wickens, 2008). Parasuraman (1997) describes four aspects of human-automation interaction: use voluntary utilization of automation, misuse overreliance on automation, disuse neglect or underutilization of automation, and abuse automation of functions without regard for human performance issues. What is of most interest to this research and other complex dynamic environments is abuse. The initial design of all NextGen systems will require decisions pertaining to the level of human involvement in the decision-making process. While this is something that may seem trivial to some engineers, improper application of automation can have dire consequences on overall system performance. This chapter begins with a description of a formal method for classifying automated systems, which is then used to facilitate the discussion of automation-related issues in the proposed NextGen system. 2.1 Classification of Automation When mentioning automation, one may be referring to something as simple as a basic alarm clock or something as complicated as the autopilot system on a commercial aircraft. While both are technically examples of automation, they are so functionally different that studying the implementation of one does little to inform the appropriate use 3
10 of the other. The ways in which automation can be utilized are nearly endless, leading to the need for a more detailed classification system. By understanding how these two examples of automation are functionally different, in addition to how they are similar, one can have a better understanding of the potential problems encountered with the use of each and what interventions can be taken to prevent these problems. Parasuraman, Sheridan, and Wickens (2000) propose a taxonomy of automation featuring varying types and levels, with type (also described as stage) referring to the automation s intended function and level referring to the extent of human involvement in that function. These two factors combine to determine the degree of automation (Wickens, Li, Santamaria, Sebok, & Sarter, 2010), which can be used to describe how advanced the automation is. This notion of advanced does not refer to the complexity of the system behind the automation, but instead refers to how advanced the automation s (and, inversely, the operator s) role in the decision making process is Levels of automation. According to Parasurman et al. (2000),...automation refers to the full or partial replacement of a function previously carried out by the human operator. The level of automation refers to the extent with which the function has been replaced, previously described by Riley (1989) as points along the continuum from fully manual to fully automatic control. Table 2.1 provides examples of different automation levels for a decision and action selection system. While it is certainly possible to change the extent of human involvement in the control loop by manipulating the level of automation, perhaps a 4
11 more prudent approach is to first ensure that the automation is performing an appropriate function in the first place Types of automation. Looking again at Parasuraman et al. s definition of automation the full or partial replacement of a function previously carried out by a human the nature of the function being replaced is what defines the type of automation. They describe four different types of automation, based on the automation s intended function, which are informed by a simplified model of human information processing. These four types include information acquisition, information analysis, decision selection, and action implementation. In the order listed, they can be thought of as moving from the most basic to the most advanced. Again, advanced is referring to the automation s level of involvement in the control loop, not the degree of complexity or technology associated with the automation. In more practical terms, the four types of automation can be thought of as collecting appropriate data, inferring the meaning of data, making recommendations, and performing actions, respectively. The simplified model of human information processing proposed by Parasuraman et al. (2000) includes four stages: sensory processing, perception/working memory, decision making, and response selection. These four stages correspond directly to the four types of automation (see Figure 2.1). A specific type of automation can be thought of as partially or fully replacing the human operator s involvement in that stage of information processing, depending on the level of automation. This can have strong implications for operators situation awareness, discussed in more detail in chapter 3. 5
12 2.1.3 Degree of automation. Degree of automation, as described by Wickens et al. (2010), is simply a way of describing the combination of both level and type of automation. As shown in Figure 2.2, higher degrees of automation are associated with both higher levels and more advanced types (referred to here as later stages ) of automation. Wickens et al. make the distinction between types of automation here because a high level of information acquisition automation certainly replaces operators cognitive processes in a much different way than a high level of decision selection automation. They also note the tradeoff between routine and failure performance typically associated with higher degrees of automation. While higher degrees of automation reduce workload, they also result in greater performance losses when automation fails. Wickens (2008) notes that in many systems, the curve representing this tradeoff is flat (i.e. increasing the degree of automation does not reduce failure performance) up to a certain point, after which it drops off sharply. System designers should therefore define this routine/failure performance tradeoff curve as closely as possible for their domain of interest, so as to maximize routine performance while incurring a minimal cost in the form of reduced failure performance. 2.2 Design of Automated Systems While the above description of different types of automation might suggest that these types are mutually exclusive, in reality most complex systems utilize multiple types of automation operating at different levels (Parasuraman et al., 2000). Figure 2.3 provides an example of this concept for an ATC conflict detection and alerting system. Such a system performs all four functions of automation defined by Parasuraman et al., but can 6
13 take drastically different forms depending on the level of automation utilized for each function. For example, a version of the system described in Figure 2.3 might provide decision recommendations if the operator requests them and have the ability to send messages to aircraft at the operator s discretion. Another version of the same system might make decisions and implement them autonomously without alerting the operator at all. Both of these hypothetical systems automate the same functions for the same task (decision selection and action implementation), but would have very different implications for overall system performance, especially when the human is forced to fully re-enter the loop in the event of automation failure (Wickens et al., 2010). In such systems, it is critical that the appropriate level of automation is utilized for each function, so that the human operator can be appropriately involved in those functions that support situation awareness (SA) (Endsley, 1993; Wickens et al., 2010). Norman (1990) provides a similar sentiment. He claims that automation at what he defines as an intermediate level of intelligence is entirely inappropriate because it is advanced enough to remove the human from the loop, but is not advanced enough to handle all off-nominal situations without human intervention, nor does it provide appropriate feedback. Norman proposes that if the automation is not intelligent enough to provide appropriate feedback to humans, the level of automation should be reduced so that humans are more involved in the control loop Automated decision aids for ATC. The implementation of NextGen procedures will necessarily require a shift in the type of automation typically utilized by ATC (JPDO, 2010). Traditionally, most automated 7
14 ATC functions have been those of information acquisition and information analysis (e.g. primary and secondary radar displays, conflict alerting systems, etc.). To support more advanced procedures such as 4DTs, not only will additional automation need to be introduced to assist in decision-making and/or action implementation, but the level of automation for information acquisition and analysis will need to be increased to free up operator workload in support of the new procedures. It therefore becomes critical that automated systems be appropriately designed to support high levels of operator SA and maintain adequate failure performance Examples of Decision and Action Automation in ATC Systems An early example of a successfully implemented automated decision aid is the Traffic Management Advisor (TMA) (Swenson, Hoang, Engelland, Vincent, Sanders, Sanford, & Heere, 1997). The TMA is a time-based planning tool to support the optimization of traffic flow at busy airports. Evaluations at the Fort Worth ARTCC indicated an average delay reduction of one to two minutes per aircraft and subjective evaluations revealed a reduction in perceived workload for en-route controllers. The Final Approach Spacing Tool (FAST), initially developed by Lee and Davis (1995), generates recommendations for heading and speed instructions with a goal of sequencing aircraft and deconflicting their trajectories (Robinson & Isaacson, 2000). FAST has been in operational use at the Fort Worth ARTCC since

 defined by higher levels")
15 Figures Figure 2.1. Relationship between Parasuraman et al. s simplified model of human information processing and type of automation. Figure 2.2. Degrees of automation (diagonal line) defined by higher levels and later stages (types). Adapted from Wickens et al. (2010). 9

16 Figure 2.3. An example of a single system performing all four types of automation functions. The level of automation for each of these functions can be manipulated as required to maintain appropriate levels of human involvement. 10
17 Tables Table 2.1. Example levels of automation for decision selection (adapted from Parasuraman et al., 2000). HIGH 10. The computer decides everything, acts autonomously, ignoring the human. 9. informs the human only if it, the computer, decides to. 8. informs the human only if asked, or 7. executes automatically, then necessarily informs the human, and 6. allows the human a restricted time to veto before automatic execution, or 5. executes that suggestion if the human approves, or 4. suggests one alternative. 3. narrows the selection down to a few, or 2. The computer offers a complete set of decision/action alternatives, or LOW 1. The computer offers no assistance: humans must take all decisions and actions. 11
18 3. Situation Awareness As defined by Endsley (1988b), situation awareness (SA) is, the perception of elements in the environment within a volume of time and space, the comprehension of their meaning, and the projection of their status in the near future. SA has been shown to have strong ties to both decision making and performance. Evidence suggests that an operator s decision making process is in part determined by how they characterize a given situation and that those with the expertise and/or knowledge to capitalize on their understanding of the environment show a significant improvement in performance as SA increases (Endsley, 1995a). While being influenced by factors such as working memory, attention, and stress, SA is necessarily a separate construct. Endsley (1995a) notes that limitations on working memory can be avoided when appropriate mental models and schemas exist in long term memory to provide comprehension of incomplete information. Attention is largely influenced by goals, which help determine what environmental elements are attended to by the operator. Endsley provides a system for classifying the extent of a person s SA into distinct levels, which is detailed below. 3.1 Levels of Situation Awareness Endsley classifies SA into three distinct levels, each building on the understanding acquired in the previous level. Level 1 SA is specifically the perception of the elements in the environment. This perception, however, does not guarantee a conscious processing of what is being perceived a phenomenon known as perception without awareness or perception without attention (see Merikle & Joordens, 1997). Level 2 SA is the comprehension of the current situation. This is based on the coalescence of the individual 12
19 elements perceived in Level 1 SA. At this level, the operator perceives the various environmental elements and comprehends the meaning of what they perceive, however conscious processing alone does not guarantee that an operator has achieved Level 2 SA. An example of conscious processing without comprehension would be a novice pilot seeing an advanced navigation display for the first time. The pilot would perceive the icons and symbols of various colors, shapes, and sizes and would be able to verbalize what they are seeing; however, they would not comprehend the meaning of all of these elements without specific instruction, effectively remaining at Level 1 SA. Level 3 SA is the projection of future status. At this level an operator not only comprehends the meaning of elements in the environment, but they are able to utilize an advanced understanding of the situation to predict the future states of those elements and act accordingly. While Endsley repeatedly refers to elements in the environment when defining the levels of SA, these are domain specific and therefore cannot be defined in general terms applicable to all complex systems. A crucial step in designing systems and displays to appropriately support operator SA is the identification of these critical elements and the facilitation of operator perception, comprehension, and understanding of them. 3.2 Effects of Automation on Situation Awareness A critical factor in the design of systems and displays for complex domains is the effect of level and type of automation on operator SA. Losses in SA can be influenced by shifts in the extent of operator control (Endsley & Kiris, 1995), something largely determined by the type and level of automation implemented in a system. Losses are associated with a decrease in vigilance when assuming a monitoring role by passively 13
20 receiving information rather than actively processing it, and a loss of feedback related to the state of the system all typically occurring as automation levels increase. Higher degrees of automation tend to be associated with reduced workload, but at the risk of loss of SA (Endsley, 1993; Wickens, 2008; Wickens et al., 2010); this typically improves routine performance, but increases the cost of failure, as discussed in This, combined with the fact that operators accustomed to automation typically have reduced skills when operating manually (Moray, 1986; Wickens & Hollands, 1999), can lead to dangerous consequences when automation fails. The curve representing the tradeoff between routine and failure performance described by Wickens et al. (2010) is largely a result of a tradeoff between workload and SA. While the reductions in workload are mainly responsible for the increases in routine performance with more advanced automation, the resultant losses in SA lead to the reduction in failure performance. In an experiment exploring the interaction between level of automation and adaptive automation (dynamically adjusting the level of system control between human and machine over time to manage operator workload), Kaber and Endsley (2004) found that level of automation was the primary factor for both primary task performance and SA. In an experiment using an ATC-related simulation, Kaber et al. (2006) found that information acquisition automation increased SA and action implementation automation decreased workload. Information analysis and decision selection automation were associated with higher workload, though the authors attributed this to increased visual demands of the display. 14
21 4. Displays and Interfaces An information display, as defined by Wickens, Lee, Liu and Gordon-Becker (2004), is a human made artifact designed to support the perception of relevant system variables and facilitate the further processing of that information (p. 185). In the realm of complex systems, displays are often more than just a one-way communication of system variables; they are contained within interfaces that allow operators to directly manipulate the system. As data communications and advanced automation are introduced to ATC operations, controllers will spend more time perceiving and directly interacting with displays and interfaces (JPDO, 2010). This chapter discusses relevant frameworks and theoretical models for the design of displays to enhance control of complex systems. Their specific application to ATC displays and interfaces will also be discussed. 4.1 Skills, Rules, Knowledge Having strongly influenced much of the literature on information display design, the skills, rules, knowledge (SRK) framework (developed by Rasmussen, 1983) bears mentioning here. SRK divides operator behaviors into three categories based on the level of cognitive control skill-based behavior, rule-based behavior, and knowledge-based behavior. Being the most basic, skill-based behavior is strictly sensory-motor performance below the level of consciousness. Information relevant to these behaviors is perceived as signals, which act as continuous indicators of the environment. An example of a skillbased behavior is the application of the brakes by a driver approaching a stop sign. The many variables involved in this task (speed, type of car, visibility, road conditions, etc.) are dynamically processed by the driver and an appropriate pressure is applied on the brake 15
22 pedal, with adjustments made as necessary. This all happens subconsciously the driver does not ask themselves, How hard should I press the pedal? Rule-based behavior is a learned response or procedure, either through training or prior experience, which is triggered by signs. An example of rule-based behavior is the decision by a driver to stop at a stop sign. All new drivers are taught that they must stop at stop signs and this behavior is reinforced through experience by the dangers and traffic tickets associated with running a stop sign. When a driver sees a stop sign, he/she recognizes the need to come to a stop and (usually) does so. Note the distinction between the rule-based behavior and the skill-based behavior: the rule-based behavior is the recognition of a stop sign and the decision to stop, while the skill-based behavior is the proper application of the brake pedal. Knowledge-based behavior usually occurs in unfamiliar situations for which inferences must be made. This type of behavior is associated with goal-oriented performance. Often an operator will have a well defined goal (keep the plant operating smoothly, maintain separation between aircraft, etc.), but certain conditions in the environment create an unfamiliar situation for which traditional rule-based behavior does not apply. In other situations, the operator may encounter conditions for which no clearly defined goal exists, and therefore must create their own. Knowledge-based behavior relies heavily on working memory and occupies vast mental resources, and so is to be avoided in dynamic control tasks whenever possible (Rasmussen, 1986) Ecological interface design. Developed by Rasmussen and Vicente (1989), ecological interface design (EID) builds directly on the SRK framework to inform the design of interfaces that minimize the 16
23 effects of human errors on the system and support operators during unanticipated events. According to Vicente and Rasmussen (1992), an EID interface should not force cognitive processing to operate at a level (i.e. SRK) higher than that required by the task and the interface should support all three levels of cognitive control. Put another way, the interface should not add complication to the task (if anything, it should simplify it) and it should support processing at the higher levels of control to support knowledge-based behavior in the event of some system failure or human error. Rasmussen and Vicente (1989) identify human errors related to the effects of learning and adaptation, interference among competing control structures, lack of resources, and stochastic variability for each of the three levels of cognitive control. They also provide overall guidelines for coping with these errors through system design (see Table 4.1). Vicente and Rasmussen (1992) highlight three general principles for EID, each corresponding to a specific level of control. For the support of skill-based behavior, the interface should feature direct manipulation (see 4.2) to prevent the addition of unnecessary levels of abstraction. To support rule-based behavior, there must be a direct mapping between interface features and abstract properties of the system, an idea known as semantic mapping. At this level, operators interpret signs as cues for action; if the cues do not directly match up with constraints on system processes, problems can occur when conventional procedures (reactions to the cues) are carried out for unconventional situations. The support of knowledge-based behavior requires an externalization of the user s mental model. This allows the consequences of an action to be more easily predicted and interpreted among the many causal relationships within complex systems. These EID 17
24 principles seek to apply the benefits of direct manipulation interfaces, traditionally only employed in simple domains, to displays for the control of complex systems. 4.2 Direct Manipulation Interfaces As previously mentioned, a key aspect of the recommendations behind EID is the use of direct manipulation interfaces (DMI), described initially by Shneiderman (1982; 1983) and later by Hutchins, Hollan, and Norman (1985). Schneiderman (1982) defines DMIs as consisting of the following: 1. Continuous representation of the object of interest. 2. Physical actions or labeled button presses instead of complex syntax. 3. Rapid incremental reversible operations whose impact on the object of interest in immediately visible. He goes on to state that systems designed with these three principles in mind will have the following benefits: 1. Novices can learn basic functionality quickly, usually through a demonstration by a more experienced user. 2. Experts can work extremely rapidly to carry out a wide range of tasks, even defining new functions and features. 3. Knowledgeable intermittent users can retain operational concepts. 4. Error messages are rarely needed. 5. Users can immediately see if their actions are furthering their goals, and if not, the can simply change the direction of their activity. 6. Users have reduced anxiety because the system is comprehensible and because actions are so easily reversible. 18
25 While Hutchins et al. (1985) acknowledge these benefits, they do point out that there are certainly associated costs to implementing DMIs. It is most likely a safe assumption that many computer users today would wonder if the plethora of ambiguous icons they face daily is truly reducing their anxiety. Schneiderman (1983) proposes a model for DMI interaction that is centered on a distinction between syntax and semantics, with the former representing an arbitrary convention (e.g. a language) and the latter representing the user s domain knowledge. Schneiderman argues that since DMIs allow users to directly manipulate the object of interest, they reduce the amount of mental effort typically required in the decomposition of high-level intentions to interaction with the interface. Rasmussen & Vicente (1989) point out that Shneiderman s model ignores input from the human s perspective (i.e. human processing of the display) and does not make the necessary distinction between the user s goals and knowledge when discussing the term semantics. This notion of information transfer from the display to the human is a very important one; as Hutchins et al. (1985) point out, it is the disconnect between how a user thinks of their goals and how the state of the system is expressed relative to those goals. This disconnect between user goals and system state is defined by the Gulf of Execution and Gulf of Evaluation (Norman, 1986). The Gulf of Execution is the gap between how a user intends to act on a goal and their means for executing that goal. Any additional steps or mental workload involved between the user s goal formation and their execution of an action to achieve that goal constitute the Gulf of Execution. The Gulf of Evaluation refers to the gap between the manner in which a display provides information 19
26 about the system and how the user thinks about the system. The perception of relevant interface features and interpretation of their meaning constitute the Gulf of Evaluation. While these gulfs can be bridged by the user, cognitive demands are greatly increased when they must do so; the user experiences more of a direct engagement with the system as these gulfs are bridged by the interface. Doing this can be difficult in complex domains, however, because there is not always a direct mapping between the process being controlled, the system supporting the interface, and the user s mental model (Rasmussen & Vicente, 1989). 4.3 Supporting Tasks Through Display Design The rise in complexity of many dynamic systems poses very challenging problems for designers of information displays. Operators in these systems need displays that allow them to understand and react to large amounts of information quickly and accurately, all while working within the limitations of human cognition. Bennett and Flach (1992) identify two distinct types of tasks in complex domains integrated tasks and focused tasks. Integrated tasks require a high-level understanding of the system and operators must consider the relationships between many variables. Focused tasks, on the other hand, require the operator to concentrate on and fully interpret individual variables. What is difficult for display designers is that displays supporting one type of task traditionally do not support the other type of task very well. Attempting to design displays that support tasks at different levels of cognition has not surprisingly been a major focus of display design research. 20
27 4.3.1 Display configurality. When discussing the interaction between display features, Bennett and Flach (1992) identify integral, separable, and configural relationships as three prototypical categories of relationships between stimulus dimensions. Separable relationships lack interaction, with the perception of each stimulus dimension being independent of changes in any other dimensions. Integral relationships contain strong interactions between stimulus dimensions; so much so that one dimension cannot be perceived without being influenced by any other dimension(s). Configural relationships allow each dimension to be perceived independently, but new emergent features are created by the interaction between dimensions, therefore adding additional information to the display. An example of emergent features stemming from configural relationships are emoticons used in modern electronic communication (e.g. :-) or :-( ). While these emoticons are essentially composed of the same individual parts (i.e. a colon, dash, and parenthesis), the emergent feature (an emotion) drastically changes when the relationships among the parts are changed. Human perception and pattern recognition (typically skill-based and rule-based behavior) is much more efficient and accurate than memory and inference (typically knowledge-based behavior); a fact that researchers have attempted to leverage through object and configural displays (Carswell & Wickens, 1987; Rasmussen & Vicente, 1989; Pomerantz & Pristach, 1989; Carswell & Wickens, 1990; Bennett & Flach, 1992). These types of displays typically map multiple variables onto the same form or display object, taking advantage of Gestalt principles (see Boring, 1942) to establish configural 21
28 relationships among display features, thereby conveying large amounts of information and allowing for quick change detection. Graphical displays that produce emergent features corresponding to domain attributes can increase performance and, if they are composed of individual parts containing specific information, are one way that interfaces can support both integrated and focused tasks (Bennett & Flach, 1992). The idea that such emergent features are hard to ignore in favor of individual parts, a concept known as perceptual glue, has been refuted by Pomerantz and Pristach (1989), who assert that emergent features simply add information to a display, rather than detracting from individual features. Perceptual glue stems from the assumption that operators ability to process information in individual stimulus dimensions is degraded when emergent features caused by interactions become too prominent. In practice, however, it appears that no truly integral or separable displays exist (Carswell & Wickens, 1990; Bennett & Flach, 1992). Bennett and Flach (1992, p.517) state that separable and integral dimensions may represent idealistic end points and a continuum of configurality exists. With integral and separable displays (even if only theoretical) existing at two ends of a continuum of configurality, a display s position on this continuum is referred to as its proximity (Carswell & Wickens, 1990; 1995; Bennett & Flach, 1992). Initial theories behind the proximity compatibility principle proposed that display proximity should match task proximity (i.e. integrated vs. focused tasks), ultimately requiring some compromise between integrated and focused attention. Bennett and Flach (1992) argue that this is not the case, with configural displays improving performance on integrated tasks and imposing minimal (if any) cost on focused tasks. They note that in experiments where a decline on 22
29 focused task performance was observed with configural displays, it is often due to an increased information access cost because of the relative salience between emergent and individual features (Pomerantz and Pristach, 1989). Additionally, a simple tradeoff between integrated and focused tasks does not appear to be practical in actual complex systems. Rasmussen (1986) points out that decisions in complex systems usually require a frequent shifting of attention from low-level to high-level ideas and vice versa. 23
30 Tables Table 4.1. Guidelines provided by Rasmussen and Vicente (1989) for coping with human errors through system design. Guidelines for Errors Related to Learning Processes Guideline 1 Guideline 2 Guideline 3 Guideline 4 Aim at making the limits of acceptable performance visible to the operators, while the effects are still observable and reversible. Provide the actors with feedback on the effects of actions so as to allow them to cope with the time delay between the execution of an intention and the observation of its effect. Also, make the latent, conditional constraints on actions visible, especially if such constraints are prepared by another decisionmaker or designer. There should be a consistent and unique mapping from the signs that define cues for action and the symbols that describe how the process functions. The design of control strategies during unforeseen situations should be done through experiments and hypotheses, not in high risk situations Guidelines for Errors Related to Interference Among Control Structures Guideline 5 Guideline 6 Guideline 7 Make available overview displays by which free-running routines can be monitored by fringe consciousness Make the cues for action integrated patterns based on defining attributes and serving, at the same time, a symbolic representation necessary for functional monitoring of performance Support memory with externalization of effective mental models Guidelines for Errors Related to Lack of Resources Guideline 8 Guideline 9 Guideline 10 Use the available data to develop consistent information transformation concepts for data integration. Present information imbedded in a structure that can serve as an externalized mental model, effective for the kind of reasoning required by the task. Guidelines for Stochastic Errors Support of memory of items, acts, and data which are not part of an integrated gestalt can be useful. 24
31 5. Present Research One major research thrust in the NextGen effort is trajectory-based operations (TBO). TBO is based on each aircraft s expected flight profile and time information, or trajectory, which can be managed to ensure efficient individual aircraft trajectories within an overall traffic flow (JPDO, 2010). This includes clearances supporting trajectory management the process of fine tuning individual aircraft trajectories to maintain efficient traffic flow throughout the entire airspace. Trajectory management consists of strategic planning over several ATC sectors, rather than the short-term tactical conflict resolution methods of today. Trajectories in TBO ultimately take the form of required times of arrival (RTA) over one or more waypoints along the proposed flight route. With the addition of RTAs, flight trajectories become 4-dimensional, with time joining the other three dimensions of latitude, longitude, and altitude. These 4-dimensional trajectories (4DT) can theoretically define the entire path of an aircraft from gate to gate, with air traffic control (ATC) being able to accurately predict an aircraft s location at any given time in the future. This longer-term approach promotes efficiency within the NAS by reducing the total number of tactical conflict resolutions performed by ATC (Prevot, Battiste, Palmer, & Sheldon, 2003). Ensuring that aircraft get in the air within a certain time window is therefore critical to realizing full 4DTs. While most TBO research focuses on the en-route phase of flight (JPDO, 2010), surface operations are also critical. With near to mid-term NextGen equipage assumptions, aircraft will not have the advanced onboard systems necessary to support RTAs on the surface (see Hooey, Foyle, & Andre, 2009; Foyle, Hooey, Kunkle, 25
32 Schwirzke, & Bakowski, 2009). The long time periods and associated difficulties with retrofitting existing aircraft fleets (JPDO, 2008) means that any significant near to midterm technological interventions in support of surface TBO must occur through the implementation of ATC-centric systems. 5.1 Aviation Surface Operations In present day surface operations at many airports, the transfer of control for a standard commercial flight starts with a terminal dispatcher, transfers to a ground traffic controller, and ends with a tower traffic controller, who then clears the flight for takeoff. After completing preflight checklists and receiving instructions from the dispatcher, the flight pushes back and contacts the ground controller for taxi instructions. The ground controller, through one or more clearances, issues taxi instructions from the terminal area to the departure runway, where the flight contacts the tower controller. The tower controller then clears the flight for takeoff and typically transfers the flight to a departure/approach controller. While the ground controller s role (guiding aircraft from the terminal to the runway) may not initially seem to have much influence on a flight, it in fact can significantly influence the flight s overall fuel consumption and timing Efficiency of surface operations. A major source of inefficiency in today s surface operations is the often numerous starts and stops involved in taxiing on a busy airport surface. Large aircraft require large amounts of thrust to provide enough forward energy for their wheels to begin moving; this, in turn, requires huge amounts of fuel. Since on-time gate pushbacks are often a performance metric for airlines, the desire for an early pushback time usually overrides any 26
33 concern for its effect on efficiency during taxi (FAA, 2009). With these pushbacks usually being uncoordinated, surface controllers are given the task of sequencing the movement of departure aircraft to the runway (Malik, Gupta, & Jung, 2010). Excessive congestion on airport taxiways can result in large runway queues at the departure runway. The number of starts and stops for each aircraft, as well as their actual takeoff times, are strongly influenced by the order in which the aircraft enter the queue; this is largely determined by the order in which the ground controller sends each aircraft to the runway. When examining airport surface surveillance data, Brinton, Wood, and Engelland (2008) found that almost 90% of flights established on a major taxiway are handled in a first-come first-served fashion, while 50% of those turning onto the taxiway from the ramp area are handled in this fashion. This suggests that taxi instructions are often issued based on heuristics that have little to do with maximizing the efficiency of operations. With taxi instructions based in large part on when the aircraft first contacts the ground controller, the sequence of aircraft at the runway queue is usually not based on the scheduled departure time. With ample space available in the ramp area for aircraft to park, holding aircraft in this area until they are ready for takeoff allows for a more strategic sequencing at the departure queue. This helps to ensure that aircraft take off as close to their scheduled departure time as possible, regardless of when they contact the ground controller, and the motionless waiting period reduces the number of times thrust must be applied on the ground. This strategy, however, would necessarily increase workload for the ground controller, as sequencing the release of aircraft based on scheduled departure time would 27
34 be an additional task in present-day operations. This highlights the need for technological and/or procedural intervention in surface operations to increase efficiency. Malik, et al. (2010) tested a model for managing the release of departure aircraft from spots or gates over a long-term (one hour) time frame and a short-term (immediate) time frame. In high traffic scenarios using a simulated environment, the model increased throughput by 10% even with up to two minutes of uncertainty in spot arrival times. Additionally, Gunther, Hildebrandt, and Fricke (2010) compared taxi time estimation using static calculations via standard look-up tables and dynamic calculations based on the current traffic situation. They found that using static estimation, 42% of flights leaving the ramp had estimations within +/- 2 minutes, while 66% of flights had estimation within +/- 2 minutes when using dynamic calculations. While these results are encouraging, the human performance implications with the use of such systems require further attention. 5.2 Experiment Overview The goal of the present study is to identify how controllers could best benefit from different types of automated decision aids designed to improve the efficiency of surface operations at Dallas-Fort Worth International Airport (DFW). When compared with present-day operations, this increased focus on efficiency increases the complexity of a ground controller s responsibility, indicating the need for additional tools to maintain (or improve) the current level of mental workload, while also supporting the resumption of full manual performance in the event of automation failure. A prototype ground controller interface will be used, featuring three different types of decision aids: 28
35 1. Baseline no decision aid 2. Temporal Constraint Visualization graphical presentation of spatiotemporal constraints on the departure sequence 3. Timeline display graphical presentation of scripted release sequence based on an optimization algorithm These decision aids were motivated by the work of Jung, Hoang, Montoya, Gupta, Malik, Tobias, and Wang (2011), and their use of algorithms to aid the ground controller in sequencing the release of departure aircraft to the runway queue (also see Hoang, Jung, Holbrook, & Malik, 2011). Of particular interest to this study is determining the task performance costs and benefits associated with different types of decision aids. Conceptually, these aids (or lack thereof) can be thought of as utilizing three distinct types of automation, respectively no automation, information analysis presented graphically, and decision selection presented graphically. Any command-based decision aid, such as the Timeline display in this study, will necessarily operate on some set of assumptions relating to the state of the system (in this case, the relative positions of aircraft in the simulation). When these assumptions are not met, the human must override the automation s decision selection a task that is especially difficult when the human is not privy to the logic behind the decision aid. A potential benefit for the temporal constraint visualization (TCV) display is that the presentation of relevant information in a manner comprehensible to humans eases the decision-making process, while still giving the human complete control. Though the present research is being conducted in an applied aviation setting, there are also more theoretical implications informing the appropriate use of automation in other 29
36 dynamic, safety-critical settings. Namely, defining an appropriate level of human involvement in the overall decision-making process of complex systems and identifying potential pitfalls when automation is over or under-utilized. 5.3 Dallas-Fort Worth International Airport Surface Operations The present simulation will operate on a simplified model of south-flow surface operations on the east side of DFW. These assumptions include: runway 17R being used exclusively for departures with only one departure queue, runways 17C and 17L being used exclusively for arrivals, no traffic moving to or from the west side of the airport, and runway 13L not being utilized by the participant ground controller. The surface of the east side of DFW features three terminals, with hold spots placed in front of each terminal (see Figure 5.1). The concept of operations in this simulation is for participants to hold departure aircraft at these hold spots until they can taxi directly to the runway, rather than sending all departures immediately to the departure queue (see Figure 5.2). The release of aircraft from these hold spots will be controlled with the goal of departing aircraft on time, avoiding any unnecessary stops on the way to the runway, and maintaining maximal runway throughput when necessary. 5.4 Hypotheses With the main focus of this study being the sequencing of departure aircraft, hypotheses were made regarding (1) the timeliness of departures (according to scheduled departure times) and (2) efficiency of departures (minimizing approximate fuel consumption). The handling of arrival aircraft in this simulation will be treated as a secondary task in which (3) participants response times will be recorded. 30
37 Hypothesis 1: The TCV condition will result in more efficient departure sequences than both the Timeline and Baseline conditions; the Timeline condition will result in more efficient sequences than the Baseline condition. This is because the algorithm behind the Timeline decision aid does not consider the position of arrival aircraft on the taxiway, therefore likely resulting in some instances where participants cannot follow the Timeline due to safety concerns. The Baseline condition will result in inferior performance because there is no form of decision support for efficiently sequencing departures. Hypothesis 2: The Timeline condition will result in better performance than both the TCV and Baseline conditions at departing aircraft according to their scheduled departure time. This is because the algorithm determining the suggested release sequence for the Timeline considers the scheduled departure times of all aircraft and seeks to release aircraft so that they depart as close to these times as possible without incurring any unnecessary taxi delay. The TCV and baseline conditions have no form of support for achieving on time departures other than the electronic flight strips being sorted by scheduled departure time. Hypothesis 3: The TCV condition will result in lower response times for issuing instructions to arrival aircraft than both the Timeline and Baseline conditions. This is because the Timeline decision aid will likely draw participants attention away from other aspects of the display containing information about arrival aircraft, resulting in slightly 31
38 increased response times to arrivals. The lack of automated support in the Baseline condition will also likely result in a higher level of mental workload, which could negatively impact participants response times to arrival aircraft. 32


39 Figures Figure 5.1. The three terminals on the east side of DFW are A, C, and E. The orange dots in this image show the approximate positions of the hold spots utilized by aircraft in this simulation. Figure 5.2. In these images taken directly from the training material for participants, the concept of holding aircraft at spots is demonstrated. In the image on the left, all aircraft would have been sent directly to the departure queue as soon as they pulled up to a hold spot, resulting in wasted fuel from the stop-and-go traffic and likely an inefficient sequencing of departures based on scheduled departure time. In the image on the right, the aircraft would have been held at a hold spot until they could be sent directly to the runway for takeoff, avoiding unnecessary taxi delay and increasing efficiency. 33
40 6. Method 6.1 Participants Twenty-one instrument-rated pilots controlled simulated aircraft in a re-creation of surface operations at Dallas-Fort Worth International Airport. All participants were males between the ages of 19 and 25. Though none had prior experience controlling actual aircraft in the air or on the ground, limiting participation to only instrument-rated (or higher) pilots ensured that they had an adequate understanding of aviation terminology and a basic understanding of airport surface operations. All participants were students at the University of Illinois at Urbana-Champaign and were recruited via and flyers distributed around campus. Compensation was $20 per hour and participants completed three experimental sessions each. With most sessions lasting one hour and 45 minutes, total compensation was approximately $105 per participant and the top performer in each condition also received a $50 bonus. This bonus was used to motivate participants so that they were all trying to achieve the same goal. 6.2 Equipment The experiment was conducted in the Beckman Institute Illinois Simulator Laboratory s flight simulator, which was modified to support an air traffic control experiment (see Figure 6.1) Hardware. Three Hitachi ED-A100 projectors with 1280 x 1024 pixels of resolution projected a simulated out-the-window (OTW) view facing west from the DFW East Tower onto 34
41 three separate 120 x 90 screens. This OTW view was presented with a 150-degree lateral field of view in X-Plane 9.69, allowing the participants to see the entire area of airport surface under their control. The prototype interface was presented on a 70 LCD monitor positioned 83 in front of the center screen. Smart Eye XC-HR 50 eye tracking equipment was mounted on a metal frame approximately 24 in front of the LCD monitor, positioned such that it did not obstruct the participants view of the OTW screens or the LCD monitor (see Figure 6.2). Three eye-tracking cameras were positioned on the top of the frame with 12mm lenses approximately 41 away from the participant and two eye-tracking cameras were positioned on either side of the frame with 8mm lenses approximately 35 away from the participant. Participants were seated on an adjustable chair with their eyes 160 away from the center screen (77 away from LCD monitor and 53 away from the frame on which eye-tracking cameras were mounted). The chair height was adjusted for each participant so that their eyes were centered for the eye-tracking cameras at a height of 46.5, with the added benefit of ensuring that each participant viewed all displays from the same viewing angle. This positioning meant that the center of the LCD screen was viewed at an angle 12.5 degrees down, the center of the forward projector screen was 7.8 degrees up, and the center of the lateral projector screens were 7.5 degrees up and 41 degrees to either side. Participants interacted with the simulation via a standard computer mouse positioned on a surface to their right and a PI Engineering X-keys six-button keypad positioned on a surface to their left. All control inputs could be adequately performed with the mouse 35
42 alone, but the keypad allowed for more rapid control inputs once participants became familiar with it. The three projectors and LCD monitor were powered by four Prima XPC Shuttle computers with Intel Core 2 Duo E GHz, 3.25GB RAM, and NVIDIA GeForce 9800 GT 1GB video cards. Three of these computers generated the projector images by running X-Plane 9.69 simultaneously and were synchronized by the fourth master computer, which also ran the simulation software. A Dell Inspiron 1420 laptop computer was used to administer post-trial questionnaires Software. All computers were running Windows XP. The master computer ran the simulation software, which was programmed using Python 2.7 with a PyQt library. The simulation software automatically controlled the movements of aircraft outside the participants area of control based on pre-defined scripts and controlled the movements of aircraft inside the participants area of control based on participant-issued instructions. This master computer communicated aircraft positions to the three other computers, each of which then communicated with an independent version of X-Plane 9.69 via a plug-in. This plug-in allowed X-Plane to depict real-time representations of aircraft positions in the OTW view based on the simulation software. Aircraft models represented in the OTW view included the Canadair Regional Jet 100, Boeing , McDonnell Douglas MD-90, Boeing , and Boeing
43 Simulation scenarios. Simulation scenarios were generated based on data collected for the SODAA Tool developed by Mosaic ATM (Brinton, Lindsey, & Graham, 2010). These SODAA data aggregate actual flight information such as callsign, aircraft type, scheduled departure/arrival times, departure/arrival airports, assigned gate, etc., and links them to positional data collected for each flight. This positional data includes latitude/longitude coordinates and altitude at one-second intervals based on radar returns and GPS locations generated by that flight. The collection of information contained in SODAA data allows for a dynamic re-creation of aircraft movements based on actual operational data. The scenarios in this simulation were each based directly on a one-hour period of SODAA data collected at DFW on August 17 th -23 rd, 2009 between the hours of 10:00am and 3:00pm Central Daylight Time. Basing the scenarios on aircraft data collected at DFW ensured an accurate representation of variables such as the frequency of aircraft types, departure to arrival ratio, terminals used, and runways used. Each of these scenarios had its traffic density increased by a factor of 1.3 to 1.5 to increase traffic volume. This was done for three reasons: 1) to approximate the increase in overall traffic volume that is expected in coming years (JPDO, 2010), 2) to create a sufficiently challenging task for participants, and 3) to reduce the variability in overall traffic volume between scenarios. Each 20 minute scenario required participants to interact with 45 to 55 total aircraft, including both arrivals and departures. 37
44 Software control of departure queue. Departing aircraft in the runway queue were directly controlled by the simulation software. Take-offs were spaced by a minimum 72-second interval, meaning that any aircraft approaching the runway less than 72 seconds after the preceding aircraft had departed would have to wait at the runway hold short line. This known minimum interval, coupled with a constant taxi speed of 10.2 m/s for all aircraft in the simulation, was used as the basis for the decision aids utilized in this experiment. The number and positions of all aircraft in the departure sequence allowed for the precise calculation of when each aircraft would depart and how long they would have to wait at the hold short line, if at all. This information could either be presented directly to the participants via a graphical display or used by an algorithm to generate a timeline of the optimal release times for the aircraft still waiting at hold spots. Figure 6.3 illustrates how the positions of departures already in the sequence can be used to depict the earliest location a new aircraft can be inserted into the sequence without incurring any unnecessary taxi delay Decision aid functionality. The TCV decision aid used the information described above to provide participants with a graphical depiction of the departure sequence. The 72 second interval was presented spatially (734.4 meters scaled to the overhead map display), allowing participants to visualize the minimum takeoff separation. In addition, overlaps (instances of aircraft spaced less than 72 seconds apart) and gaps (instances of aircraft spaced more than 72 seconds apart) were depicted graphically to provide feedback to participants. This information was used to indicate to participants the earliest location in the departure 38
45 sequence that an aircraft could be released from its hold spot without incurring any unnecessary taxi delay (see Figure 6.3). The Timeline decision aid utilized an algorithm to present a suggested departure sequence to the participant. This algorithm functioned by considering the four aircraft with the earliest scheduled departure times currently waiting at hold spots. All permutations of release order and all possible release times within those orders were checked via an exhaustive search for the sequence that best minimized the sum of total departure time deviation and taxi delay. The output of this algorithm, which recalculated every 4 seconds, was a release time for each of those four aircraft presented graphically to the participants. 6.3 Tasks Participants performed simplified versions of the tasks required of actual DFW controllers. They were responsible for releasing departure aircraft from hold spots to the departure runway queue and sending arrival aircraft to their assigned terminal. Only when an aircraft entered their area of control were participants required to take action Departure aircraft. Participants primary task was to sequence the release of departure aircraft from hold spots so as to depart aircraft on time and minimize unnecessary taxi delay. At predetermined times based on SODAA data, aircraft parked at terminal gates would automatically push back and taxi to a hold spot, where they would then wait for participant instructions. Each departure aircraft had a scheduled departure time, which the participants were instructed to use for sequencing departures. The participants goal was to have each 39
46 aircraft depart as close to its scheduled departure time as possible, while minimizing the taxi time and number of stops during taxi for each aircraft. Once aircraft had been issued taxi instructions and reached the departure queue, they would automatically be handed-off to the simulation software. Figure 6.4 shows the path of departure aircraft while under the participants control and the point at which they were handed-off to the simulation software Arrival aircraft. At pre-determined times based on SODAA data, arriving aircraft would land on one of the arrival runways and begin taxiing towards the east side terminals. Upon reaching the participant s area of control, it would automatically be handed-off to the participant and wait for further taxi instructions. Each arrival aircraft had an assigned terminal and gate and it was the participants job to direct that aircraft to the appropriate terminal. Participants needed to keep up with incoming arrivals to prevent a backup of arrivals from potentially blocking a runway. Figure 6.5 shows the paths of arrival aircraft while being controlled by the simulation software up until the point they were handed-off to the participant ground controller. 6.4 Displays Three different versions of the prototype interface were presented to participants in three different experimental conditions. The baseline interface did not include a decision aid for sequencing the release of departure aircraft from spots and served as a control. Two experimental conditions included decision aids along with the prototype interface, one utilizing a TCV decision aid and the other utilizing a Timeline decision aid. 40
47 6.4.1 Baseline display. The baseline interface (see Figure 6.6) included the following features electronic flight strips, flight strip organization windows, an overhead map display, and preset taxi route buttons Electronic flight strips. The electronic flight strips, inspired by those included in the Tower Flight Data Manager proposed by Nene, Morgan, Diffenderfer, and Colavito (2010), contained all of the information needed by participants to effectively control an aircraft. There were nine data fields in each flight strip including callsign, aircraft type, ETD/ETA, arrival airport, assigned terminal and gate, updated departure time, assigned runway, assigned altitude, and the departure or arrival navigation fix. In addition, the left side of each flight strip included a window with a colored background and black symbol called the indication box, used to indicate the current taxi status of that aircraft. Examples of electronic flight strips containing each of the indication box symbols and colors are shown in Figure 6.7. When a specific aircraft had been selected by the participant for interaction, its flight strip data fields would appear in the enlarged flight strip (see Figure 6.8). The data fields were arranged in the same format as on the smaller flight strips, but were simply enlarged for clarity and to confirm which aircraft had been selected Flight strip organization windows. The electronic flight strips were contained within four flight strip windows appearing on the interface. The two departure flight strip windows contained flight strips for aircraft waiting at hold spots and taxiing to the runway. The two arrival flight strip 41
48 windows contained flight strips for aircraft arriving on runways 17L and 17C. Participants could select a specific aircraft for interaction by clicking on any of the electronic flight strips contained in these flight strip windows. The first departure flight strip window contained flight strips for aircraft waiting at hold spots and was labeled At Spot. These flight strips were arranged in order by departure time, with the earliest times appearing on the bottom. Anytime a new aircraft pulled up to a hold spot, it was inserted into the window at the appropriate position based on its departure time. The second departure flight strip window contained flight strips for aircraft in the process of taxiing to the runway and was labeled Departures 17R. Once the participant released an aircraft from a hold spot, its flight strip automatically moved from the At Spot window down to the Departures 17R window. Both the movement of the flight strip and change in the indication box indicated to the participant that the aircraft had begun taxiing. Once an aircraft had departed, its flight strip was automatically deleted. Figure 6.9 shows a screenshot of both the At Spot and Departures 17R flight strip windows. The first arrival flight strip window contained flight strips for aircraft landing on runway 17C and was labeled Arrivals 17C. Both the position of a flight strip in the window and the color/symbol in its indication box allowed the participant to determine that aircraft s phase of flight and if it was currently their responsibility. The second flight strip window contained flight strips for aircraft landing on runway 17L and was labeled Arrivals 17L. The flight strips in this window functioned the same as those in the Arrivals 17C window. Figure 6.10 shows a screenshot of both arrival flight strip windows. 42
49 Overhead map display. The overhead map display depicted the layout of the airport surface similar to current ASDE-X displays (see Gertz & Grappel, 2007; Smith, Evers, & Cassell, 1996). All aircraft were represented by a triangle icon showing their current position, heading, and movement. These icons were colored to match the indication box on that aircraft s corresponding flight strip. In addition to selecting aircraft by clicking on the flight strip, participants could also select a specific aircraft by clicking on its map icon. When an aircraft was selected, its map icon was highlighted by a yellow circle, and when instructions had been issued, the taxi route was shown on the overhead map as a yellow line (see Figure 6.11) Preset taxi route buttons. Participants issued taxi instructions to aircraft by clicking on preset buttons available to them after an aircraft had been selected. For departures, only one button was available since all departures used runway 17R. For arrivals, three preset buttons were available one for each terminal. The participants needed to locate the assigned terminal on the selected aircraft s flight strip and send it to the appropriate terminal by selecting the correct preset button. Once a preset button had been selected, the instructions were sent by clicking Submit. The six-button keypad could also be used to issue taxi instructions. The buttons on the keypad were arranged in the same format as the buttons on the interface and pressing the corresponding button on the keypad was functionally the same as clicking on that interface button with the mouse. 43
50 6.4.2 Temporal constraint visualization display. The TCV display contained all the features of the baseline display, with the addition of the TCV automated decision aid. This decision aid (see Figure 6.12 and Figure 6.13) took the form of colored lines and markers overlaid on the overhead map, which changed dynamically to represent the current departure sequence. The premise behind this decision aid was that with a known taxi speed, the minimum 72 second departure spacing was a spatiotemporal parameter that could be presented graphically on the overhead map display. This allowed the participants to visually see any overlaps or unnecessary gaps in the sequence and identify the earliest location a new departure could be inserted into the sequence without incurring any unnecessary taxi delay Timeline display. The Timeline display contained all of the features of the baseline display, with the addition of the Timeline automated decision aid. This decision aid consisted of an algorithm to determine the optimal release sequence of all aircraft currently waiting at spots and the Timeline display to convey this information to the participant. The algorithm (described in ) determined the release sequence that would depart aircraft as close to their scheduled departure time as possible, while also minimizing any unnecessary taxi delay for the aircraft waiting at the hold spots with the four earliest scheduled departure times. This release sequence was linked to the corresponding flight strips in the At Spot flight strip window (see Figure 6.14). For each of these flight strips, the point indicated on the Timeline represented how far into the future that aircraft should be released according to the optimal sequence. The algorithm did not, however, take into consideration the 44
51 location of any arrival aircraft that were already taxiing. If participants blindly followed the decision aid s suggested release times, collisions could potentially occur between departures leaving hold spots and arrivals already on the taxiway. In some instances, the optimal sequence called for aircraft to be released in a different order than their flight strips were arranged in the At Spot window. This would result in yellow lines crossing on the timeline because the flight strips were still arranged by scheduled departure time (see Figure 6.15). 6.5 Experimental Design A between-subjects manipulation of decision aid type was performed. Each of the twenty-one participants was randomly assigned to one of the three display conditions, for a total of seven participants in each condition. Eight data-collection trials were performed by each participant, for a total of 56 trials per condition. The scenarios for the data-collection trials, as well as the training trials, were presented to each participant in the same order Off-nominal events. Two different types of off-nominal events were scripted to occur during the datacollection trials, described as false radar returns and transmission errors. A false radar return featured a stationary icon appearing on the overhead map where there was no actual aircraft in the OTW view. A transmission error featured the icon of a pre-specified plane disappearing from the overhead map for a certain period of time, while the actual aircraft was still present in the OTW view. Each aircraft in a scenario was given a five percent chance of being flagged as an off-nominal aircraft. Of those flagged as off-nominal, the aircraft were randomly assigned 45
52 to be either a false radar return or a transmission error. The start and end times of the offnominal events were randomly generated, but always occurred inside the participants area of control Overhead map inaccuracies. Random noise was programmed into the overhead map display so that the position of an icon on the overhead map was never perfectly correlated with the position of the corresponding plane in the OTW view. A small offset would shift each icon in a random direction and the movements of the icons were in saccades, rather than smooth. The size of these saccades was slightly different for each aircraft, resulting in some icons moving more smoothly than others. These slight inaccuracies in the overhead map were meant to simulate the imperfect technologies used for tracking the position of aircraft on the airport surface Measures. Objective performance measures were collected from each trial to measure how well the participant sequenced timely and efficient departures, while also handling arriving aircraft. These measures consisted of three categories efficiency of departure sequencing (see 7.1), timeliness of departures (see 0), and handling of arrival aircraft (see 7.3). 6.6 Procedure All participants took part in three experimental sessions lasting between 90 and 120 minutes each. The first session consisted of training and three practice trials, with the second and third sessions consisting of four data-collection trials each. Upon arrival to the 46
53 first session, participants were given a brief overview of the experiment, signed the consent form, and had the eye-tracking equipment calibrated for them before beginning the training Training. Participant training consisted of a Microsoft PowerPoint presentation presented on the 70 LCD monitor, which was narrated by the experimenter. During the presentation, a paused OTW scene of DFW was shown on the projectors and was used by the experimenter as a reference to link certain aspects of the presentation to the OTW view. Participants were first given an overview of DFW surface operations and what role they would be playing in the simulation. They were then explained the benefits of time-based surface operations and how these could be implemented at DFW. Once a high-level overview of the concept of operations had been explained, participants were then provided in-depth details of how they would perform the tasks required of them using the prototype interface. Since the only difference between interface prototypes in the three conditions was the type (or lack) of decision aid, the basic features common to all three conditions and their functionalities were explained first. Finally, the decision aid (if any) and its functionality were described at the end of the training presentation. In absence of a decision aid, the baseline condition participants were instructed that they could use the distance between two terminals as a way to approximate the 72-second departure spacing in terms of distance. In the Timeline condition, given the fact that the decision aid could be perceived as issuing strict commands, participants were reminded that the algorithms behind the Timeline did not take into consideration the 47
54 position of arrival aircraft on the airport surface and that they were not required to follow the Timeline. At several points during the training, participants were reminded that the overhead map was not an exact representation of aircraft positions in the OTW view and that when in doubt about an aircraft s position, the OTW view should be trusted. The prospects of the off-nominal events described in were also mentioned, though the relative frequencies were not given, nor was it ever explicitly stated that the off-nominal events would occur at all Practice trials. After the completion of the training presentation, participants performed one 10- minute and two 20-minute practice trials. During the first trial, the experimenter assisted the participants and answered any questions. After that, participants received no more feedback and the two 20-minute trials were performed in the same conditions as datacollection trials Data-collection trials. During both the second and third experimental sessions, participants completed four 20-minute data-collection trials. After completing the last trial of the third experimental session, participants were debriefed and any questions about the experiment were answered. 48


55 Figures Figure 6.1. Images of the Illinois Simulator Laboratory flight simulator as configured for this experiment. The Frasca Model 142 cockpit simulator was removed and replaced by a 70 LCD monitor, eye tracking equipment, and a participant control station. Figure 6.2. Three images showing the simulator from the participants approximate head position. Note that the mounting frame for the eye-tracking cameras minimally obscures the OTW view. 49
56 Figure 6.3. As shown in [A], if the 2nd aircraft is exactly 72 seconds behind the 1st, then the earliest a 3rd aircraft could be inserted would be 144 seconds behind the 1st (72 seconds behind the 2nd). [B] shows that spacing the 2nd aircraft closer than 72 seconds behind the 1st does not affect the optimal position of a 3rd aircraft, but incurs a taxi delay and forces the 2nd aircraft to stop at the runway hold short. [C] shows that spacing the 2nd aircraft more than 72 seconds behind the 1st does not incur any taxi delay, but does delay the earliest position of a 3rd aircraft. When several aircraft are in the departure sequence, this concept can be used to determine the earliest an additional aircraft can be inserted into the sequence without incurring any taxi delay. 50
 onto the main taxiway and entered the departure queue at the point indicated by the arrow.")

57 Figure 6.4. Screenshot of overhead map depicting the taxi routes of departure aircraft. All departures taxied from a terminal area (or ramp ) onto the main taxiway and entered the departure queue at the point indicated by the arrow. Note that aircraft could join the main taxiway from any one of several hold spots in front of each terminal, not just one hold spot per terminal as this image might suggest. Figure 6.5. Screenshot of overhead map depicting the possible taxi routes of arrival aircraft. Arrivals on runway 17C could cross runway 17R at one of two points based on the high speed exit used. Arrivals on runway 17L would taxi on the loop around runways 17C and 17R. Participants were responsible for directing arrivals to their assigned terminal from any one of the three hand-off points indicated by arrows. 51
, electronic flight strips (2), flight strip organization windows (3), preset taxi route")
58 Figure 6.6. Diagram of the baseline interface. This interface included an overhead map display (1), electronic flight strips (2), flight strip organization windows (3), preset taxi route buttons (4), and an enlarged flight strip for the aircraft currently being interacted with (5). 52

59 Figure 6.7. Examples of the indication boxes appearing on the left side of each flight strip. A blue background and square indicated that an aircraft was a departure waiting at a hold spot; a green background and triangle indicated the aircraft was a departure taxiing in the participant s area of control; a red background and triangle indicated the aircraft was an arrival taxiing in the participant s area of control; a yellow background and pause symbol indicated than an aircraft was stopped somewhere on the airport surface waiting for participant instructions; and an orange background and X indicated that an aircraft was being controlled by the simulation software (though participants were told that this meant it was being controlled by the tower controller ). Figure 6.8. Image of the enlarged flight strip. This contained the information of the currently selected aircraft. All information was arranged in the same manner as on the smaller electronic flight strips, but the strip was enlarged and placed in the center of the screen for easier viewing. 53

60 Figure 6.9. Screenshot of the departure flight strip windows. These consisted of the At Spot window and the Departures 17R window. Flight strips in the At Spot window were arranged by scheduled departure time and a flight strip was automatically moved down to the Departures 17R window when its corresponding aircraft had been released. Upon entering the queue, the indication box changed to an orange X and upon takeoff the flight strip was deleted. 54


61 Figure Screenshot of the arrival flight strip windows. These consisted of the Arrivals 17C window and the Arrivals 17L window. Flight strips appeared in these windows once their corresponding aircrafts were on final approach. They remained above the black line while they were with the tower controller and moved below the line upon reaching the participant ground controller s area. Once below the line, the flight strip s indication box alerted the participant that instructions were required. Figure Screenshot of a portion of the overhead map display. Visible here are terminals A and C, runways 17R and 17C, and the departure queue. The currently selected aircraft is highlighted by a yellow circle and the current taxi instructions are depicted by a yellow line on the taxiways. Clicking anywhere on the map would select the nearest icon and the icons were colored to match each aircraft s corresponding flight strip. 55


62 Figure Screenshot of the TCV decision aid. In this example, the second aircraft was released to the left of where the green marker was, resulting in a gap represented by the white line. The green marker is now positioned meters to the left of the second aircraft. The gap in this image represents excessive spacing between the departures. Figure Screenshot of the TCV decision aid. In this example, the second aircraft was released to the right of where the green marker had previously been, resulting in an overlap represented by the red line. Because the second aircraft can take off no sooner than 72 seconds after the first, the green marker is positioned meters to the left of where it had previously been (the end of the red line), not the actual position of the second aircraft. The overlap in this image represents taxi delay caused by departures being spaced too closely together. 56

63 Figure Screenshot of the Timeline decision aid. The aircraft with the next four scheduled departure times were given release times on the timeline according to an optimization algorithm. This algorithm recalculated every four seconds. 57

64 Figure Screenshot of the Timeline decision aid. In some instances, the optimal release sequence called for aircraft to be released in an order other than their scheduled departure time. In this example, the highlighted aircraft would be released first, even though it is second in the At Spot window. 58
65 Tables Table 6.1. Queries and response options presented to participants in the SAGAT questionnaire. All participants answered each query, but the order was randomized for each trial. Query Response Options Which terminal has the highest spot congestion? Where is the most recent arrival located on the airport surface? How many aircraft are at spots awaiting instruction? How many spots are occupied by aircraft that are late relative to their departure times? How many arrival aircraft have touched down but not yet reached their assigned spot How many departure aircraft have left their spot and are taxiing? What is the destination terminal of the last arrival you took control of? How many aircraft are waiting at the runway hold-short awaiting takeoff? Where is the last departure aircraft you released from its spot? How many aircraft are scheduled to be released in the next 3 minutes had the session continued? Which departure queue is shortest? A, C, E Occupying runway; Taxiing on taxiway between runways and/or below departure runway; Holding short of active runway; Moving down taxiway towards spot (includes loop above departure runway); Turning into spot; In ramp area; Moving on taxiway to West side ,1, 2, 3, 4, 5, 6 or more 0, 1, 2, 3, 4, 5, 6 or more 0, 1, 2, 3, 4, 5, 6 or more A, C, E, none of the above 0, 1, 2, 3, 4, 5, 6 or more In front of Terminal A; In front of Terminal C; In front of Terminal E; In or nearing departure queue(s) 0, 1, 2, 3, 4, 5, 6 or more Inner, Outer, Middle 59
66 Table 6.1 (cont.) Query Where is the last departure aircraft you released from its spot? Which spots have aircraft that are late relative to their departure time? How many arrivals are awaiting instruction? Response Options At spot; Turning out of spot; Moving down taxiway; In departure queue; Taxiway to West side; On runway; Departed 9; 10; 11; 14; 15; 31; 32; 33; 34; 36; 37; 38; 39; 45; 46; 47; All spots in front of Terminal A; All spots in front of Terminal C; All spots in front of Terminal E 0, 1, 2, 3, 4, 5, 6 or more 60
67 7. Results 7.1 Efficiency of Departure Sequencing Two measures were used to assess the efficiency of participants departure sequencing by approximating unnecessary fuel consumption. These measures included Taxi Delay and Queue Stops. Taxi Delay was defined as any additional taxi time (in seconds) above the minimum for an aircraft due to waiting in the departure queue. Queue Stops were defined as the number of times an aircraft came to a complete stop inside the departure queue. Without having to wait for an aircraft in front of it, any departing aircraft would taxi directly onto the runway without stopping or slowing down in the departure queue. Therefore, any observed Taxi Delay or Queue Stops were a direct result of inefficient departure spacing and perfect performance would be represented by values of zero on both measures Taxi Delay. Figure 7.1 shows the mean Taxi Delay for each condition with standard error. Figure 7.2, Figure 7.3, and Figure 7.4 show the mean Taxi Delay learning curves for the Baseline, TCV, and Timeline conditions, respectively. Figure 7.5 shows the mean Taxi Delay learning curves for each condition, as well as the overall average for all participants. A Repeated Measures ANOVA was performed to test for differences in mean Taxi Delay between the Baseline (M = 36.10, SE = 0.78), TCV (M = 5.19, SE = 0.23), and Timeline (M =15.27, SE = 0.32) conditions (see Figure 5). A significant main effect was found for decision aid type, F(2, 18) = 4.87, p <
68 Pairwise comparison between conditions. A pairwise comparison between display conditions was performed using Tukey s HSD procedure to control family-wise Type I error. There was a significant difference between the Baseline and TCV conditions, p <.001, indicating that participants in the TCV condition were more effective at minimizing aircraft taxi time. No significant differences were found between the Baseline and Timeline conditions, p =.13, or between the TCV and Timeline conditions, p = Queue Stops. Figure 7.6 shows the mean Queue Stops for each condition with standard error. Being closely related to Taxi Delay, participant performance on Queue Stops showed a similar pattern of performance across the different scenarios. Figure 7.7, Figure 7.8, and Figure 7.9 show the mean Queue Stops learning curves for the Baseline, TCV, and Timeline conditions, respectively. Figure 7.10 shows the mean Queue Stops learning curves for each condition, as well as the overall average for all participants. A Repeated Measures ANOVA was performed to test for differences in the mean number of Queue Stops for each aircraft between the Baseline (M = 0.87, SE = 0.012), TCV (M = 0.27, SE = 0.004), and Timeline (M = 0.63, SE = 0.006) conditions (see Figure 6). A significant main effect was found for decision aid type, F(2, 18) = 6.52, p < Pairwise comparison between conditions. A pairwise comparison between display conditions was performed using Tukey s HSD procedure to control family-wise Type I error. There was a significant difference between the Baseline and TCV conditions, p <.01, and a marginally significant difference 62
69 between the TCV and Timeline conditions, p =.10. These results indicate that aircraft controlled by participants in the TCV condition had fewer stops in the departure queue than both the Baseline and Timeline conditions. No significant difference was found between the Baseline and Timeline conditions, p = Timeliness of Departures Participants were assessed on their ability to depart aircraft as close to the scheduled departure times as possible. This was done by recording Departure Time Deviation. Departure Time Deviation was defined as the absolute value difference between an aircraft s actual takeoff time and the scheduled departure time appearing on its flight strip Departure Time Deviation. Figure 7.11 shows the mean Departure Time Deviation for each condition with standard error. Figure 7.12, Figure 7.13, and Figure 7.14 show the mean Departure Time Deviation learning curves for the Baseline, TCV, and Timeline conditions respectively. Figure 7.15 shows the Departure Time Deviation learning curves for each condition, as well as the overall average for all participants. A Repeated Measures ANOVA was performed to test for differences in mean Departure Time Deviation between the Baseline (M = , SE = 1.17), TCV (M = , SE = 1.23), and Timeline (M = , SE = 1.21) conditions. No significant main effect was found for decision aid type, F(2, 18) = 0.79, p =
70 7.3 Handling of Arrival Aircraft Treated as a secondary task in this experiment, participants ability to issue instructions to arrival aircraft was measured by their response times. Arrival Reaction Time (RT) was defined as the length of time (in seconds) an arrival aircraft spent waiting for instructions after entering the participant s area of control Arrival reaction time. Figure 7.16 shows the mean Arrival RT for each condition with standard error. The Baseline condition showed a general learning curve with this variable, the TCV condition showed relatively stable performance, and the Timeline condition appears to have performed somewhat worse as they progressed to the later trials. Figure 7.17, Figure 7.18, and Figure 7.19 show the mean Arrival RT learning curves for the Baseline, TCV, and Timeline conditions respectively. Figure 7.20 shows the mean Queue Stops learning curves for each condition, as well as the overall average for all participants. A Repeated Measures ANOVA was performed to test for differences in the mean Arrival Reaction Time between the Baseline (M = 21.23, SE = 0.24), TCV (M = 22.35, SE = 0.29), and Timeline (M = 28.74, SE = 0.36) conditions. No significant main effect was found for decision aid type, F(2, 18) = 0.53, p =
71 Mean Taxi Delay (s) Mean Taxi Delay (s) Figures Baseline TCV Timeline Display Condition Figure 7.1. Taxi Delay for each condition with error bars representing SE Scenario Figure 7.2. Taxi Delay learning curve for the Baseline condition with error bars representing SE. 65
72 Mean Taxi Delay (s) Mean Taxi Dealy (s) Scenario Figure 7.3. Taxi Delay learning curve for the TCV condition with error bars representing SE Scenario Figure 7.4. Taxi Delay learning curve for the Timeline condition with error bars representing SE. 66
73 Mean Queue Stops Mean Taxi Delay (s) Baseline TCV Timeline All Scenario Figure 7.5. Taxi Delay learning curves for each condition, as well as the overall average for all subjects. The Baseline condition showed a noticeable improvement, while the TCV and Timeline conditions showed relatively stable performance Baseline TCV Timeline Display Condition Figure 7.6. Mean Queue Stops (per aircraft) for each condition with error bars representing SE. 67
74 Mean Queue Stops Mean Queue Stops Scenario Figure 7.7. Queue Stops learning curve for the Baseline condition with error bars representing SE Scenario Figure 7.8. Queue Stops learning curve for the TCV condition with error bars representing SE. 68
75 Mean Queue Stops Mean Queue Stops Scenario Figure 7.9. Queue Stops learning curve for the Timeline condition with error bars representing SE. Baseline TCV Timeline All Scenario Figure Queue Stops learning curves for each condition, as well as the overall average for all subjects. This chart shows the close relationship between Queue Stops and Taxi Delay (see Figure 7.5). 69
76 Mean Departure Time Deviation (s) Mean Departure Time Deviation (s) Baseline TCV Timeline Display Condition Figure Mean Departure Time Deviation for each condition with error bars representing SE. Note: the vertical axis begins at Scenario Figure Departure Time Deviation learning curve for the Baseline condition. Error bars representing SE are present, though they are small enough to be mostly hidden behind the markers. 70
77 Mean Departure Time Deviation (s) Mean Departure Time Deviation (s) Scenario Figure Departure Time Deviation learning curve for the TCV condition. Error bars representing SE are present, though they are small enough to be mostly hidden behind the markers Scenario Figure Departure Time Deviation learning curve for the Timeline condition. Error bars representing SE are present, though they are small enough to be mostly hidden behind the markers. 71
78 Mean Arrival RT (s) Mean Departure Time Deviation (s) Baseline TCV Timeline All Scenario Figure Departure Time Deviation learning curves for each condition, as well as the overall average for all subjects. As shown by this figure, this variable was mostly determined by various aspects of the scenarios themselves, rather than participant performance Baseline TCV Timeline Display Condition Figure Mean Arrival RT for each condition with error bars representing SE. 72
79 Mean Arrival RT (s) Mean Arrival RT (s) Scenario Figure Arrival RT learning curve for the Baseline condition with error bars representing SE Scenario Figure Arrival RT learning curve for the TCV condition with error bars representing SE. 73
80 Mean Arrival RT (s) Mean Arrival RT (s) Scenario Figure Arrival RT learning curve for the Timeline condition with error bars representing SE. Baseline TCV Timeline All Scenario Figure Arrival RT learning curves for each condition, as well as the overall average for all subjects. The TCV condition showed relatively stable performance over time, while the Baseline condition improved slightly and the Timeline condition performed more poorly. 74
81 8. Discussion 8.1 Efficiency of Departure Sequencing In partial support of Hypothesis 1, the TCV condition showed a significantly lower mean Taxi Delay and number of Queue Stops than the Baseline condition, as well as a marginally significant lower mean Taxi Delay and number of Queue Stops than the Timeline condition. This suggests that participants in the TCV condition were more effective at minimizing fuel consumption and excessive taxi time that participants in the other two conditions. Counter to Hypothesis 1, there were no significant differences between the Baseline and Timeline conditions on either measure of departure sequence efficiency. However, Jung et al. (2011) saw a similar non-significant difference between a baseline condition and similar timeline display. While the TCV and Timeline conditions showed relatively stable performance on these two variables, the Baseline condition had a noticeable learning curve, as evidenced by Figure 7.5 and Figure This suggests that with sufficient experience to constitute expert performance, participants in the Baseline condition may be able to sequence departures as efficiently as participants in the two decision aid conditions. While this may hold true in a lab setting, it is unlikely that this would transfer to actual operations. The task for actual ground controllers is significantly more complex than the simplified version tested in this study. While participants in the Baseline condition appeared to have adequate mental resources to efficiently sequence departures after sufficient practice, it is unlikely that actual controllers would have the necessary mental resources available to add this task 75
82 to their already complex procedures without a procedural change or the addition of some form of automation. 8.2 Timeliness of Departures While no significant results were observed for the Departure Time Deviation variable, the Timeline condition showed nominally better performance than both the TCV and Baseline conditions. While this nominal difference is not significant, it was expected because, as described in Hypothesis 2, the Timeline condition was the only one of the three that provided any automated support for departing aircraft on time. Perhaps the most striking observation when observing the data for mean Departure Time Deviation is the incredibly strong influence of the scenarios on this variable. This influence is exemplified in Figure 7.15 and is also apparent when looking at the data for individual participants (see Appendix B.3). It is important to remember at this point that these scenarios, including all associated times for scheduled departure and aircraft pushback, were derived from SODAA data for actual operations at DFW. While there will naturally be variation with regards to overall traffic volume and other variables, as discussed in the traffic volume in these scenarios was adjusted by a factor 1.3 to 1.5 to reduce the variation between scenarios. The total number of departures pulling up to a hold spot in any given scenario ranged from a low of 21 to a high of 27. This relatively narrow range suggests that various temporal aspects of the scenario are primarily responsible for the observed Mean Departure Time Deviations, rather than simply the total traffic volume. An example of one such temporal aspect could be the relative density of departures in the scenarios. 76
83 A scenario with lower density might have all departure times dispersed relatively uniformly over the 20 minute scenario, while a scenario with higher density might have departure times arranged in clumps, resulting in periods of relatively low traffic volume followed by periods of drastically increased volume and vice versa. These clumped departure times may act to increase overall Departure Time Deviation in a non-linear fashion, so that the same total number of departures can yield different delay times depending on traffic density. Another fact that bears mentioning is the relatively short duration of these scenarios. The nature of the Departure Time Deviation measure leads a participant s influence to become stronger over time. In other words, participant performance has very little to do with how early/late a departure aircraft is at the beginning of a scenario, but their performance level begins to exert a stronger influence on this variable as the scenario progresses. This leads to the assumption that experimental trials featuring longer scenarios would observe a stronger effect for decision aid type on the Departure Time Deviation variable. This, coupled with the nominal differences between display conditions, suggests that significant differences might have been observed if longer scenarios were used. 8.3 Handling of Arrival Aircraft No significant differences were observed between display conditions for mean Arrival RT, though the Timeline condition did have nominally higher Arrival RTs when compared to the other two conditions. This seems to partially support Hypothesis 3, and is likely due to the allocation of attention for participants in that condition. The Timeline display, being directly integrated with the At Spot flight strip window, was positioned to 77
84 the far right of the display. This likely resulted in participants focusing a disproportionate amount of attention to that side of the display, consequently focusing less on the overhead map and the arrival flight strip windows positioned on the left side of the display. Further analysis of eye-tracking data could provide some answers for this nominal difference. 8.4 Recommendations for Future Research Several interesting questions are raised by the results of this research, perhaps most notably the issue of expert performance. The improvement of the Baseline condition on Taxi Delay and Queue Stops as the scenarios progressed (even outperforming the Timeline condition on the last two scenarios) hints that with true expert performance, the Baseline condition would be comparable or better than conditions with decision aids. Longer studies which continue after the learning curve has flattened could shed light on this issue. Related to this is task performance under automation failure. With the Baseline condition, there was no automation for the participants to rely on, but with an automated decision aid there could be serious degradation of failure performance if the aid is relied on inappropriately. By taking an automated decision aid away from participants, unannounced, their performance in simulated failure modes could be examined. This type of study would highlight how the TCV and Timeline decision aids affect participants mental models of the task. If, for example, a participant in the Timeline condition has a significantly altered mental model of the system, this could cause problems in manual performance when that decision aid is taken away. Additionally, a follow-up study could examine exactly how participant performance affects Departure Time Deviation by varying the length of 78
85 experimental scenarios. As explained in 8.2, the relatively short duration of the scenarios used in this study likely limited how much participant performance affected this variable. 79
86 9. Conclusion As NextGen becomes a reality, the issue of designing appropriate automated systems becomes more critical. The human factors implications for specific types of automation and related failure performance must be fully understood for a truly robust NAS system. This research aims to further our understanding of how decision aid type affects task performance in a simulated NextGen environment and other complex dynamic domains. While this evaluation does not establish a standard for the types of automated decision aids that should be implemented for this or any other task, it does highlight the need for rigorous evaluations related to automation type. More advanced degrees of automation, often based on optimization algorithms with non-transparent logic, do not necessarily lead to increased task performance and have been shown previously to have a potentially negative effect on situation awareness. These factors indicate the need for determining the optimal degree of decision automation in specific domains. 80
87 References Bennett, K. & Flach, J. (1992). Implications for Divided Attention, Focused Attention, and Problem Solving. Human Factors, 34(5), Boring, E. (1942). Sensation and Perception in the History of Experimental Psychology. Ney York: Appleton-Century-Crofts. Brinton, C., Wood, B., & Engelland, S. (2008). Microscopic Analysis of Airport Surface Sequencing. AIAA 26 th Congress of International Council of the Aeronautical Sciences (ICAS) including 8 th AIAA Aviation Technology, Integration, and Operations, Anchorage, AK. Brinton, C., Lindsey, J., & Graham, M. (2010). The Surface Operations Data Analysis and Adaptation tool: Innovations and applications. Proceedings of the 29 th Digital Avionics Systems Conference (DASC), Salt Lake City, UT. Burns, C. & Hajdukiewicz, J. (2004). Ecological Interface Design. Boca Raton, FL: CRC Press. Carswell, C. & Wickens, C. (1987). Information integration and the object display. Ergonomics, 30, Carswell, C & Wickens, C (1990). The perceptual interaction of graphical attributes: Configurality, stimulus homogeneity, and object integration. Perception & Psychophysics, 47, Chang, Y.H. & Yeh, C.H. (2010). Human Performance Interfaces in Air Traffic Control. Applied Ergonomics, 41, Endsley, M. (1988a). Situation awareness global assessment technique. Proceedings of the IEEE National Aerospace and Electronics Conference: NAECON 1988, Dayton, OH, Vol. 3, Endsley, M. (1988b). Design and evaluation for situation awareness enhancement. Proceedings of the Human Factors Society 32 nd Annual Meeting, Anaheim, CA, Endsley, M. (1993). Situation awareness and workload: Flip sides of the same coin. Proceedings of the Seventh International Symposium on Aviation Psychology, Apr , Columbus, OH,
88 Endsley, M. (1995a). Toward a Theory of Situation Awareness in Dynamic Systems. Human Factors, 37(1), Endsley, M. (1995b). Measurement of Situation Awareness in Dynamic Systems. Human Factors, 37(1), Endsley, M. & Kiris, E. (1995). The Out-of-the-Loop Performance Problem and Level of Control in Automation. Human Factors, 37(2), Erzberger, H. (2004). Transforming the NAS: The Next Generation Air Traffic Control System, in 24 th International Congress of the Aeronautical Sciences, Yokohama, Japan. Federal Aviation Administration (2009). Operational Data Reporting Requirements. Order JO F. Foyle, D., Hooey, B., Kunkle, C., Schwirzke, F., & Bakowski, D. (2009). Piloted Simulation of NextGen Time-based Taxi Clearances and Tailored Departures. Proceedings of the 2009 IEEE/AIAA Integrated Communications, Navigation, and Surveillance Conference (ICNS), Arlington, VA. Gertz, J. & Grappel, R. (2007). Surveillance Improvement Algorithms for Airport Surface Detection Equipment Model X (ASDE-X) at Dallas-Fort Worth Airport (FAA Publication No. ATC-333). Gunther, T., Hildebrandt, M., & Fricke, H. (2010). Contributions of Advanced Taxi Time Calculation to Airport Operations Efficiency. Journal of Aerospace Operations, 1(1-2), Hoang, T., Jung, Y., Holbrook, J., & Malik, W. (2011). Tower Controllers Assessment of the Spot and Runway Departure Advisor (SARDA) Concept. 9 th USA/Europe Air Traffic Management Research and Development Seminar, June 14-17, Berlin, Germany. Hooey, B., Foyle, D., & Andre, A. (2000). Integration of cockpit Displays for Surface Operations: The Final Stage of a Human-Centered Design Approach. SAE Transactions: Journal of Aerospace, 109, Hutchins, E., Hollan, J., & Norman, D. (1985). Direct Manipulation Interfaces. Human- Computer Interaction, 1,
89 JPDO (2008). NextGen Avionics Roadmap, Ver. 1. Washington, D.C.: Joint Planning and Development Office. JPDO (2010). Concept of Operations for the Next Generation Air Transportation System, Ver. 3. Washington, D.C.: Joint Planning and Development Office. Jung, Y., Hoang, T., Montoya, J., Gupta, G., Malik, W., Tobias, L., & Wang, H. (2011). Performance Evaluation of a Surface Traffic Management Tool for Dallas/Fort-Worth International Airport. Ninth USA/Europe Air Traffic Management Research and Development Seminar, Berlin, Germany. Kaber, D. & Endsley, M. (2004). The effects of level of automation and adaptive automation on human performance, situation awareness and workload in a dynamic control task. Theoretical Issues in Ergonomics Science, 5(2), Kaber, D., Perry, C., Segall, N., McClernon, C., Prinzel, L. (2006). Situation awareness implications of adaptive automation for information processing in an air traffic control-related task. International Journal of Industrial Ergonomics, 36, Kirlik, A., Walker, N., Fisk, A., & Nagel, K. (1996). Supporting Perception in the Service of Dynamic Decision Making. Human Factors, 38(2), Lee, K. & Davis, T. (1995). The Development of the Final Approach Spacing Tool (FAST): A Cooperative Controller-Engineer Design Approach. NASA Technical Memorandum Moffett Field, CA: NASA Ames Research Center. Malik, W., Gupta, G., & Jung, Y. (2010). Managing departure aircraft release for efficient airport surface operations. AIAA Guidance, Navigation, and Control Conference, Anchorage, AK. Merikle, P. & Joordens, S. (1997). Parallels between Perception without Attention and Perception without Awareness. Consciousness and Cognition, 6(2-3), Moray, N. (1986). Monitoring behavior and supervisory control. In K. Boff, L. Kaufman, & J. Thomas (Eds.), Handbook of perception and human performance, 40/1-40/51. New York, NY: Wiley. Nene, V., Morgan, C., Diffenderfer, P., Colavito, A. (2010). A Mid-Term Concept of Operations for a Tower Flight Data Manager (TFDM). MP090169R1, The MITRE Corporation, McLean, VA. 83
90 Norman, D. (1986). Cognitive Engineering. In D.A. Norman & S.W. Draper (Eds.), User Centered System Design: New Perspectives on Human-Computer Interaction, Hillsdale, NJ: LEA. Norman, D. (1990). The Problem with Automation: Inappropriate Feedback and Interaction, not Over-Automation. In D.E. Broadbent, A. Baddeley, & J. T. Reason (Eds.), Human Factors in Hazardous Situations, Oxford: Oxford University Press. Parasuraman, R., Sheridan, T., & Wickens, C. (2000). A Model for Types and Levels of Human Interaction with Automation. IEEE Transactions on Systems, Man, and Cybernectics Part A: Systems and Humans, 30(3), Parasuraman, R. & Wickens, C. (2008). Humans: Still Vital After All These Years of Automation. Human Factors, 50(3), Pomerantz, J. & Pristach, E. (1989). Emergent features, attention, and perceptual glue in visual form perception. Journal of Experimental Psychology: Human Perception and Performance, 15(4), Prevot, T., Battiste, V., Palmer, E., and Sheldon, E. (2003). Air Traffic Concept Utilizing 4D Trajectories and Airborne Separation Assurance. Proceedings of the AIAA Guidance Navigation and Control Conference, Dallas, TX. Rasmussen, J. (1983). Skills, Rules, and Knowledge; Signals, Signs, and Symbols, and other Distinctions in Human Performance Models. IEEE Transactions on Systems, Man, and Cybernetics, 13(3), Rasmussen, J. (1986). Information processing and human-machine interaction: An approach to cognitive engineering. New York, NY: North-Holland. Rasmussen, J. & Vicente, K. (1989). Coping with human errors through system design: Implications for ecological interface design. International Journal of Man-Machine Studies, 31, Riley, V. (1989). A general model of mixed-initiative human-machine systems. Proceedings of the Human Factors and Ergonomics Society 33 rd Annual Meeting, Santa Monica, CA,
91 Robinson, J. & Isaacson, D. (2000). A Concurrent Sequencing and Deconfliction Algorithm for Terminal Area Air Traffic Control. NASA A , AIAA Guidance, Navigation, and Control Conference and Exhibit, Denver, CO. Sheridan, T. (2002). Humans and automation: Systems design and research issues. New York, NY: Wiley. Shneiderman, B. (1982). The future of interactive systems and the emergence of direct manipulation. Behaviour & Information Technology, 1(3), Shneiderman, B. (1983). Direct manipulation: A step beyond programming languages. IEEE Computer, 16(8), Smith, A., Evers, C., & Cassell, R. (1996). Evaluation of Airport Surface Surveillance Technologies. Radar, 1996: Proceedings from CIE International Conference on Radar, Beijing, China, Swenson, H., Hoang, T., Engelland, S., Vincent, D., Sanders, T., Sanford, B., & Heere, K. (1997). Design and Operational Evaluation of the Traffic Management Advisor at the Fort Worth Air Route Traffic Control Center. 1 st USA/Europe Air Traffic Management Research and Development Seminar, Saclay, France. Vicente, K. & Rasmussen, J. (1992). Ecological Interface Design: Theoretical Foundations. IEEE Transactions on Systems, Man, and Cybernetics, 22(4), Wickens, C., Carswell, C. (1995). The Proximity Compatibility Principle: Its Psychological Foundation and Relevance to Display Design. Human Factors, 37(3), Wickens, C., Mavor, A., Parasuraman, R. & McGee, J. (1998). The Future of Air Traffic Control Human Operators and Automation. Washington, D.C: National Academy Press. Wickens, C. & Hollands, J. (1999). Engineering Psychology and Human Performance, 3 rd edition. Englewood Cliffs, NJ: Prentice Hall. Wickens, C., Lee, J., Liu, Y., & Gordon-Becker, S. (2004). An Introduction to Human Factors Engineering, 2 nd edition. Upper Saddle River, NJ: Prentice Hall. Wickens, C. (2008). Multiple Resources and Mental Workload. Human Factors Golden Anniversary Special Issue, 3,
92 Wickens, C., Li, H., Santamaria, A., Sebok, A., & Sarter, N. (2010). Stages and Levels of Automation: An Integrated Meta-analysis. Proceedings of the Human Factors and Ergonomics Society 54 th Annual Meeting, San Francisco, CA, Zingale, C., Willems, B., & Ross, J. (2010). Air Traffic Controller Workstation Enhancements for Managing High Traffic Levels and Delegated Aircraft Procedures. Proceedings of the Human Factors and Ergonomics Society 54 th Annual Meeting, San Francisco, CA,
93 Appendix A: Participant Training The participants were trained to control aircraft in this simulation using a PowerPoint presentation narrated by the experimenter. Participants were seated in the simulator in front of the LCD traffic display with a static projection of DFW East on the OTW screens. The experimenter went through the training presentation while reading a scripted caption for each slide, allowing the participant to ask questions at any point. The slides contained very little text and almost exclusively used graphics (e.g. arrows) to highlight relevant display items so that participants would focus on the display item being discussed. At certain points in the presentation, the experimenter would walk around the simulator pointing out relevant features and landmarks in the OTW view. The training was the same for all three conditions, except for a small number of slides at the end of the presentation detailing how to sequence the release of departure aircraft. These slides were specific to the decision aid the participant would be using and were presented last so that the overall presentation was very similar for all three conditions. Because the entire training presentation is prohibitively large for reproduction here, this appendix features a general overview of the topics discussed during the training presentation and a selection of the more notable slides as examples. For each condition, the section of the training presentation related to sequencing the release of departure aircraft is discussed in detail to highlight the differences between versions of the presentation. 87
94 A.1 General Task Training Here, the training presentation is divided into sections based on topic to aid the reader in understanding the training approach. In the actual presentation, however, there were no distinct sections and the presentation flowed directly from topic to topic. A.1.1 Familiarization with the DFW airport layout. Participants were first familiarized with DFW by showing an overhead map image of the airport and explaining that of the two airport sides, they would only be responsible for the east side. Graphics were presented on these slides to indicate where the east side tower is located and identify what the participant is seeing in the OTW view from the tower perspective. This information was then used to transition to the overhead map view of the interface and provide the participant with a reference of what the overhead map is showing. The approximate areas of control for ground and tower controllers are then overlaid on the map. A selection of slides pertaining to this topic is shown below. 88
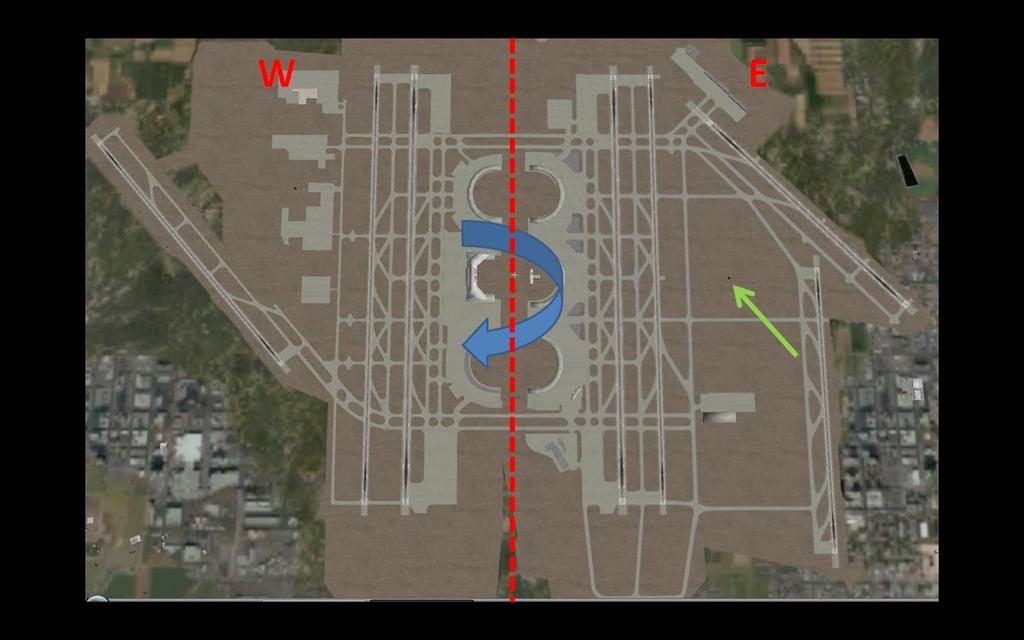
95 89
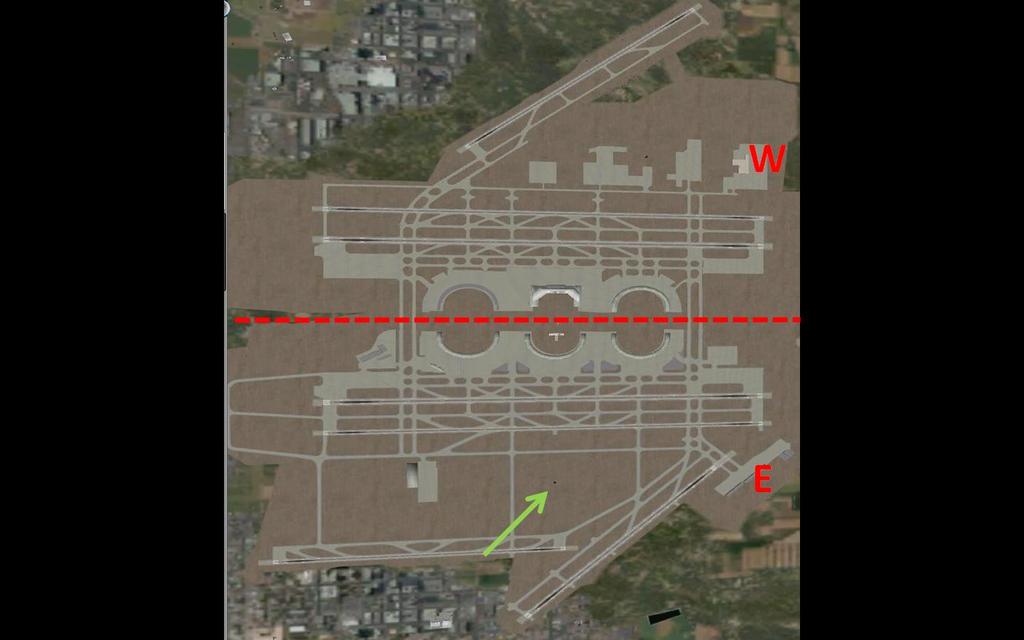
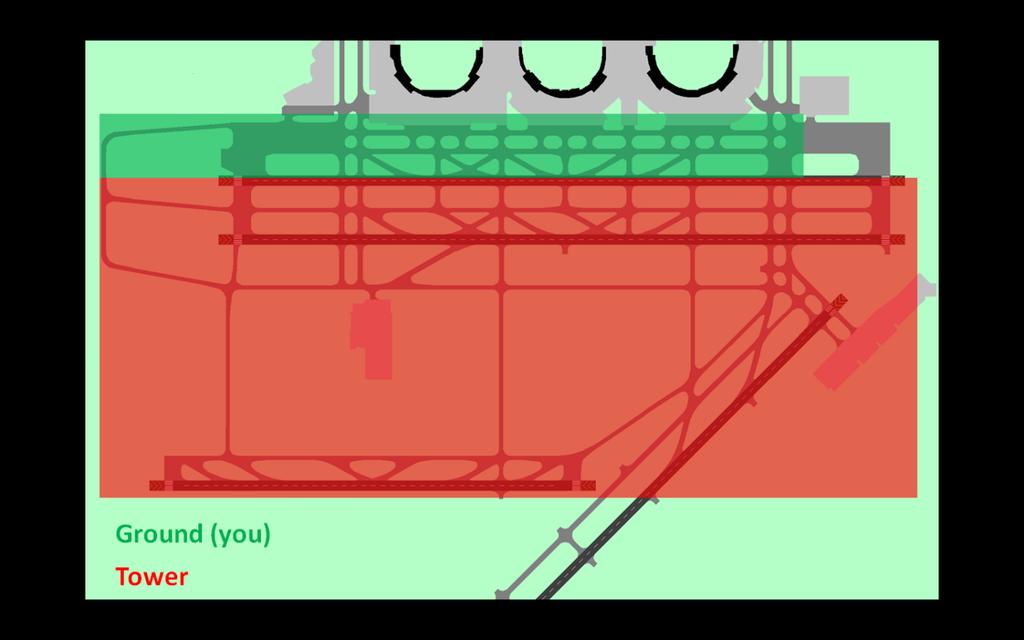
96 90

97 A.1.2 Time-based surface operations. Participants were first shown an overview of the route departure aircraft take on the way to the departure queue. The current use of the departure queue sending departure directly there, only to form a line waiting at the runway was illustrated and the inefficiencies of this approach were highlighted. The concept of metering (i.e. spacing) departures so that they can taxi to the runway with minimal stops was then illustrated. Hold spots were identified on the overhead map and participants were introduced to the concept of holding aircraft at these spots until an appropriate release time. Participants were then told their overall goal for the experiment to maximize timely and efficient departures, while also handling arrival aircraft. At this time they were told that, based on these criteria, the top performer in each group would be receiving a $50 bonus. A selection of slides pertaining to this topic is shown below. 91
98 92
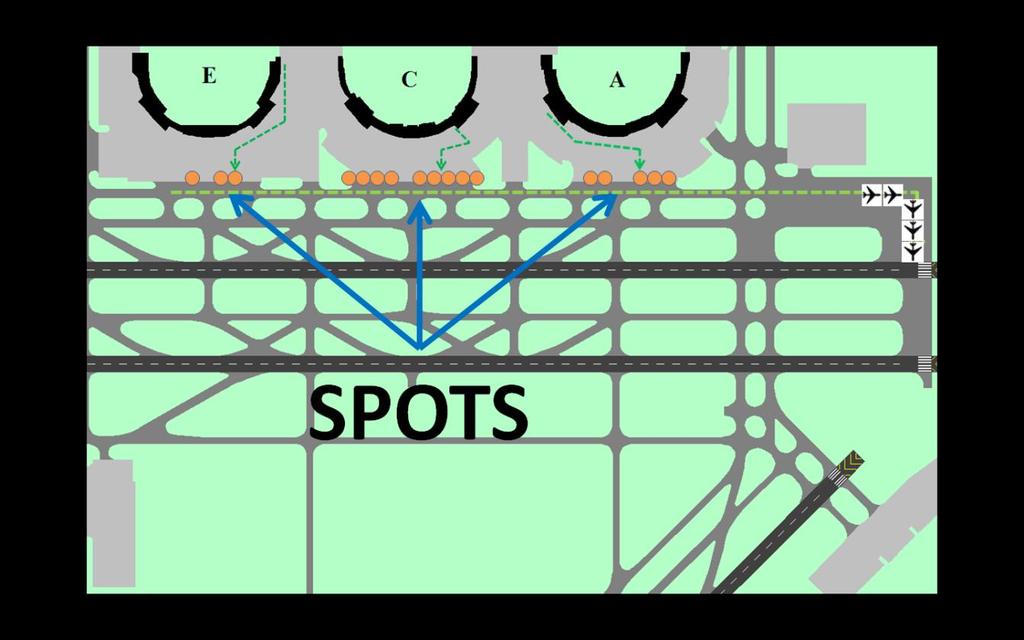
99 93
100 A.1.3 DFW surface ops. The layout of the runways was illustrated and the functions of each were described: runway 17R for departures, runways 17C and 17L for arrivals, and runway 13L not in use for this simulation. The traffic flow for both departures and arrivals, along with tower controller handoff points were illustrated. This information was given with reference to the sequence in which it would occur. For example, departures would pushback from the gate, taxi to a hold spot, switch to ground control, await release from the hold spot, taxi to the departure queue, switch to tower control, wait for appropriate runway spacing (if necessary), then depart. Arrivals would start with tower control on final approach, land, taxi towards the terminals, reach a handoff point, switch to ground control, await final taxi instructions, taxi to the ramp, terminate ground control, and park at a gate. A selection of slides pertaining to this topic is shown below. 94
101 95
102 96
103 A.1.4 Introduction to the prototype interface. At this point, the full interface was shown for the first time. The experimenter briefly highlighted each of the features on the screen to give the participant a general idea of what information was being presented to them. These features included the overhead map, flight strips, departure flight strip windows, arrival flight strip windows, the enlarged flight strip, and preset taxi route buttons. A selection of slides pertaining to this topic is shown below. 97
104 98
105 99
106 A.1.5 Electronic flight strips. The first interface feature discussed in detail was the electronic flight strips. The various data fields contained within each, along with their relevance, were explained. The various indication boxes were then explained and example progressions between indication boxes for both departures and arrivals were given. After briefly describing the enlarged flight strip, the function of flight strips in the context of the entire interface was explained. This included showing the link between overhead map icons and flight strips as well as the link between the selected aircraft s flight strip and the enlarged flight strip window. A selection of slides pertaining to this topic is shown below. 100
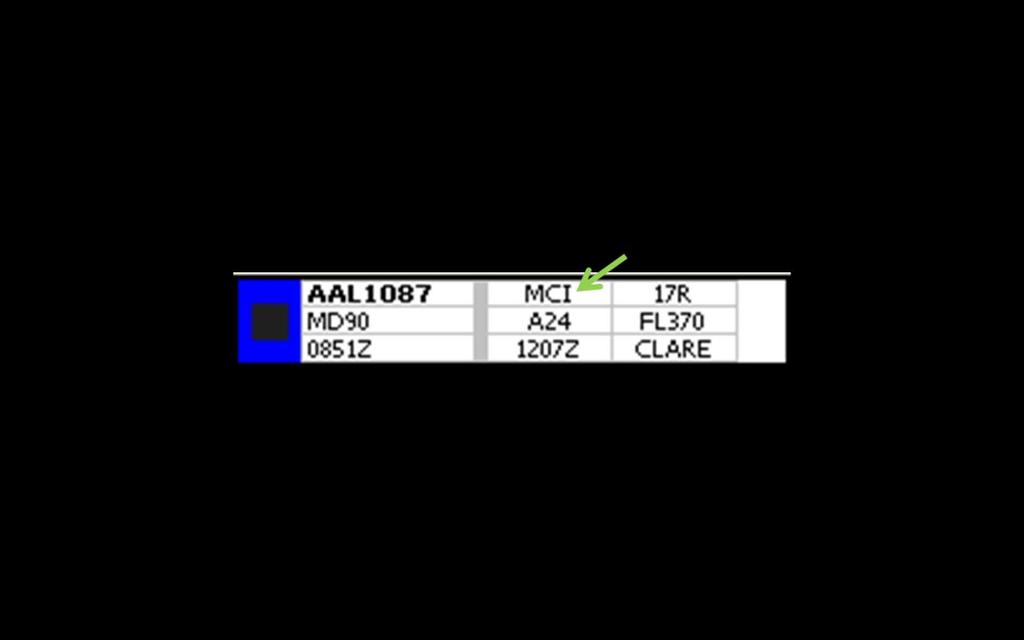
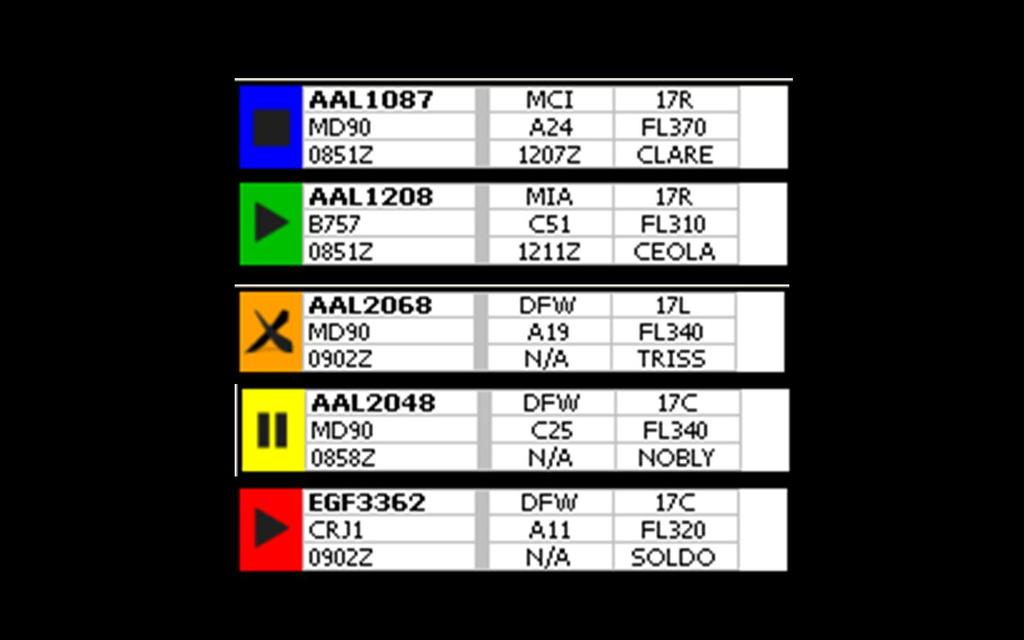
107 101
108 102
109 103
110 A.1.6 Overhead map. Discussion of the overhead map began with a relatively lengthy primer on the limitations of the map itself. These limitations included icons not being to exact scale, noise related to the location of the icons (e.g. random choppy movement and offset locations), as well as the potential for the two types of off-nominal events (transmission errors and false icons, see 6.5.1). While the potential for these off nominal events was described, it was not explicitly stated at what frequency they would occur or whether they would occur at all. During this discussion, the experimenter drew the participant s attention away from the screen and made eye contact to ensure that the participant understood exactly what was being said with regards to these limitations. Attention was then returned to the screen and the link between flight strips and overhead map icons was briefly revisited to highlight the colors of indication boxes and icons. The items associated with selecting an aircraft (e.g. highlighted icons and indicated taxi routes) were then explained. A selection of slides pertaining to this topic is shown below. 104
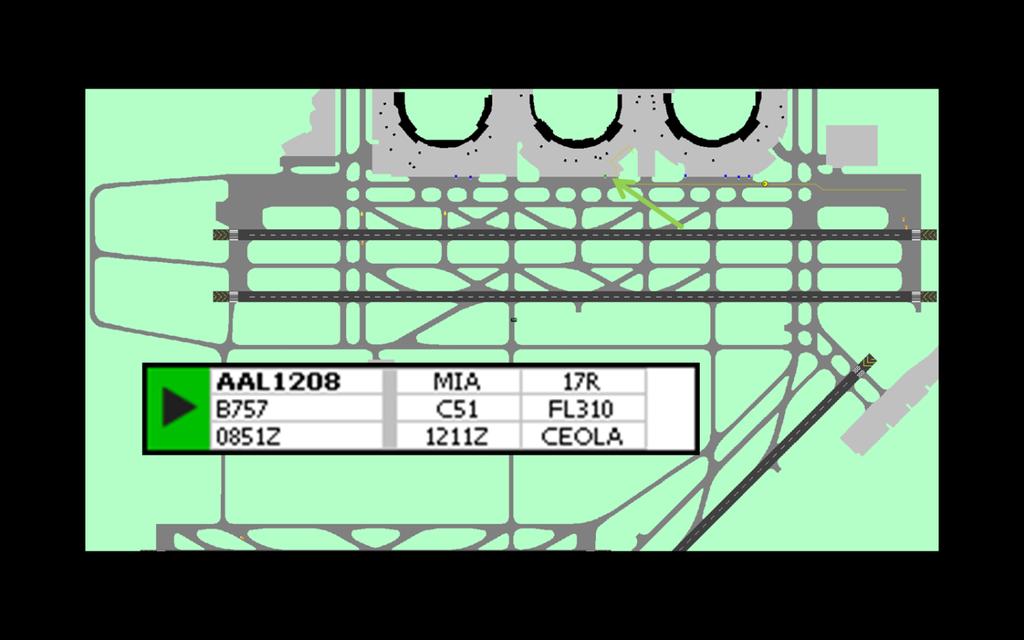
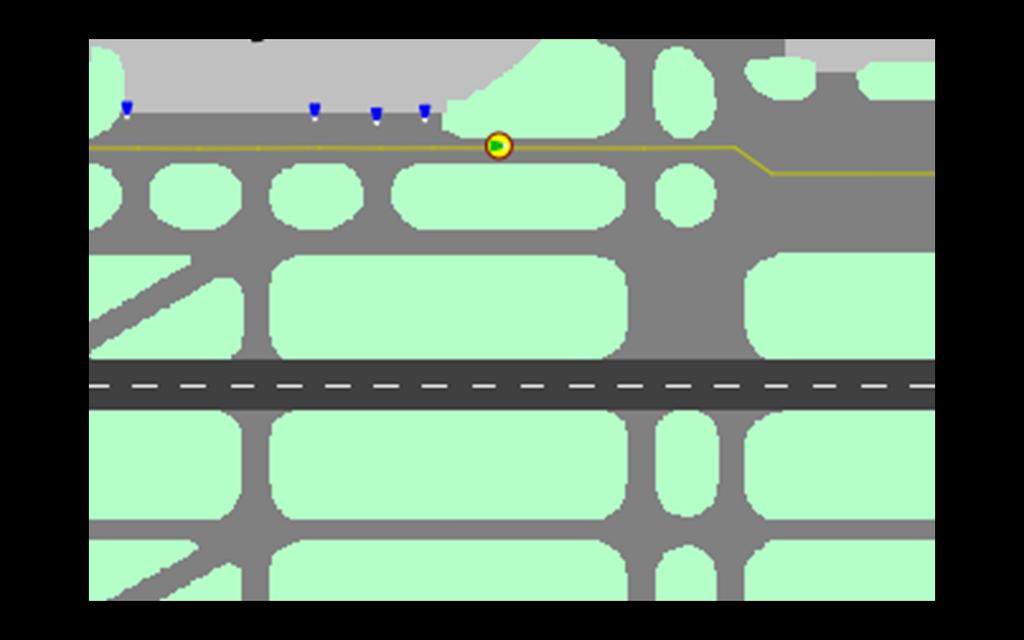
111 105

112 A.1.7 Flight strip organization windows. Departure flight strip windows were discussed with regards to how the progression of a flight strip through the organization windows mirrored the progression of the aircraft s phase of flight on the actual airport surface. A single aircraft was used as an example and taken through the entire progression from gate pushback to takeoff. This was followed up with a brief refresher on the meaning of the flight strip indication boxes related to departures. Arrival flight strip windows were also discussed with regards to how the progression of a flight strip through the organization windows mirrored the progression of the aircraft s phase of flight. Again, a single aircraft was used as an example and was taken through the entire progression from final approach to parking at the gate. This was 106
113 followed up with a brief refresher on the meaning of the flight strip indication boxes related to arrivals. A selection of slides pertaining to this topic is shown below. 107
114 108
115 A.1.8 Issuing taxi instructions. Interaction with the preset taxi route buttons was fairly simple and was therefore described briefly. For departures, only one route option was available taxiing from a hold spot to the departure queue. Participants were shown how selecting this route and clicking/pressing submit would submit the instructions to the aircraft. For arrivals, there were three taxi route options current location to Terminal A, current location to Terminal C, and current location to Terminal E. These three options were illustrated and an example aircraft was used to demonstrate how the instructions would be issued. Participants were then reminded where to look on the enlarged flight strip to determine an arrival aircraft s assigned terminal. A selection of slides pertaining to this topic is shown below. 109
116 110
117 A.1.9 Review of surface operation efficiency. Participants were reminded that their goal was to maximize timely and efficient departures and were given an explanation of how this goal would be achieved in practice. The 72 second spacing between takeoffs was then described and it was illustrated how the sequence of aircraft entering the departure queue could affect the participants performance. The concept of translating the 72 second takeoff spacing into a measure of distance was then illustrated. It was explained how the spatial arrangement of aircraft would consequently affect the chronological takeoff spacing. Participants were shown how this concept of sequencing aircraft spatially could be used to maintain an efficient departure sequence. Finally, it was explained that though arrival aircraft would be occupying the same taxiway, their positions did not affect the optimal spatial sequencing of departures. It 111
118 was mentioned, however, that their positioning could affect the participants ability to realize an optimal departure sequence because of separation concerns. A selection of slides pertaining to this topic is shown below. 112
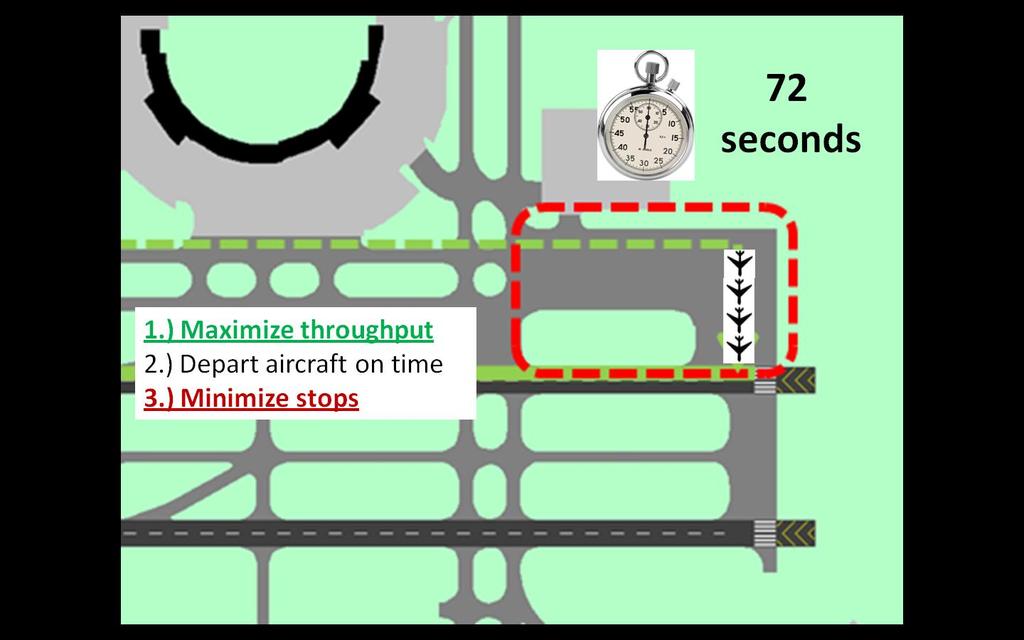
119 113
120 114
121 115
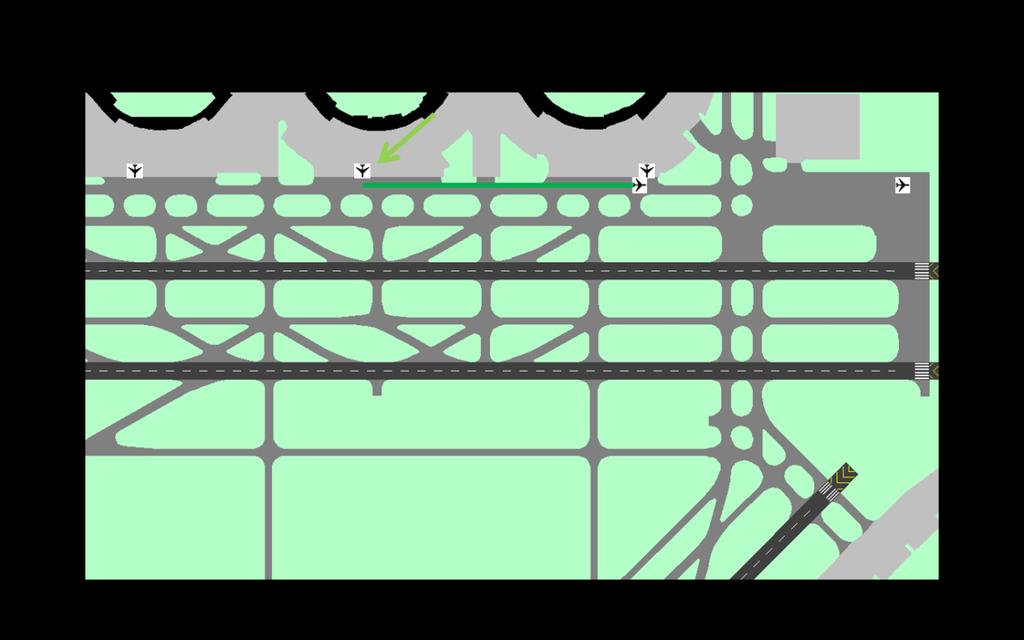
122 116
123 A.1.10 Sequencing the release of departure aircraft. See A.2, A.3, and A.4 for versions related to the Baseline, TCV, and Timeline conditions, respectively. A.1.11 Recap of participant goals and study objectives. The training presentation concluded with one more reminder of the experiment objectives, how performance would be measured, and how participants would be compensated. This included another mentioning of the $50 bonus for the top performer in each group to serve as extra motivation. A.2 Baseline Condition Departure Sequencing Since the Baseline condition did not feature a decision aid, the participants were completely responsible for sequencing departures and ensuring the proper spacing. To go along with the explanation of spatial separation as a function of time, participants were given an approximation of what a 72 second interval was in terms of distance. Coincidentally, the distance between two terminals was almost exactly equal to the meter distance, so participants were told use this as an approximation. A selection of slides pertaining to this topic is shown below. 117
124 118
125 A.3 TCV Condition Departure Sequencing At this point, participants in the TCV condition were first shown the TCV decision aid. The explanation of this decision aid was linked to the previous slides showing a spatial departure sequence as a function of time. Participants were told that the TCV decision aid indicated a 72 second departure spacing in terms of distance, provided feedback when spacing was too small or too large, and indicated the optimal position in the sequence for the next departure if maximum throughput was desired. In addition, tick marks indicated the optimal position for the next two departure aircraft in the sequence (if maximal throughput was desired), allowing participants to strategically issue instruction to arrival aircraft so as not to disrupt the departure sequence. A selection of slides pertaining to this topic is shown below. 119
126 120

127 A.4 Timeline Condition Departure Sequencing At this point, participants in the Timeline condition were first shown the Timeline decision aid. They were told that algorithms built into the program would determine the optimal departure sequence for the four aircraft with the earliest scheduled departure times. This sequence would be displayed on a timeline, which counted down to the release time for each aircraft. Participants were warned that the algorithms did not consider the positions of arrival aircraft on the taxiway and that blindly following the decision aid s recommendations could result in collisions. A selection of slides pertaining to this topic is shown below. 121
128 122
129 Mean Taxi Delay (s) Mean Taxi Delay (s) Appendix B: Individual Results B.1 Taxi Delay Mean Taxi Delay, Baseline Condition S1 S2 S3 S4 S5 S6 S Scenario Mean Taxi Delay, TCV Condition S7 S8 S9 S10 S11 S12 S Scenario 123
130 Mean Queue Stops Mean Taxi Delay (s) Mean Taxi Delay, Timeline Condition S13 S14 S15 S16 S17 S18 S Scenario B.2 Queue Stops Mean Queue Stops, Baseline Condition S1 S2 S3 S4 S5 S6 S Scenario 124
131 MEan Queue Stops MEan Queue Stops Mean Queue Stops, TCV Condition S7 S8 S9 S10 S11 S12 S Scenario Mean Queue Stops, Timeline Condition S13 S14 S15 S16 S17 S18 S Scenario 125
132 Mean Departure Time Deviation Mean Departure Time Deviation B.3 Departure Time Deviation 350 Mean Departure Time Deviation, Baseline Condition S1 S2 S3 S4 S5 S6 S Scenario Mean Departure Time Deviation, TCV Condition S7 S8 S9 S10 S11 S12 S Scenario 126
133 Mean Arrival RT ( s) Mean Departure Time Deviation Mean Departure Time Deviation, Timeline Condition S13 S14 S15 S16 S17 S18 S Scenario B.4 Arrival RT Mean Arrival RT, Baseline Condition S1 S2 S3 S4 S5 S6 S Scenario 127
134 Mean Arrival RT ( s) Mean Arrival RT ( s) Mean Arrival RT, TCV Condition S7 S8 S9 S10 S11 S12 S Scenario Mean Arrival RT, Timeline Condition S13 S14 S15 S16 S17 S18 S Scenario 128

135 Appendix C: Informed Consent Form 129
Support of Traffic Management Coordinators in an Airport Air Traffic Control Tower Using the Surface Management System
 From: HCI-02 Proceedings. Copyright 2002, AAAI (www.aaai.org). All rights reserved. Support of Traffic Management Coordinators in an Airport Air Traffic Control Tower Using the Surface Management System
Not all or nothing, not all the same: classifying automation in practice
 Not all or nothing, not all the same: classifying automation in practice by Dr Luca Save Different Levels of Automation Since the seminal work of Sheridan & Verplanck 39 it has become apparent that automation
Usability Evaluation of the Spot and Runway Departure Advisor (SARDA) Concept in a Dallas/Fort Worth Airport Tower Simulation
 Concept in a Dallas/Fort Worth Airport Tower Simulation") Usability Evaluation of the Spot and Runway Departure Advisor (SARDA) Concept in a Dallas/Fort Worth Airport Tower Simulation Miwa Hayashi, Ty Hoang, Yoon Jung NASA Ames Research Center Gautam Gupta, Waqar
Usability Evaluation of the Spot and Runway Departure Advisor (SARDA) Concept in a Dallas/Fort Worth Airport Tower Simulation Miwa Hayashi, Ty Hoang, Yoon Jung NASA Ames Research Center Gautam Gupta, Waqar
Controller and Pilot Evaluation of a Datalink-Enabled Trajectory-Based. Eric Mueller
 Controller and Pilot Evaluation of a Datalink-Enabled Trajectory-Based Operations Concept Eric Mueller 1 Outline Background Objectives Trajectory-Based Operations Concept Simulation Plan Results Conclusions
Human Factors Engineering HHP8102
 Human Factors Engineering HHP8102 Professor Mare Teichmann Copyright 2010 Mare Teichmann, Tallinn University of Technology, Institute of Industrial Psychology. All rights reserved The course: Human Factors
OPERATOR INTERACTION WITH MODEL-BASED PREDICTIVE CONTROLLERS IN PETROCHEMICAL REFINING
 OPERATOR INTERACTION WITH MODEL-BASED PREDICTIVE CONTROLLERS IN PETROCHEMICAL REFINING ABSTRACT Greg A. Jamieson Honeywell Technology Center Stephanie Guerlain University of Virginia In this paper, we
Potential Benefits of Operations
 Destination Green ICAO Symposium on Aviation and Climate Change, Destination Green, 14 16 May 2013 Potential Benefits of Operations John-Paul B. Clarke Associate Professor Daniel Guggenheim School of Aerospace
Some Trends in Next Generation Air Traffic Management
 Some Trends in Next Generation Air Traffic Management Ruy Brandao and Mike Jackson Presented by Pam Binns National Workshop on Research Directions for High Confidence Transportation CPS: Aerospace 19 November
Situation Awareness, Automation & Free Flight
 Situation Awareness, Automation & Free Flight Mica R. Endsley Department of Aeronautics & Astronautics Massachusetts Institute of Technology Cambridge, MA 02139 USA Keywords: Automation, Situation Awareness,
Transforming Risk Management
 Transforming Risk Management 1 Transforming Risk Management Understanding the Challenges of Safety Risk Measurement 2 Transforming Risk Management The challenge of safety risk measurement is threefold:
UTILIZING ECOLOGICAL PERCEPTION TO SUPPORT PRECISION LUNAR LANDING
 UTILIZING ECOLOGICAL PERCEPTION TO SUPPORT PRECISION LUNAR LANDING Cristin A. Smith and M.L. Cummings Massachusetts Institute of Technology Cambridge, MA Laura M. Forest and Lauren J. Kessler Charles Stark
Federal Aviation Administration The NextGen Vision of Future Safety
 The NextGen Vision of Future Safety Presented to: OPTICS Conference By: Maria Di Pasquantonio Date: December 17, 2014 Agenda Challenges for Aviation Safety Examples of NextGen Improvements / Programs NextGen
Coordinated Arrival Departure Management
 Coordinated Arrival Departure Management Dietmar Böhme, Ralph Brucherseifer, Lothar Christoffels German Aerospace Center (DLR) Institute of Flight Guidance Content Motivation & Objectives AMAN-DMAN Coordination:
The Search for Shared Situational Awareness for Enhanced Collaboration in Airport Systems
 The Search for Shared Situational Awareness for Enhanced Collaboration in Airport Systems Jeffrey Schäfer Amsterdam University of Applied Sciences, Weesperzijde 190, 1091 DZ Amsterdam A R T I C L E I N
Lessons Learned In Cognitive Systems Engineering AMY PRITCHETT GEORGIA TECH JULY 5, 2016
 Lessons Learned In Cognitive Systems Engineering AMY PRITCHETT GEORGIA TECH JULY 5, 2016 Cognitive Engineering Circa 1951 Fitts PM (ed) (1951) Human engineering for an effective air navigation and traffic
Separation Assurance in the Future Air Traffic System
 ENRI International Workshop on ATM/CNS. Tokyo, Japan. (EIWAC 2009). Separation Assurance in the Future Air Traffic System H. Erzberger Adjunct Professor of Electrical Engineering University of California,
FAA Office of. Environment and Energy Operations Research Projects. Federal Aviation Administration
 FAA Office of Environment and Energy Operations Research Projects Presented to: By: JPDO Environmental Working Group Operations Standing Committee 2009 Annual Workshop Lasantha Wedande Office of Environment
The 3 M s of ATM. Professor John-Paul Clarke Air Transportation Laboratory Georgia Institute of Technology
 The 3 M s of ATM Professor John-Paul Clarke Air Transportation Laboratory Georgia Institute of Technology Outline 2 What was the NextGendream? What is the NextGenreality? What were some of the issues?
Avoiding Knowledge Management Pitfalls. Ten Common Mistakes and How to Avoid Them
 Avoiding Knowledge Management Pitfalls Ten Common Mistakes and How to Avoid Them Table of Contents Introduction... 1 1. Failure to Set and Track Specific Goals... 1 2. Doing Too Much at Once... 2 3. Starting
SATCAS Standard Air Traffic Control Automation System
 SATCAS Standard Air Traffic Control Automation System SATCAS (Standard Air Traffic Control Automation System) is the latest generation of Selex ES ATC Systems, which integrates a wide range of products
NextGen ATM Concept of Operations: ASAS-Reliant
 NextGen ATM Concept of Operations: ASAS-Reliant See http://www.jpdo.gov for the latest JPDO info Doug Arbuckle, Rose Ashford NextGen Joint Planning & Development Office 18-Sep-2007 Joint 5th ASAS TN2 Workshop
A Conflict Probe to Provide Early Benefits for Airspace Users and Controllers
 A Conflict Probe to Provide Early Benefits for Airspace Users and Controllers Alvin L. McFarland Center for Advanced Aviation System Development, The MITRE Corporation, USA 08/97 The MITRE Corporation
Designing for. Situation Awareness. Second Edition. Mica R. Endsley and Debra G. Jones. An Approach to User-Centered Design.
 Designing for Situation Awareness An Approach to User-Centered Design Second Edition Mica R. Endsley and Debra G. Jones CRC Press Taylor & Francis Group Boca Raton London New York CRC Press is an imprint
Using Complexity Science in Analyzing Safety/Capacity of ATM Designs
 Using Complexity Science in Analyzing Safety/Capacity of ATM Designs Henk Blom ICRAT 2014, May 26-29, Istanbul Using Complexity Science in Analyzing Safety/Capacity of ATM Designs Motivation and background
Airspace System Efficiencies Enabled by PNT
 Airspace System Efficiencies Enabled by PNT John-Paul Clarke Associate Professor, Aerospace Engineering and Industrial and Systems Engineering Director, Air Transporta;on Laboratory Georgia Ins;tute of
AN INTRODUCTION TO USING PROSIM FOR BUSINESS PROCESS SIMULATION AND ANALYSIS. Perakath C. Benjamin Dursun Delen Madhav Erraguntla
 Proceedings of the 1998 Winter Simulation Conference D.J. Medeiros, E.F. Watson, J.S. Carson and M.S. Manivannan, eds. AN INTRODUCTION TO USING PROSIM FOR BUSINESS PROCESS SIMULATION AND ANALYSIS Perakath
JPDO Paper. Guidance on the Evolution of NextGen from the Perspective of Airline and Flight Operations Centers. Paper No.: 2010: 016 July 28, 2010
 Guidance on the Evolution of NextGen from the Perspective of Airline and Flight Operations Centers Paper No.: 2010: 016 July 28, 2010 Prepared by: Air Navigation Systems (ANS) Working Group AOC/FOC Subcommittee
USE OF DISCRETE EVENT SIMULATION TO MODEL HUMAN PERFORMANCE
 USE OF DISCRETE EVENT SIMULATION TO MODEL HUMAN PERFORMANCE Authors: Dan Schunk and Beth Plott Year: 2004 Alion MA&D Operation, microsaintsharp@alionscience.com, 303-442-6947 USE OF DISCRETE EVENT SIMULATION
Delri Muller, Karen B. Marais, Payuna Uday (Purdue) R. John Hansman, Tom G. Reynolds, Jonathan Lovegren (MIT)
 R. John Hansman, Tom G. Reynolds, Jonathan Lovegren (MIT)") An FAA/NASA/TC-sponsored Center of Excellence Delri Muller, Karen B. Marais, Payuna Uday (Purdue) R. John Hansman, Tom G. Reynolds, Jonathan Lovegren (MIT) AAE Systems Day August 28, 2010 Motivation Demand
An FAA/NASA/TC-sponsored Center of Excellence Delri Muller, Karen B. Marais, Payuna Uday (Purdue) R. John Hansman, Tom G. Reynolds, Jonathan Lovegren (MIT) AAE Systems Day August 28, 2010 Motivation Demand
The AIRPORT CDM. Bahrain October 2015
 The AIRPORT CDM Bahrain 11-13 October 2015 Airport CDM a definition Airport CDM is a proven concept which aims at improving predictability, reducing delays, optimally utilizing the available capacities
Modelling of potential hazards in agent-based safety risk analysis
 MAREA: Mathematical Approach towards Resilience Engineering in ATM Vrije Universiteit Amsterdam Modelling of potential hazards in agent-based safety risk analysis Henk Blom Sybert Stroeve Tibor Bosse NLR
Human Supervisory Control. Human-Centered Systems Engineering Design Approaches
 16.422 Human Supervisory Control Human-Centered Systems Engineering Design Approaches Traditional Systems Engineering Process Model* 16.422 ACQUISITION PHASE UTILIZATION PHASE N Conceptual- E Preliminary
Situation awareness implications of adaptive automation for information processing in an air traffic control-related task
 ARTICLE IN PRESS International Journal of Industrial Ergonomics 36 (2006) 447 462 www.elsevier.com/locate/ergon Situation awareness implications of adaptive automation for information processing in an
A System Concept for Facilitating User Preferences in En Route Airspace
 NASA Technical Memorandum 4763 A System Concept for Facilitating User Preferences in En Route Airspace R. A. Vivona, M. G. Ballin, S. M. Green, R. E. Bach, and B. D. McNally November 1996 National Aeronautics
HUMAN PERFORMANCE MODELING FOR DISCRETE-EVENT SIMULATION: WORKLOAD. John Keller
 Proceedings of the 2002 Winter Simulation Conference E. Yücesan, C.-H. Chen, J. L. Snowdon, and J. M. Charnes, eds. HUMAN PERFORMANCE MODELING FOR DISCRETE-EVENT SIMULATION: WORKLOAD John Keller Micro
Innovation in ATFM: the rise of Artificial Intelligence
 Innovation in ATFM: the rise of Artificial Intelligence Trevor Kistan www.thalesgroup.com.au Today: Big Data, Machine Learning & Predictive Analytics - 1/2 2 Thales CeNTAI Big Data & Analytics Laboratory
Using System Theoretic Process Analysis (STPA) for a Safety Trade Study
 for a Safety Trade Study") Using System Theoretic Process Analysis (STPA) for a Safety Trade Study David Horney MIT/U.S. Air Force Distribution Statement A: Approved for public release; distribution unlimited Safety-Guided Design
Using System Theoretic Process Analysis (STPA) for a Safety Trade Study David Horney MIT/U.S. Air Force Distribution Statement A: Approved for public release; distribution unlimited Safety-Guided Design
Future Enhancements to the U.S. Federal Aviation
 Future Enhancements to the U.S. s (FAA) En Route Automation Modernization (ERAM) Program and the Next Generation Air Transportation (NextGen) System Presented at Reliable Software Technologies Ada-Europe
An Analysis Mechanism for Automation in Terminal Area
 NASA/CR-2001-211235 ICASE Report No. 2001-32 An Analysis Mechanism for Automation in Terminal Area Stavan M. Parikh University of Virginia, Charlottesville, Virginia ICASE NASA Langley Research Center
Simulation Analytics
 Simulation Analytics Powerful Techniques for Generating Additional Insights Mark Peco, CBIP mark.peco@gmail.com Objectives Basic capabilities of computer simulation Categories of simulation techniques
Autoflight Mode Awareness Issues: An Overview
 Autoflight Awareness Issues: An Overview Beth Lyall Presented to the FAA Seattle, July 14-16, 1998 Definitions error awareness Outline Types of modes and mode transitions -related issues Summary for workshop
Analysis of Multi-Sector Planner Concepts in U.S. Airspace
 Analysis of Multi-Sector Planner Concepts in U.S. Airspace Kevin Corker, Paul Lee, Tom Prevot, Eromi Guneratne, Lynne Martin, Nancy Smith, Savvy Verma, Jeffrey Homola, and Joey Mercer San Jose State University
First European Air traffic controller Selection Test (FEAST) package. Information to Candidates applying as Student Air Traffic Controllers
 package. Information to Candidates applying as Student Air Traffic Controllers") Information on the First European Air traffic controller Selection Test (FEAST) package Information to Candidates applying as Student Air Traffic Controllers Introduction You have applied for a position
Information on the First European Air traffic controller Selection Test (FEAST) package Information to Candidates applying as Student Air Traffic Controllers Introduction You have applied for a position
NAS-Wide Performance: Impact of Select Uncertainty Factors and Implications for Experimental Design
 Approved for Public Release: 12-0370. Distribution Unlimited. NAS-Wide Performance: Impact of Select Uncertainty Factors and Implications for Experimental Design Gareth O. Coville, MITRE Corporation Billy
Project 016 Airport Surface Movement Optimization
 Project 016 Airport Surface Movement Optimization Massachusetts Institute of Technology Massachusetts Institute of Technology Lincoln Laboratory Project Lead Investigator Hamsa Balakrishnan Associate Professor
Prioritising safety in unmanned aircraft system traffic management
 White paper: drones Prioritising safety in unmanned aircraft system traffic Drones are proliferating throughout the world s airspace, making them impossible to ignore. As their numbers rise, the importance
Human Factors Contribution to Safety Problem Resolution From Classification to Effective Intervention
 Human Factors Contribution to Safety Problem Resolution From Classification to Effective Intervention Dino Piccione 1 and Michael Sawyer 2 1 Federal Aviation Administration, Washington, DC, USA, 2 Northrop
A Systematic Approach to Performance Evaluation
 A Systematic Approach to Performance evaluation is the process of determining how well an existing or future computer system meets a set of alternative performance objectives. Arbitrarily selecting performance
Guidance for Modeling Noise for Non-Standard Aircraft Profiles
 ACRP Problem Statement No. 14-02-34 Recommended Allocation: $300,000 Guidance for Modeling Noise for Non-Standard Aircraft Profiles ACRP Staff Comments: Several ACRP studies are focused on enhancing the
Proceedings of ACME'93, Adelaide,November 1993, pp
 Proceedings of ACME'93, Adelaide,November 1993, pp. 203-207 Hybrid Human-Computer Production Scheduling Peter G. Higgins CIM Centre and School of Mechanical and Manufacturing Engineering, Swinburne University
International Civil Aviation Organization. Airport Collaborative Decision Making (A CDM) Saulo Da Silva
 Saulo Da Silva") International Civil Aviation Organization ASBU/SIP/Lima/2012-WP/15 Airport Collaborative Decision Making (A CDM) Saulo Da Silva Workshop on preparations for ANConf/12 ASBU methodology (Lima, 16-20 April
International Civil Aviation Organization ASBU/SIP/Lima/2012-WP/15 Airport Collaborative Decision Making (A CDM) Saulo Da Silva Workshop on preparations for ANConf/12 ASBU methodology (Lima, 16-20 April
A SYSTEM APPROACH Is the Solution. Steve Vail
 A SYSTEM APPROACH Is the Solution Steve Vail sjvail@fedex.com 2 EVERYONES! JFK May 4, 2009 WHOSE FAULT IS THIS? Today s State Non-Centric Ops EWR COA Ramp Tower Port Ramp Tower 3 separate functions controlling
The Cognitive Costs and Benefits of Automation
 Dr Richard Breton DRDC-RDDC Valcartier 2459 Pie-XI Blvd North Val-Bélair, Québec G3J 1X5 CANADA Tel.: 418-844-4000 (ext.:4753) Fax: 418-844-4538 Richard.Breton@drdc-rddc.gc.ca Dr Éloi Bossé DRDC-RDDC Valcartier
Stevens Institute of Technology & Systems Engineering Research Center (SERC)
") Stevens Institute of Technology & Systems Engineering Research Center (SERC) Modeling an Acquisition Decision-Making Process for the FAA NextGen Systems of Systems Presented to: NDIA 2012 By: Dr. Mark
Stevens Institute of Technology & Systems Engineering Research Center (SERC) Modeling an Acquisition Decision-Making Process for the FAA NextGen Systems of Systems Presented to: NDIA 2012 By: Dr. Mark
Research Progress on an Automation Concept for Surface Operation with Time-Based Trajectories
 Research Progress on an Automation Concept for Surface Operation with Time-Based Trajectories Victor H. L. Cheng, Optimal Synthesis Inc., Palo Alto, California Abstract To address anticipated growth in
Collaborative Decision Making (CDM) Update
 Update") Collaborative Decision Making (CDM) Update 1 FAA CDM Office CDM Domestic combined with International Operations, includes International Data Sharing One Manager Two Full Time Team Leads, Two Part-Time
Collaborative Decision Making (CDM) Update 1 FAA CDM Office CDM Domestic combined with International Operations, includes International Data Sharing One Manager Two Full Time Team Leads, Two Part-Time
White Paper. Demand Shaping. Achieving and Maintaining Optimal Supply-and-Demand Alignment
 White Paper Demand Shaping Achieving and Maintaining Optimal Supply-and-Demand Alignment Contents Introduction... 1 Sense-Interpret-Respond Architecture... 2 Sales and Operations Planning... 3 Scenario
Situation Awareness for the Power Transmission & Distribution Industry
 Situation Awareness for the Power Transmission & Distribution Industry Erik S. Connors, Ph.D. SA Technologies, Inc. Presented to EPRI's XIII Annual Power Switching Safety and Reliability Conference and
Enter a world of optimized resource planning
 Enter a world of optimized resource planning Where airport services maximize safety, quality and passenger comfort AIRPORT RESOURCE PLANNING The aviation industry is very dynamic and competitive. Customer
Collaborative Decision Making in Aviation
 the way we do it Collaborative Decision Making in Aviation In an uncertain world there is reasonable certainty in stating that air travel will increase in the future. How airlines and airports will work
LAX Community Noise Roundtable. NextGen Briefing
 LAX Community Noise Roundtable NextGen Briefing Agenda What is NextGen? What are key capabilities of NextGen? What is JPDO? How is NextGen/JPDO addressing environmental issues? What are NextGen implications
Enhancing the role of Human Factors in Safety Investigation and Analysis
 Enhancing the role of Human Factors in Safety Investigation and Analysis Katie Berry Ph.D. Michael Sawyer Ph.D. March 14-18, 2016 Human Performance and Operations Procedures & Policies Human Performance
TRANSPORTATION ASSET MANAGEMENT GAP ANALYSIS TOOL
 Project No. 08-90 COPY NO. 1 TRANSPORTATION ASSET MANAGEMENT GAP ANALYSIS TOOL USER S GUIDE Prepared For: National Cooperative Highway Research Program Transportation Research Board of The National Academies
EXPLORING THE POSSIBILITIES OF CONJOINT MEASUREMENT AS A DECISION-MAKING TOOL FOR VIRTUAL WAYFINDING ENVIRONMENTS
 EXPLORING THE POSSIBILITIES OF CONJOINT MEASUREMENT AS A DECISION-MAKING TOOL FOR VIRTUAL WAYFINDING ENVIRONMENTS Eindhoven University of Technology, Faculty of Architecture, Building and Planning P.O.
Service management solutions White paper. Six steps toward assuring service availability and performance.
 Service management solutions White paper Six steps toward assuring service availability and performance. March 2008 2 Contents 2 Overview 2 Challenges in assuring high service availability and performance
Outbound Punctuality Sequencing by Collaborative Departure Planning
 Outbound Punctuality Sequencing by Collaborative Departure Planning MSc. Ing. Eugène Tuinstra R&D Engineer Validation & Concepts ATM & Airports Department 6 th USA / Europe ATM 2005 R&D Seminar Eurocontrol
Safety Related Considerations in Autonomy
 Safety Related Considerations in Autonomy Dr. Guillaume Brat Intelligent Systems Division NASA Ames Research Center NASA ARMD Airspace Operations and Safety Program Presented at the OPTICS Workshop: FROM
Risk analysis of serious air traffic incident based on STAMP HFACS and fuzzy sets
 Risk analysis of serious air traffic incident based on STAMP HFACS and fuzzy sets Michał LOWER, Jan MAGOTT Wroclaw University of Technology Jacek SKORUPSKI Warsaw University of Technology Plan 1. The goal
GUIDANCE ON CHOOSING INDICATORS OF OUTCOMES
 1 GUIDANCE ON CHOOSING INDICATORS OF OUTCOMES 1. The Basics 1.1 What is the relationship between an outcome and an outcome indicator? 1.2 How are outcome indicators different from other types of indicators?
Parking Control System for Automated Gate Management
 Leading you safely to the gate Parking Control System for Automated Gate Management Honeywell Airports Business Increases in passenger traffic require higher gate efficiency and optimized throughput -
ICAO FUEL SAVINGS ESTIMATION TOOL (IFSET) USER S GUIDE
 USER S GUIDE") 2011 ICAO FUEL SAVINGS ESTIMATION TOOL (IFSET) USER S GUIDE 12/12/2011 TABLE OF CONTENTS Page 1 Introduction 3 2 Objective 3 3 Description 3 4 Assumptions 4 5 Methodology 4 6 Requirements 6 7 Step-by-step
2011 ICAO FUEL SAVINGS ESTIMATION TOOL (IFSET) USER S GUIDE 12/12/2011 TABLE OF CONTENTS Page 1 Introduction 3 2 Objective 3 3 Description 3 4 Assumptions 4 5 Methodology 4 6 Requirements 6 7 Step-by-step
Intelligent Assistant Systems: Support for Integrated Human-Machine Systems
 Knowledge Systems Laboratory February 1990 Technical Report KSL 90-61 Intelligent Assistant Systems: Support for Integrated Human-Machine Systems by Guy Boy and Thomas R. Gruber Appeared in the proceedings
Artificial Intelligence in Workforce Management Systems
 Artificial Intelligence in Workforce Management Systems 1 Artificial intelligence (AI) was formally founded as an academic discipline at a conference in 1956, long before workforce management (WFM) systems
INVESTIGATION ON CORRELATION BETWEEN MENTAL WORKLOAD AND SITUATION AWARENESS OF PILOTS BY SIMULATION EXPERIMENT
 INVESTIGATION ON CORRELATION BETWEEN MENTAL WORKLOAD AND SITUATION AWARENESS OF PILOTS BY SIMULATION EXPERIMENT Shun-Ting Kuan 1, Wen-Jiang Chang 1, *Min-yang Wang 1, Wen-Ling Tsai 2, Wei Hsu 2, Jin-Ru
Episode 3 D FTS on 4D trajectory management and complexity reduction - Experimental Plan EPISODE 3
 EPISODE 3 Single European Sky Implementation support through Validation Document information Programme Sixth framework programme Priority 1.4 Aeronautics and Space Project title Episode 3 Project N 037106
Federal Aviation Administration FPAW Weather Integration Into NextGen
 FPAW Weather Integration Into NextGen Date: October 12, 2011 Presented By: Shirley Burgess Chief System Engineer En Route and Oceanic Services PMO Update ATO Program Management Organization (PMO) Congressional
Ways and Ideas to train Aviation Professionals for Today and Tomorrow
 Ways and Ideas to train Aviation Professionals for Today and Tomorrow Farid ZIZI Montreal, 1-4 March 2010 How to assume That Initial training and Education prepare for a complete and perhaps long career
PREDICTING AIR TRAFFIC CONTROL STUDENT SUCCESS AND IMPROVING PLACEMENT THROUGH SKILL APTITUDE TESTING
 PREDICTING AIR TRAFFIC CONTROL STUDENT SUCCESS AND IMPROVING PLACEMENT THROUGH SKILL APTITUDE TESTING Kerry Hutson The MITRE Corporation McLean, VA Keith Baldwin The MITRE Corporation McLean, VA Susan
Visualizing Uncertainty in High Time-Stress. Christopher D. Wickens Head, Human Factors Division University of Illinois, Institute of Aviation
 Visualizing Uncertainty in High Time-Stress Christopher D. Wickens Head, Human Factors Division University of Illinois, Institute of Aviation Terms Model of Influences Challenge and Results of Empirical
Best Practices for Managing PeopleSoft Help Requests and Effective Incident Resolution
 Best Practices for Managing PeopleSoft Help Requests and Effective Incident Resolution TABLE OF CONTENTS Introduction: Bedding a System In... 2 This Guide... 2 Part One: Response Policies and Procedures...
A COMPARISON OF TWO TAKEOFF AND CLIMB OUT FLAP RETRACTION STANDARD OPERATING PROCEDURES
 A COMPARISON OF TWO TAKEOFF AND CLIMB OUT FLAP RETRACTION STANDARD OPERATING PROCEDURES Houda Kerkoub Kourdali, Lance Sherry, Center for Air Transportation Systems Research (CATSR) at George Mason University
Keeping the airfield. operational and safe
 Keeping the airfield operational and safe Airport performance delivered from approach to departure GATE TOWER AIRFIELD SERVICE Are you prepared? Is your airport able to deal with the rapid increase of
Autonomy Requirements for Smart Vehicles
 Autonomy Requirements for Smart Vehicles Emil Vassev April 24, 2017 09/08/2017 Lero 2015 1 Outline Autonomy Autonomous Vehicles and Safety Autonomy Requirements Engineering (ARE) KnowLang The ARE Formal
SESAR: a European initiative for an enhanced ATM system
 domaine Recherche & SESAR: a European initiative for an enhanced ATM system General overview and spotlight on the SESAR operational concept Patrick DUJARDIN R&D Manager DSNA/DTI Toulouse - France Tokyo,
Flight Data Management : includes tasks of loading, preparing and discarding flight progress strips, etc., and also includes computer updates.
 1 ATC TASKS The specification and definition of tasks in the RAMS simulator is inherent to the tool s simulation event philosophy. The RAMS simulator is, in fact, an ATC event generator that reports its
CORPORATE CAPABILITIES
 Shaping the Future Through Technology CORPORATE CAPABILITIES Information Technology Systems Engineering Software Development Human Factors Test & Evaluation Project Management www.sst-it.com Corporate
Strategic Planning in Air Traffic Control as a Multi-Objective Stochastic Optimization Problem
 www.thalesgroup.com Strategic Planning in Air Traffic Control as a Multi-Objective Stochastic Optimization Problem Tenth USA/Europe Seminar on ATM R&D Chicago, IL, USA Gaétan Marceau Caron Marc Schoenauer
SMART AUTOMATION: ALLOWING THE MODERN ENTERPRISE TO SURVIVE AND THRIVE
 /automation SMART AUTOMATION: ALLOWING THE MODERN ENTERPRISE TO SURVIVE AND THRIVE EOIN WOODS CTO ENDAVA CONTENTS 1 INTRODUCTION 04 2 WHY SMART AUTOMATION? 05 3 AUTOMATION THE UNFULFILLED PROMISE 07 4
Is Artificial Intelligence on your Board/Audit Committee s Agenda? Hossam El Shaffei, RSM Egypt
 Is Artificial Intelligence on your Board/Audit Committee s Agenda? Hossam El Shaffei, RSM Egypt Is Artificial Intelligence on your Board/Audit Committee s Agenda? The difficult thing about Artificial Intelligence
A Systems Approach for Selection Between Manual and Automated Work Zones Within Assembly Lines
 Clemson University TigerPrints All Theses Theses 8-2015 A Systems Approach for Selection Between Manual and Automated Work Zones Within Assembly Lines Jayavardhan Dhulia Clemson University Follow this
University of Groningen. Effective monitoring and control with intelligent products Meyer, Gerben Gerald
 University of Groningen Effective monitoring and control with intelligent products Meyer, Gerben Gerald IMPORTANT NOTE: You are advised to consult the publisher's version (publisher's PDF) if you wish
Near Term Operational Changes FAA PARTNER Project 32
 Partnership for AiR Transportation Noise and Emission Reduction An FAA/NASA/TC-sponsored Center of Excellence Near Term Operational Changes FAA PARTNER Project 32 Steve Urlass, project manager Presentation
Transportation Optimization: Is This the Next Step?
 Transportation Optimization: Is This the Next Step? By Irista, An HK Systems Company Cost reduction through effective transportation management remains a high priority for most organizations. The challenges
EXAMINATION OF AUDIT PLANNING RISK ASSESSMENTS USING VERBAL PROTOCOL ANALYSIS
 EXAMINATION OF AUDIT PLANNING RISK ASSESSMENTS USING VERBAL PROTOCOL ANALYSIS What is Verbal Protocol Analysis (VPA)? VPA involves capturing an individuals' spoken thoughts while working on a task (i.e.,
Book Outline. Software Testing and Analysis: Process, Principles, and Techniques
 Book Outline Software Testing and Analysis: Process, Principles, and Techniques Mauro PezzèandMichalYoung Working Outline as of March 2000 Software test and analysis are essential techniques for producing
W911NF Project - Mid-term Report
 W911NF-08-1-0041 Project - Mid-term Report Agent Technology Center, Czech Technical University in Prague Michal Pechoucek 1 Accomplishments for the First 6 Months 1.1 Scenario and Demos During the first
Transform the Customer Experience with CONNECTED FIELD SERVICE
 Transform the Customer Experience with CONNECTED FIELD SERVICE 1 2 3 4 5 Contents What is Field Service Management? p. 3 Field Service Management Presents Unique Challenges to Connectivity p. 6 Best Practices
Visual Guidance. Research and Development. By: Holly Cyrus, Project Manager Date: August 23, Federal Aviation Administration
 Visual Guidance Research and Development By: Holly Cyrus, Project Manager Date: August 23, 2010 Signs Markings Lighting Ground Surveillance Mission Improve Visual Aids on Airports to reduce runway Incursions
Discrete Event Simulation: A comparative study using Empirical Modelling as a new approach.
 Discrete Event Simulation: A comparative study using Empirical Modelling as a new approach. 0301941 Abstract This study introduces Empirical Modelling as a new approach to create Discrete Event Simulations
Introduction to software testing and quality process
 Introduction to software testing and quality process Automated testing and verification J.P. Galeotti - Alessandra Gorla Engineering processes Engineering disciplines pair construction activities activities