A COMPARISON OF CPM-BAR CHART AND A HIERARCHICAL GRAPHICAL APPROACH TO PLANNING CONSTRUCTION PROCESSES
|
|
|
- Geoffrey Richards
- 6 years ago
- Views:
Transcription
1 A COMPARISON OF CPM-BAR CHART AND A HIERARCHICAL GRAPHICAL APPROACH TO PLANNING CONSTRUCTION PROCESSES By COURTNEY K. ZURICH A THESIS PRESENTED TO THE GRADUATE SCHOOL OF THE UNIVERSITY OF FLORIDA IN PARTIAL FULFILLMENT OF THE REQUIREMENTS FOR THE DEGREE OF MASTER OF SCIENCE IN BUILDING CONSTRUCTION UNIVERSITY OF FLORIDA
2 2010 Courtney K. Zurich 2
3 To my parents, Paul and Ruth, who supported me throughout my education 3
4 ACKNOWLEDGMENTS I would first like to thank my parents, who have supported me in my choice to attend the University of Florida both for my undergraduate studies as well as my graduate studies. Without their continued support and encouragement, I would not have been able to complete my education. I would also like to thank Dr. Flood, Dr. Issa, and Dr. Smailes for serving on my committee and being patient with my need to complete the majority of my research from across the country, and your willingness and enthusiasm to helping me achieve this goal. Thank you for teaching me principles of construction, the fundamentals of the industry, and the many other invaluable lessons I never anticipated I would need to know when obtaining my first job as a young professional out of school. Lastly I would like to thank my classmates, who also served as colleagues and moral support throughout my education. You brought out the best in me, and helped me achieve things I never thought were possible for me. Thank you for being there with me along this journey. 4
5 TABLE OF CONTENTS page ACKNOWLEDGMENTS... 4 LIST OF FIGURES... 7 LIST OF ABBREVIATIONS... 8 ABSTRACT... 9 CHAPTER 1 INTRODUCTION Motivation for Research Research Objectives Literature Review Critical Path Method Basis Benefits Drawbacks Bar charts Linear Scheduling Method Background Three steps to developing a linear schedule Benefits and drawbacks to LSM HIERARCHICAL CONSTRAINT-BASED GRAPHICAL APPROACH TO MODELING (HCM) CONSTRUCTION PROCESSES Primary Elements of the Proposed New Modeling Approach Resource Space Work Units Constraints and Objectives Additional Notes Applicable to HCM METHODOLOGY CASE STUDY #1: MID-RISE BUILDING STRUCTURAL CONCRETE Introduction Mid-Rise Building Bar Chart CPM Format Hierarchical Constraint-Based Approach Format Resolutions Regarding HCM with Case Study # CASE STUDY #2: THEMED ROCKWORK INSTALLATION Introduction Themed Rockwork Installation Bar Chart CPM Format Hierarchical Constraint-Based Approach Format
6 Resolutions Regarding HCM with Case Study # CONCLUSIONS AND SUGGESTIONS FOR FUTURE REASEARCH APPENDIX A MID-RISE BUILDING BAR CHART SCHEDULE B THEMED ROCKWORK INSTALLATION BAR CHART SCHEDULE LIST OF REFERENCES BIOGRAPHICAL SKETCH
7 LIST OF FIGURES Figure page 4-1 Levels 7-9 structural concrete activities expressed in HCM format The mid-rise building structural concrete in HCM form, modified to reflect pour as the constraining activity Visual of rockwork construction and installation activities presented in HCM format. Note that the figure is not to scale The HCM approach to rockwork installation, switching positions of Sub Zone 2 and Sub Zone 3 and eliminating idle time. Note that the figure is not to scale
8 LIST OF ABBREVIATIONS CPM HCM LSM Critical Path Method. Hierarchical Constraint-Based Approach to Modeling. This is the newly developed model that is being proposed in the paper and thus has not yet been identified by this acronym in other scholarly publications. Linear Scheduling Method. Also referred to as linear scheduling throughout the thesis. 8
9 Abstract of Thesis Presented to the Graduate School of the University of Florida in Partial Fulfillment of the Requirements for the Degree of Master of Science in Building Construction A COMPARISON OF CPM-BAR CHART AND A HIERARCHICAL GRAPHICAL APPROACH TO PLANNING CONSTRUCTION PROCESSES Chair: Ian Flood Cochair: R. Raymond Issa Major: Building Construction By Courtney K. Zurich December 2010 Construction planning is one of the most important factors to project management and project controls in construction. A construction project cannot begin without first developing a plan that outlines the sequence of events to occur to complete the project by a particular date. This plan must be well thought-out and based on experience and/or historical information in order to accurately depict a project s duration and process before it begins. Despite the importance of planning and scheduling, effective and diverse methods to planning and scheduling are limited. Currently most construction scheduling is done utilizing bar charts through heuristic scheduling software that also implements Critical Path Method techniques, but this is not always the most effective means of presenting information and can get incredibly complicated based on the type of work being performed and the number of activities and level of detail required. Further research in modeling construction processes would benefit the industry by providing additional means of evaluating and communicating the construction plan and schedule. 9
10 This research proposes a new, hierarchical constraint-based approach to modeling (HCM) that has been under development by Dr. Ian Flood at the University of Florida s Rinker School of Building Construction in the last couple years. It is, in effect, a hybrid of CPM techniques and linear scheduling with further advancement that allows more flexibility that is not available with CPM or linear scheduling. While HCM is a new method in early development stages, this research provides preliminary insight to how to set up a hierarchical constraint-based model, potential benefits, and suggestions for future research. 10
11 CHAPTER 1 INTRODUCTION Motivation for Research Construction planning and scheduling is a required component to every construction project. Before a project can be built, a plan or schedule must be developed and therefore continuous research on improved methods of planning benefit the entire industry. Construction planning is also a very time consuming process. Rarely does a construction project ever go exactly according to plan, and in order to maintain accurate reports the schedule must be updated frequently. Changes and delays are inherent in construction and the schedule requires frequent scrutiny and analysis to adapt to these changes, particularly when there is an immovable or strict deadline for project completion. As construction planning is such a time consuming process, computer software is incredibly helpful as it can perform many of the required calculations for the user and is much quicker to display changes and additional information than by hand. However, there are limited software options to date that are designed for scheduling. While there are software options available for several types of planning methods, the Critical Path Method (CPM) seems to be the most typical in construction as it is simple in nature and is relatively easy to follow. Although scheduling software exists and there are several widely used methods of planning, new methods should always be considered. Construction projects will always have deadlines, which are often based on preliminary plans, and rarely does anyone want to push a schedule out as activities fall behind. Time delays are often 11
12 accompanied by heavy cost impacts and other resource implications, so an accurate schedule is a key component to a project. Sometimes viewing a construction plan in varying formats could aid in identifying time-saving methods and cost-saving methods. The student author of this research was offered an internship position in construction and engineering planning as a result of this education and wanted to conduct thesis research pertaining to that particular type of position in order to serve a dual-purpose. The extensive daily exposure to and involvement with planning and scheduling aided the author immensely in gathering research and providing analysis. This research was conducted in an effort to further the pursuit of planning and scheduling development and encourage additional insight to more effective methods of planning. The main goal was to identify a means of planning that was simple enough to learn and understand while also providing a visual appeal to a construction plan. Flexibility is also a key component and the new proposed method to scheduling by Dr. Flood is aimed to allow for flexibility, while also presenting a visual format to the schedule that is still relatively simple to use and develop. Flexibility is implied in being able to compare numerous resource uses throughout the project as well as providing a more visual approach to what-if circumstances. What-if circumstances occur when the user is interested in finding out what would happen to the project if a certain resource was modified or added, or basically when any potential change to the construction schedule would occur. For being such a critical component of the construction process, planning/scheduling seems to be somewhat neglected in terms of extended research and is quite limited in available methods. Providing the industry, and potentially other 12
13 industries that rely on planning, with a new, flexible, visual method to scheduling and planning projects could save time, as well as change the way planners think to schedule projects. Research Objectives The primary goal of this research is to introduce a new graphical approach to modeling in a hierarchical constraint-based format. Planning is an essential portion of construction and manufacturing but little research or development on methods exists at this point. This new approach provides a visual insight to critical path planning while giving the user flexibility in how he or she chooses to model or develop the plan. The goal of this research is to present the new method while also providing case study examples that demonstrate its use and benefits to the user. In addition to introducing the hierarchical constraint-based approach, this research seeks to demonstrate flexibility in scheduling and portraying what-if scenarios with ease and understanding. Also, demonstrating the flexibility of the layout development and work units is addressed. Finally, another goal of this research is to provide construction planners with a new form of visual modeling beyond the limitations of linear scheduling while providing the user with the opportunity to show varying levels of detail and a variety of project types. In summary, the goal of this research is to portray the effectiveness of using the hierarchical constraint-based approach to provide a graphical display of the Critical Path Method. 13
14 Literature Review Critical Path Method Basis The Critical Path Method (CPM) is often considered the most important network modeling technique in the construction industry (Hinze 2004). In CPM-based scheduling, activities are connected in a network and each activity is assigned a duration. For the purpose of this research, a general overview and discussion of the Critical Path Method will be presented, but specific instruction as to how to develop a CPM schedule will not be included. The term CPM bar chart (or the inverse, bar chart CPM ) that is used throughout this research refers to heuristic scheduling software such as Primavera P6 or Microsoft Project Planner that displays the planning information in bar chart format, calculating the critical path as the schedule is developed. These types of software are typically used in commercial project management and are based on critical path analysis (Castro-Lacouture 2009). A more detailed explanation of bar charts is included later in this chapter. In order to develop a CPM-based schedule at the outset of a project, the particular activities that will monitor and accomplish the work must be identified and defined in a logical sequence early on (Galloway 2006). Additional detail can be developed later, but these activities essentially establish the critical path of the project. The additional detail is there for reference or status purpose; however, if durations, lags, and/or constraints are modified throughout the project s progress, the critical path may change. This is why it is imperative to update a CPM-based schedule on a frequent basis if the user is using 14
15 this to evaluate project progress. The purpose of the Critical Path Method is to determine the shortest duration in which the project can be completed (Galloway 2006). In A Comparative Study of University Courses on Critical Path Method-Scheduling, Galloway emphasizes the variation in description of the Critical Path Method and delay analysis across the construction industry (2006). While the basics of the Critical Path Method seem to be adhered to and understood by all, the discrepancy seems to stem from determining what the requirements are for developing a CPM analysis and in what form(s) it may be presented. According to Galloway s more than 20 years of experience in infrastructure construction management, the methods and techniques of CPM scheduling vary widely on any construction site (2006). Benefits While the CPM calculations are simple and straightforward, CPM-based scheduling is a challenging process (Hegazy et al. 2010). Although challenging, when executed correctly at the outset, the CPM process throughout the project s progression becomes significantly easier in terms of analysis. The Critical Path Method is useful in evaluating what-if situations, or situations where the user wishes to see how change might impact the project, but these are only successful if the CPM model is developed correctly with the appropriate relationships at the outset. This initial set-up is challenging and requires the user to have a thorough understanding of the construction process and sequence at hand. CPM can also be used to determine potential methods to shortening the project s duration by allowing for the continuous evaluation of the project s progress based on this initially developed CPM model (Galloway 2006). 15
16 Drawbacks The Critical Path Method is calculated using an algorithm that cannot account for resource limits or project deadlines. While resource leveling and time-cost trade-off analysis can be used to mitigate this complication, a resulting issue is that this may create conflicting solutions a solution to one constraint may interfere with a solution to another (Hegazy et al. 2010). Resource constraints may have a significant impact on the project schedule and are not typically accounted for in the Critical Path Method (Castro-Lacouture 2009). Heuristic scheduling software, particularly the more advanced versions, is designed to allow the user to assign resources to projects and aid in controlling them, but this is difficult to ascertain in bar chart format and can overly-complicate the schedule development in these programs. Although extremely helpful to the user in terms of CPM calculations and displays, an issue with heuristic scheduling software is the inability or difficulty in handling information within a schedule assigned to multiple calendars, which has led to incorrect date calculations (Kim et al. 2005). If the software requires a constant double-check of date calculations, the efficiency factor of using it decreases significantly. Bar charts Perhaps the most familiar method of scheduling, particularly in construction, is the bar chart. This is likely due to its simple nature; it represents schedule activity detail in a graphical manner that is easy for the viewer to comprehend. As mentioned above, the primary reference to bar charts throughout this research is to bar charts generated by CPM heuristic software such as Primavera P6 ; however, a general background of bar charts is provided as well. 16
17 The bar chart was invented by Henry Gantt in 1917, which is why the bar chart is also referred to as a Gantt chart. In this method, the schedule developer may connect a series of activities with a time scale by representing the activities as a horizontal bar that stretches across vertical time increments (Hinze 2004). A user can easily determine the sequencing of activities and the start and finish dates of each almost instantly upon evaluating a bar chart. This simple advantage is why bar charts are the most commonly used scheduling method today they present information quickly and in a logically organized fashion. In addition, bar charts can display the current date or status date of the schedule and demonstrate activity progress easily, which is helpful when taking a cursory glance at a schedule to determine project status (Hinze 2004). One major drawback to using bar charts is that, despite their simplicity, they lose their value as projects become more complicated and activities become more integrated. For instance, as there are more activities included that are co-dependent or occur simultaneously, their relationships are more difficult to deduce from the bar chart. One means of combating this disadvantage is to use logic tie arrows that indicate the relationship of one activity to another. Again, however, as the project becomes more complex, these arrows start to interfere with one another and it is difficult to determine which arrow came from which activity and how it leads to another activity. If the user wanted to develop the precedence diagram more information would be required than is typically shown in a bar chart, or logic ties in the bar chart would need to be clearly identified (Hinze 2004). 17
18 Another issue that arises from using bar charts for complex projects is determining project status. When the schedule is a simple, logical flow of one activity to another, project status can be determined by the progress of the first incomplete activity. In complex projects, where several activities occur simultaneously, each of those activities requires a status update, and the individual progress of those activities cannot determine the overall project progress status unless they are all on-schedule, or delayed at the same point in the project (Hinze 2004). Fortunately scheduling software exists that can logically present bar charts in an easy-to-ascertain fashion. These software applications can also simply convert a bar chart to a precedence diagram back and forth and are easy to update. They also display logic ties in the form of arrow link lines and allow the user to group, sort, and place activities in whatever order the user chooses the placement can be manipulated easily to suit the needs of the user. Linear Scheduling Method Background The Linear Scheduling Method (LSM) is less-familiar than the Critical Path Method. The basic function of LSM is to provide a graphic display of resource allocation that is represented across a time-space interaction while also providing CPM-type calculations (Yamín et al. 2001). While LSM is really an extension of linear scheduling, the terms LSM and linear scheduling are often used interchangeably. In this research, since the focus is really to compare bar charts and linear schedules to a newly proposed method of modeling, and all three integrate the use of CPM-type calculations, the use of the term linear scheduling will technically refer to LSM as well. 18
19 LSM is also referred to as the vertical production method, time-space scheduling method, and repetitive-unit construction (Hinze 2004). The latter descriptive title repetitive-unit construction indicates the types of projects that the Linear Scheduling Method was designed to represent (repetitive projects). Repetitive projects can be classified in two categories projects with activities that represent a consistent unit (modular houses, high-rise buildings), and projects with activities that are repetitive based on a linear geometric layout (pipelines, roadways) (Kallantzis 2007). LSM supposedly stems from the line of balance (LOB) approach to manufacturing, although the specific background development is unclear (Hinze 2004). Three steps to developing a linear schedule There are three basic steps required to develop a linear schedule: 1. Identify activities; 2. Estimate activity production rates; and 3. Develop activity sequence (Hinze 2004). The reason linear scheduling is typically only applied to repetitive projects is because of the second step estimate activity production rates. Production rates are difficult to establish on projects that are not repetitive as there is not necessarily an established foundation to the development of the rate and thus the user could be entirely inaccurate. Hinze states that, in order for a linear schedule to be successful for the project, most of the activities should have the ability to be grouped as a family of repetitive and similar-to-identical tasks (2004). In linear schedules, the activity is represented by a line in a space that has time represented along the horizontal axis and the vertical axis typically represented by a distance or area of sorts. The slope of the line represents the production rate. 19
20 A benefit to these schedules is that the user does not need to be concerned with early starts or late starts to the project; rather, LSM typically represents an expected schedule because of the precision associated with using production rates (Hinze 2004). A linear schedule is really both a deterministic and probabilistic approach as time buffers visible in the schedule indicates that, while production rates are fairly stable, they do not have perfect accuracy, and perfectly straight lines are also not a legitimate representation of production, typically attributed to human error (Hinze 2004). The time buffer, or horizontal distance between two activities in LSM represents free float between activities. An interesting attribute of linear scheduling with respect to free float is that free float between two activities may, and often does, vary as one moves up the vertical axis (typically distance). This is due to varying production rates between activities; the variation of the slopes results in the variation of free float as the user continues up the vertical axis. While the horizontal distance or gap between two activities represents the free float between those activities, the vertical gap between two activities represents the physical space between those two activities. A vertical line drawn from any time chosen along the horizontal axis will intersect all activities scheduled to occur at this time (Hinze 2004). This is also the case in a bar chart schedule. In the linear schedule, however, the line slope variations between activities allow the user to visualize that, while ample free float may exist at that point in time between two activities, converging sloped lines may not allow for the later activity to begin sooner (Hinze 2004). This is one of the significant advantages to having the graphic representation of a linear schedule. 20
21 Linear schedules are simple graphic schedules and thus offer the benefit of proposing quick visual insight as to how to reduce project or activity duration. Linear schedules make it easy to display how adding additional crews or switching to overtime will impact the schedule. Benefits and drawbacks to LSM The primary benefit to using linear schedules is that they are simple but highly visual representations of the schedule. They allow the user to view the schedule in a time-space continuum that makes it significantly easier to determine methods of reducing overall project or activity duration by adding crews, working overtime, etc. It is easy to convey these methods to other users in a quick manner. The main drawback to linear schedules is that they really only work effectively on linear repetitive projects. Even in projects where, despite being linear, two activities could technically occur at the same point on that linear continuum at the same time, this cannot be properly portrayed or considered in a linear schedule (Yamín 2001). For instance, every linear project also has a width to the length of that line. Depending on the activities, two events could occur on the same length point but are far enough apart on the width to occur together. This cannot be accurately represented in a linear schedule. When there are multiple dimensions involved, linear scheduling is less effective. LSM is also not as thoroughly developed and supported in the industry as CPM is. 21
22 CHAPTER 2 HIERARCHICAL CONSTRAINT-BASED GRAPHICAL APPROACH TO MODELING (HCM) CONSTRUCTION PROCESSES The new proposed hierarchical constraint-based approach to modeling (HCM) is a graphical approach proposed initially by Dr. Ian Flood at the University of Florida. It is intended to present a flexible visual format representing CPM simplicity, linear scheduling, and the versatility of simulation. A goal of this new approach is to improve the evaluator s understanding of the organization and behavior of the system. The hierarchy and interaction involved in developing this model are intended to help achieve this goal (Flood 2009). In order to best understand the development of the hierarchical constraint-based modeling approach, an explanation of the primarily elements and their functions is required. Primary Elements of the Proposed New Modeling Approach There are three primary elements to the hierarchical constraint-based approach to modeling, which include resource space, work units, and constraints and objectives (Flood 2009). Resource Space The various resources that impact construction process need to be represented in some type of environment. The resource space is this environment, in which the construction process model exists. While many graphical displays maintain a horizontal or x-axis resource of time and a vertical or y-axis representation of some other identified resource, the new modeling approach is flexible with axis representation and allows for the developer to select resources most pertinent to the evaluation of the construction process. Each axis, or dimension, of the resource space represents a 22
23 resource that is used in the construction process being modeled, such as time, money, distance, or area, or may even be more specific such as heavy equipment, special skilled labor, or certain materials required. While the developer has the flexibility to select any applicable resources when creating this hierarchical model, the most effective resources are those that require monitoring of their use or those that may directly impact the performance of the construction process. These are resources that provide a good measurement of the construction process performance. These dimensions must operate orthogonally, in that they cannot intersect with one another at any given point in the model (Flood 2009). Work Units The work units reside within the resource space. While the resources represent the dimensions or axes of the model, the work units are the individual items of work within the construction project. Work units are represented within each dimension, or within subsets of each dimensions. The HCM model is flexible with work units in that the work units can be represented on a high level or a lower, more detailed level. A high level representation might refer to the overall structural system, whereas the detailed level may refer to more specific activities like forming, concrete placement, and curing. Intermediate levels of detail may also be used based on what the developer is intending to portray in the model (Flood 2009). The level of detail represented by the work units will also directly correlate to the complexity the developer wishes to examine. As this model has not yet fully been developed or integrated, it is important to note that work units can effectively take any shape and exist across multiple dimensions. As this paper seeks to provide a specific detailed analysis of two comparable cases, 23
24 however, the format of work units within this research will only be portrayed by rectangular shapes across two dimensions. The work units should only represent each item of work once, and collectively should represent an entire area of interest. For instance, if the developer chooses to represent the structural system of the building on a more detailed level, the activities of forming, concrete placement, and curing should each be represented only once per set there should be no re-use of the same forming, concrete placement, or curing activity. In addition, if there are other activities that make up that set of the structural system, they must be included, as the group of these activities needs to represent the entire structural system. Constraints and Objectives Constraints within HCM are similar to constraints within other modeling techniques. A typical example of a constraint is easily displayed within linear scheduling, where a crew must maintain a certain distance behind another activity crew for safety or functional purposes. While in LSM this type of constraint would be represented by a vertical axis gap between the lineal representation of each activity, in HCM it is the distance between or location of the edges of the work unit shapes (for the purposes of this paper, the shape is always a two-dimensional rectangle). Essentially the relationships between the work units and the resource space are defined by the constraints within the construction process, and constraints may be any functional relationship between work units and/or resource space (Flood 2009). Other constraints that may not be as easily represented in LSM but are frequent in construction include an instance where a resource cannot be used faster than it becomes available (e.g. on-site use of the resource does not occur faster than it can be 24
25 delivered to the site) or minimizing idol time. In addition, the length of one side of the rectangle may be a function of the length of the other side of a rectangle (e.g. the rate at which CMU blocks are placed is broken down into smaller time periods or representing a larger number of blocks) (Flood 2009). Objectives are identified as a separate item, although technically are considered constraints. Objectives are a higher-level form of constraint, such as minimizing costs, maximizing profits, or completing the construction project by a certain deadline. These objectives are specific to the individual study represented by HCM. An objective can only apply to HCM provided its related resource spaces, work units, and constraints are demonstrated within hierarchical constraint-based approach model that is developed. That is, if the objective is to minimize costs, cost must be a resource dimension represented in that particular HCM model. Additional Notes Applicable to HCM It is plausible that work units may be subdivided into smaller component work units (Flood 2009). In the example mentioned previously regarding the breakdown of the overall structural system activity into more specific activities, such as forming, concrete placement, and curing, these activities could be subset activities nested within the overall work unit of the structural system. Or, if the developer wanted to do an HCM analysis on the structural system as a whole, and the project was a high-rise structural concrete building, the work units could be each level of the building and the subunits would be those individual forming, concrete placement, and curing activities within each level. The flexibility of the HCM model allows the developer to portray the information to whatever level of detail is most optimal for achieving the objective. Additionally this 25
26 makes the model easier to interpret, minimizes errors in the development of the model, and requires less work in updating the model or defining it (Flood 2009). An important feature of the hierarchical constraint-based approach to modeling is that it is interactive in development, i.e. all constraints must be resolved and addressed, and it must be continuously updated as new work units or constraints are added. This is critical as it will aid the user in visualizing impacts of any changes considered; otherwise the tool is rendered useless. In addition, in this form of modeling, it is possible for work units to move in any direction within the resource space without violating constraints. (Flood 2009). HCM allows the user to visualize how the model s performance is dependent on the model s structure, as it is presented as a graph or plot of the work units within at least two dimensions of the resource space (in this paper, only two resource space dimensions will be examined). The visual appeal of HCM may suggest to the user more optimal solutions that may not be visible in linear scheduling or CPM, as well as the consequences of changing certain parameters within the model. Work progress is therefore visible within the model s functional structure. Float is a concept within the Critical Path Method which is often used to examine the flexibility of the schedule. In CPM scheduling, free float is the extent to which an activity can slide to the right (a later time in the schedule) without impacting its succeeding activities. Total float is the extent an activity or activities can shift to the right without impacting the total project duration. In HCM, free float could actually be expressed beyond the resource of time, i.e. free float could be measured by the ability to move between any two work units without impacting the other (Flood 2009). The Critical Path Method only represents float in the 26
27 form of time; the hierarchical constraint-based approach can represent movement of any two work units across any resource dimension something that is unique to this new approach. 27
28 CHAPTER 3 METHODOLOGY As the hierarchical constraint-based approach to modeling is a relatively new and undeveloped technique, the best method to introducing it and describing its versatility and function is through means of case studies. In this case, two case studies were selected. The project first case study, the structural concrete construction of a mid-rise building in Central Florida, was inherited from existing academic research. This serves as a continued evaluation of that project, however on a different level as the previous research was not in reference to HCM. The second case study is of themed rockwork installation at a construction site. The existing schedules for both studies were in CPM bar chart format. The term CPM is used as scheduling software that applies CPM techniques when developing bar charts was used in both instances. The first case study, referred to as the mid-rise building for simplicity purposes, is a detailed schedule that shows a very low-level of construction detail. These activities each occur over a short duration. The second case study, referred to as rockwork installation, is a higher-level schedule of construction detail. These activities each occur over an extended duration, and probably have more thorough schedule detail in concept but not necessarily worth displaying in bar chart format. The goal of the case studies was to first provide a comparison between each project s CPM bar chart schedule and the HCM approach applied to it. The HCM had to be developed manually for each instance and was a time-consuming process, as no scheduling software for this new method has yet been developed. The second part of the goal was to provide a comparison between each case study s HCM approach. 28
29 CHAPTER 4 CASE STUDY #1: MID-RISE BUILDING STRUCTURAL CONCRETE Introduction The first case study refers to a mid-rise structural concrete building that was built in Central Florida. The particular schedule obtained for analysis was a bar chart CPM schedule of the structural concrete subcontractor. Before providing an analysis and comparison of both the bar chart CPM schedule and the proposed hierarchical constraint-based approach to this project, a brief description of the project is required. This project was obtained as a continuation of research conducted by a fellow Rinker School of Building Construction Student. All specific information regarding the project as well as the original bar chart schedule were obtained from this student s existing un-published research. For confidentiality purposes, the name and detailed information regarding the concrete subcontractor and specific building under examination will not be provided. This concrete subcontractor will be referred to as Subcontractor A throughout the paper for purposes of this investigation. Subcontractor A is a structural concrete subcontractor located in Central Florida. The mid-rise building being evaluated in this research was built between 2005 and 2006, and is a 14-level concrete mid-rise shell structure. The design and function of the building was for a multi-family residential tower. This tower contains two levels of parking, a lobby, eight typical condominium floors, one penthouse level, one low roof, and one high roof. 29
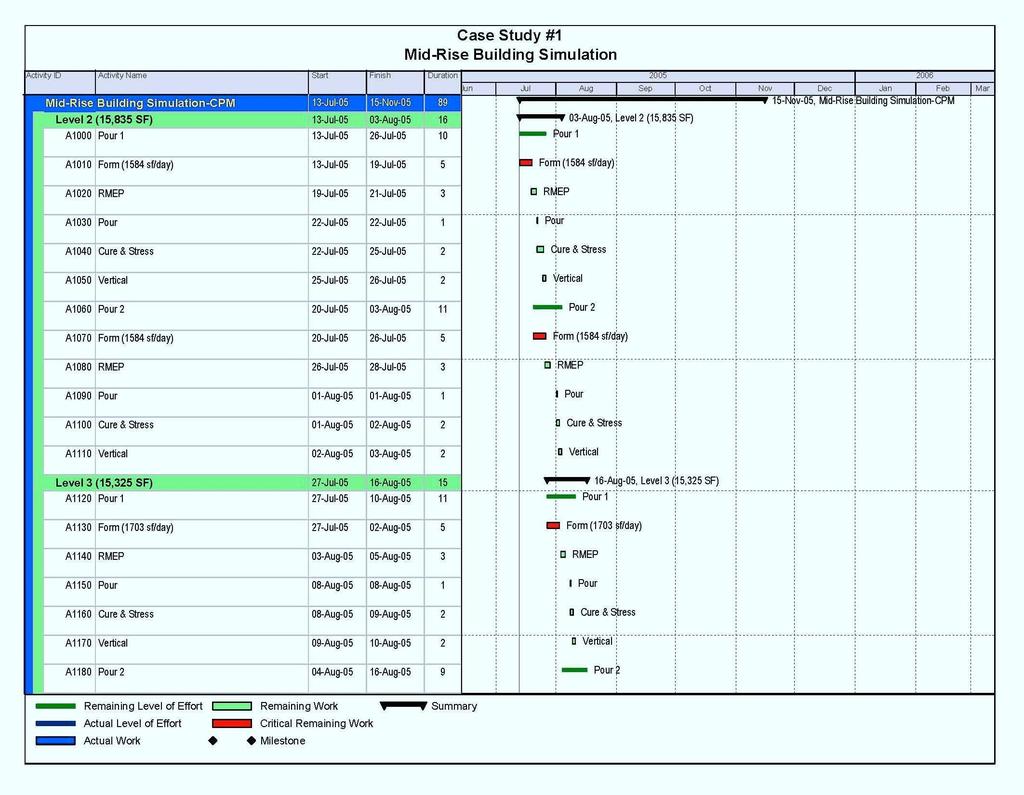
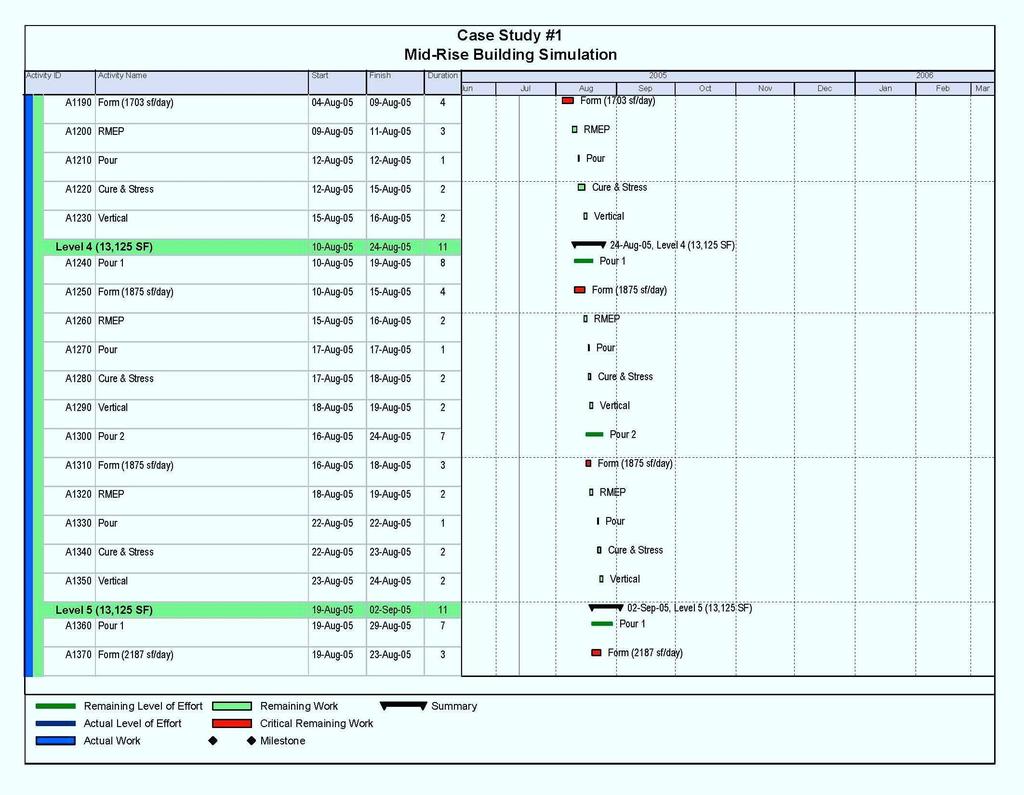
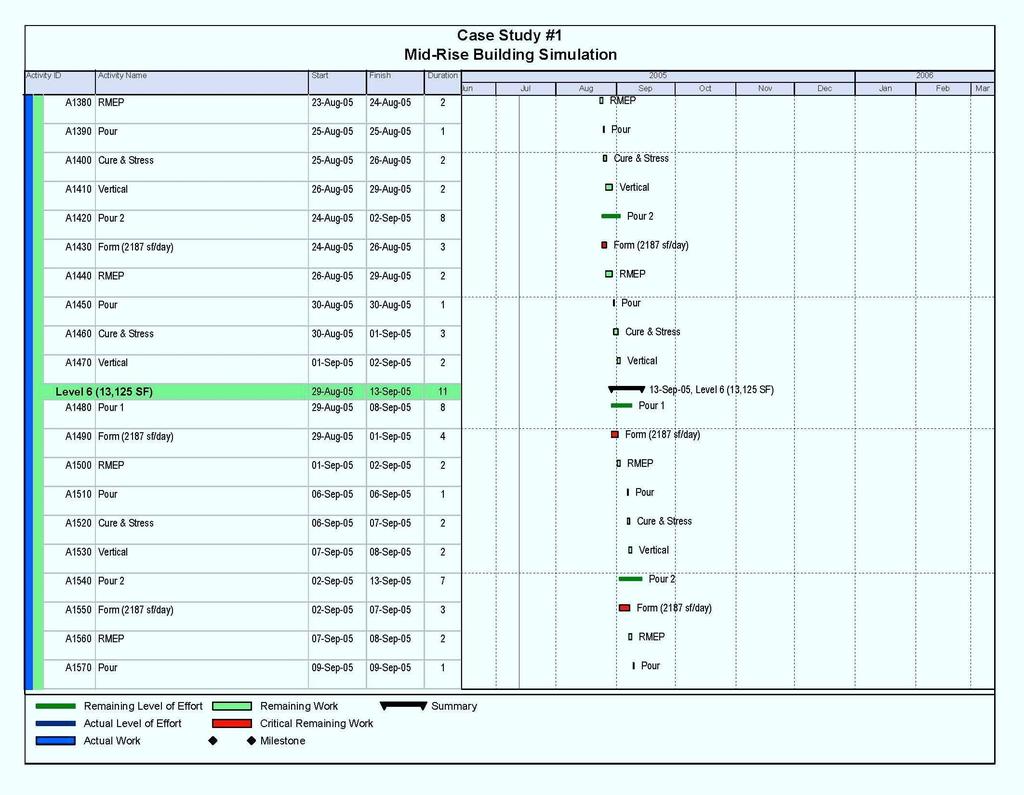
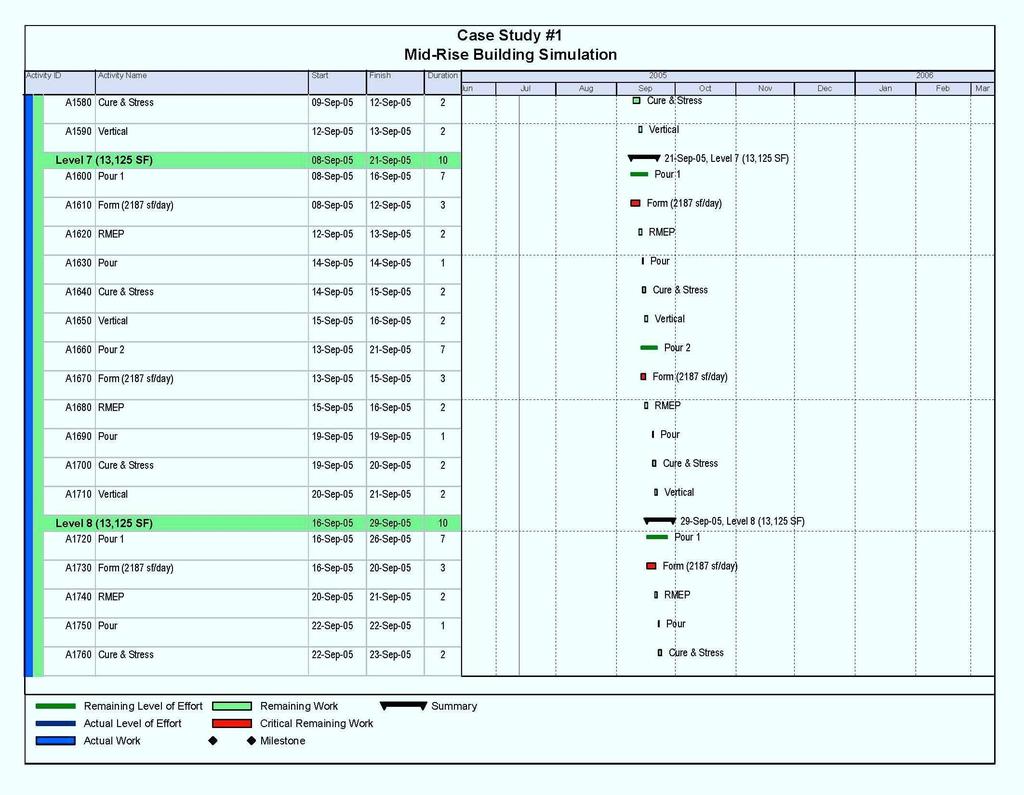
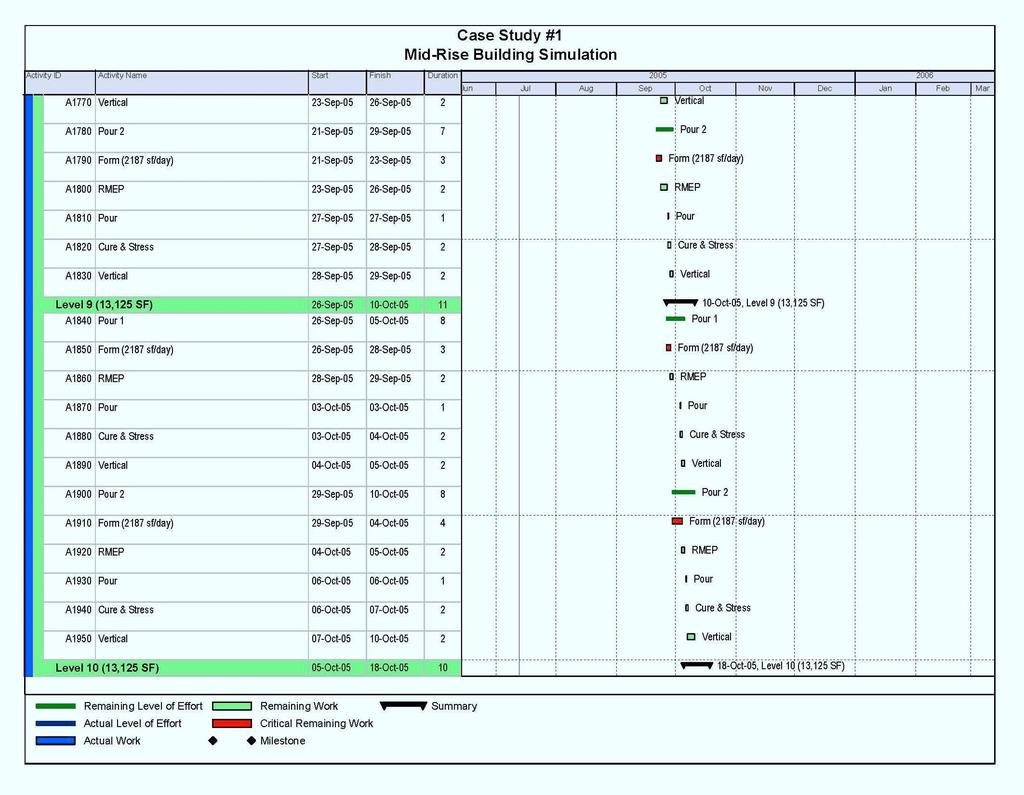
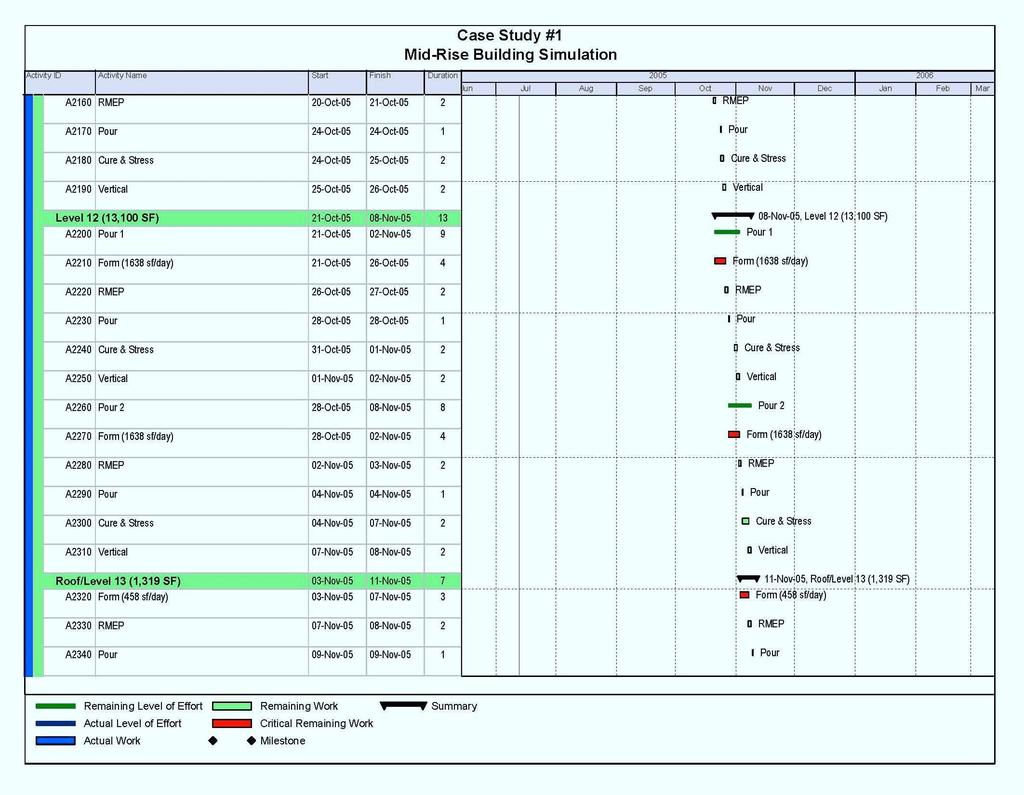
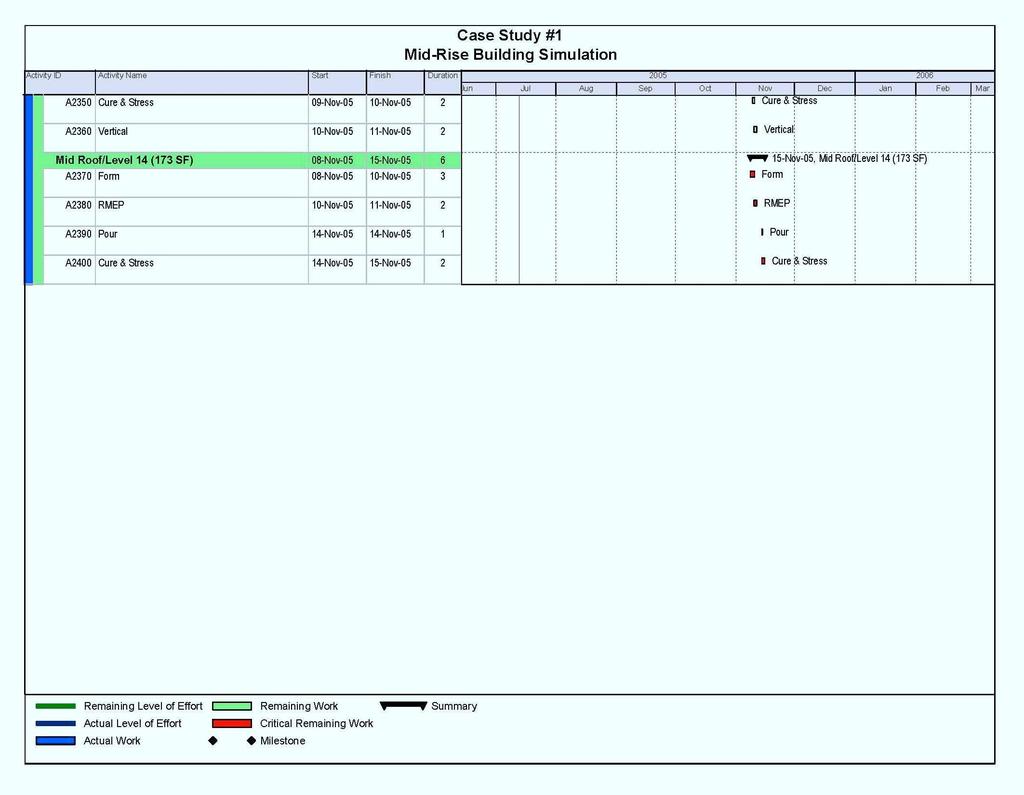
30 Mid-Rise Building Bar Chart CPM Format The schedule for this project is highly repetitive, which typically would be ideal for linear scheduling. However, since the focus of this research is to simply compare common bar chart CPM schedules to the new HCM approach, a linear scheduling analysis will not be provided. The general breakdown of the schedule is into 13 of the 14 levels; the first level is skipped for analysis and levels 13 and 14 represent the roof and the mid-roof levels. Each level is broken down into two overall Pour sections, referred to as Pour 1 and Pour 2. Each of these overall pour activities is broken down into five definitive activities form, RMEP (reinforce mechanical, electrical, and plumbing, rough-in), pour, cure and stress, and vertical. The durations of the activities are broken down by a rate of square feet per day, based on the form resources. Therefore one can determine that the activity of form is the critical path activity within the schedule. While all 13 levels were scheduled in bar chart format and were also included in the hierarchical constraint-based approach analysis, it is not necessary to examine all parts of this schedule. For the sake of this research and having a more approachable schedule system to compare across these methods, only levels 7, 8, and 9 will be reviewed. Please consult Appendix A, pages 4-5 for reference to the bar chart pertaining to levels 7-9 that will be discussed in the following analysis. Each of these three levels includes 13,125 square feet of structural concrete. The critical path form activity for each pour within each level (two pours per level) completes at a rate of 2,187 square feet of concrete per day. A reviewer can determine that the form activity is the constraining activity, as well as the critical path activity as the succeeding form activity does not begin until after the preceding form activity is 30

31 complete (and, with the technologies of bar chart software, the critical path activities are represented by red bars). While the other four activities within each overall Pour are sequential successors to the form activity, they do not govern the project duration. Hierarchical Constraint-Based Approach Format The newly proposed hierarchical constraint-based approach to modeling provides a more visual insight to the mid-rise building s construction process. Figure 4-1 demonstrates the structural concrete CPM bar chart schedule applied in HCM format. Figure 4-1. Levels 7-9 structural concrete activities expressed in HCM format. In this case study, there are two resources defining the dimensions of the resource space: the first, along the horizontal axis, is the square footage of the concrete (the furthest right point represents the total square footage of structural concrete); the second, along the vertical axis, is time in work days. The work units are broken down into two overall Pours per level. There is a Pour 1 and Pour 2 activity for every level except for the two rooftop levels. The sub-work-units are the detailed activities that 31
32 make up each overall Pour activity within each overall Pour are sub-work-units of form, RMEP, pour, cure and stress, and vertical. The basis of this project as defined by the CPM as-built schedule indicates that the constraints are really just the critical path activities of the project (in the CPM analysis and figure 4-1, this is the form activity). The objective then is to reduce the overall duration of the structural concrete installation in-field. As is discussed earlier in the research, one helpful feature of the HCM approach is its flexibility in representing various levels of detail. This construction process the concrete structural development of a building is one of the more detailed schedules. As the structural concrete is just one subcontract of many involved in completing the building, and it is broken down into specific components by level, then by two group activities (Pours) per level, then the four Pour activities per Pour, per level, it serves as an example of taking low-level schedules and applying HCM. Another means of determining that it is considered a low-level schedule (in terms of schedule detail) is by the brevity of the durations of each activity. In this schedule, each activity is less than five days, other than overall grouping summary bars or summary activities. Figure 4-1 was developed by taking the CPM dates, durations, and logic ties and applying them to the HCM approach. One could interpret that the form activity is the critical path activity by noticing that the corners of each form activity line up all along the way. There is no vertical nor horizontal gap between the form activities, meaning any constraints pertaining to this system were resolved. It could also be determined that these constraints were resolved in the bar chart model as well by noting that the 32
33 succeeding form activity starts the first work day after the preceding form activity (although it is three days later in the case of weekends). As flexibility and visibility are the primary benefits of using the hierarchical constraint-based approach, this case is an excellent example. If the user wanted to evaluate a what-if situation, this example would work well. For instance, perhaps it was determined by Subcontractor A that the succeeding form activities could actually follow the preceding form activities by means of a start-to-start (SS) relationship with a lag, the critical path would change (provided all durations and the productivity rates remained the same). If this were the case, perhaps the next likely critical path activity is the pour activity. This all depends on resources available and site constraints, but this model makes it easy to visualize the impacts of changing the number of shifts, shift durations, work crews, etc. For the purpose of demonstration, say that Subcontractor A concluded that it has enough resources to overlap the form activities, and that the RMEP activities have plenty of resources. Say the user concludes the limited resource usage is on the pour activity, which is demonstrated in Figure 4-2. If this were true, the user could use this method to conclude that this is a much more efficient means of placing the concrete. The current format of the CPM schedule applied directly with corresponding dates and durations to the HCM approach model uses 25 work days for the concrete structural completion of all three levels. With this what-if analysis of determining that the pour activity is the project s critical activity, the overall duration of these three levels in only 15 work days. This indicates that it is possible to reduce the overall duration of levels 7-9 by 50% - a very high number. 33

34 Figure 4-2. The mid-rise building structural concrete in HCM form, modified to reflect pour as the constraining activity. Resolutions Regarding HCM with Case Study #1 The potential for this HCM method is infinite. The user could even use this method to change the critical activity throughout levels. Perhaps the user concludes that the critical activity for levels 2 and 3 is the formwork, since these maintain the largest area of all levels, while the critical activity for levels 4-11 is the pour activity, and then that the critical activity for the remaining, smaller levels is the cure and stress activity. The user could then make those applications and find the best, most-diverse critical path with the easiest visual insight to logic ties. An issue that may arise from the Critical Path Method utilized in the bar chart for this project is the number of logic ties and how they might change. It is crucial in a project to make sure every activity is logically tied to any activity that may directly impact it; however, these need to constantly be updated as the construction logic may easily change through the progress of the project. On the opposite end, perhaps it s deemed necessary to provide additional constraints on the project. Maybe the cure and stress activity needs to last seven days 34
35 before the crew(s) can start work on the next overall Pour activity. This provides a more abstract view into possible conflicts in the schedule. Overall, utilizing the HCM approach to this highly repetitive process is extremely helpful. Particularly in a situation like this where the objective is to reduce overall time, this approach allows the user to easily visualize the what-if and see instant impacts in duration as adjustments are made. While this works to the contrary (as in, delays in the project), it is a helpful tool for visualizing or demonstrating to outside parties the schedule impacts that may take place. 35
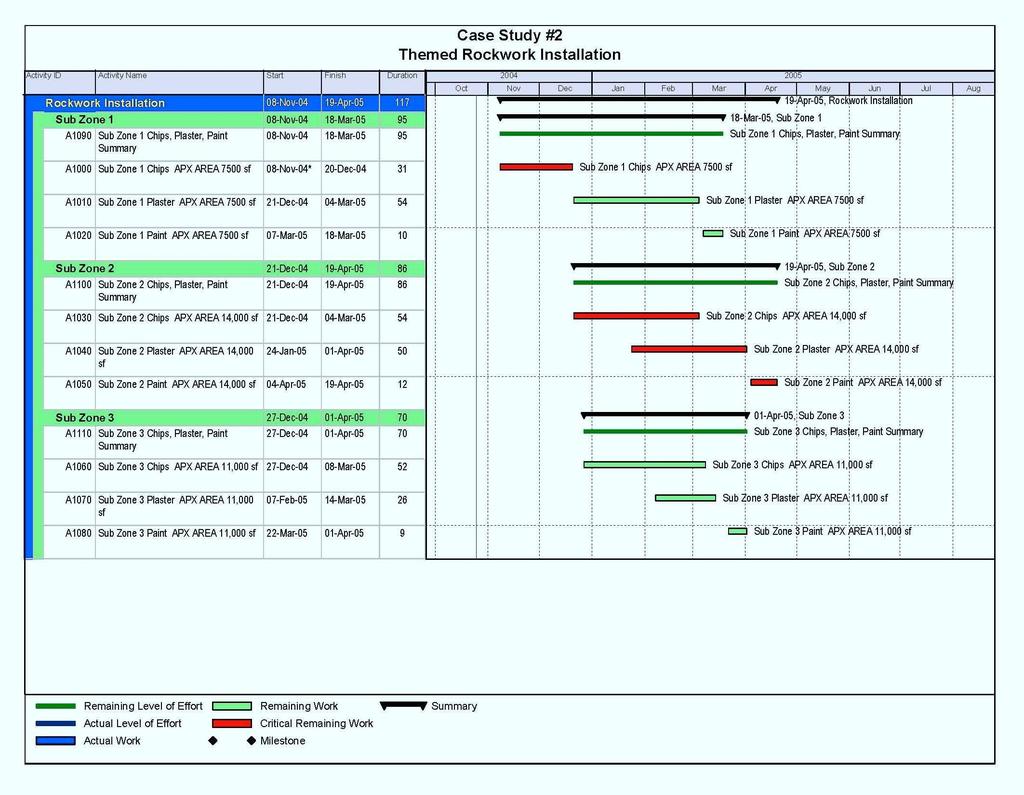
36 CHAPTER 5 CASE STUDY #2: THEMED ROCKWORK INSTALLATION Introduction The second case study is a unique type of project classified in construction for the entertainment industry. The project is the themed rockwork installation for a theme park attraction. For confidentiality purposes, the particular attraction and location will remain undisclosed, but enough information will be presented to provide the reader with an understanding of the project and how the various scheduling methods may be applied. This particular rockwork installation was divided into three zones, referred to as Sub Zone 1, Sub Zone 2, and Sub Zone 3. There are several methods to installing themed rockwork, and the method selected for this project was the chip method. The chip method of rockwork construction involves breaking down the overall rockwork segments into smaller pieces, or chips, of rebar mesh shapes that are fabricated in a shop and then shipped to the site. On-site, the chips are installed in segments (in this case, by sub zone) and the supporting concrete is sprayed on the mesh chips. As the concrete is curing, the rockwork shapes are carved in detail. One the concrete has cured, the painting begins. Rockwork construction and installation is unique in that it is a combination of construction and art it is a specialty contractor. For this type of project, special painters outside of specialty theming contractors were used to provide themed painting and coloring of the rockwork chips. As a result, the activities in this case study are higher-level as the rate at which the sub-components of the construction and installation process will vary and therefore could not be accurately represented in smaller time 36
37 components. In addition, the rebar chip segment fabrication is not included as this activity is done in a shop and is not part of the field construction activity. This portion of the project contained a combined total of 32,500 square feet of rockwork. The three sub zone activities each contained three construction activities chips, plaster, and paint. Themed Rockwork Installation Bar Chart CPM Format As mentioned previously, the schedule for this themed rockwork installation and construction is very high-level. The total duration for the three sub zones was 117 work days. The complete bar chart schedule for the themed rockwork installation can be viewed in Appendix B for reference to this portion of the analysis. This schedule is very interesting in that it appears several different methods to planning the rockwork activities were used. Sub Zone 1, which began first, follows finish-to-start (FS) logic ties between all three activities chips, plaster, and paint, in chronological order. Sub Zones 2 and 3 however have overlap between their chips, plaster, and paint activities. Several explanations pertaining to this are that there was a learning curve associated with the activities, resource supply/demand changed, or an accelerated schedule was required and resources were adjusted accordingly. By viewing the bar chart schedule, it initially appears that the chips activity is a limiting resource schedule-driver. That is, the reader may ascertain that the chips activity for Sub Zone 2 does not begin until immediately after the completion of the chips activity for Sub Zone 1. Further analysis, however, would indicate that the Sub Zone 3 chips activity occurs concurrently with the Sub Zone 2 chips activity, with a one week lag and slightly shorter duration (52 work days for Sub Zone 3 as opposed to 54 work 37
38 days for Sub Zone 2). The shorter duration may be explained by the smaller area of rockwork. What is really interesting is that although Sub Zone 1 is the smallest area of rockwork 7,500 square feet as opposed to 14,000 square feet for Sub Zone 2 and 11,000 square feet for Sub Zone 3 it has the longest duration. This again may be associated to the potential contributing factors listed previously a learning curve, a change in resource supply, or an accelerated schedule with additional resources. Based on knowledge pertaining to the remainder of the project, the explanation is mostly attributed to an accelerated schedule. While it is not displayed, the rockwork schedule was driving the installation of some structural steel for other elements of the project. The critical path of the project therefore begins with the Sub Zone 1 chips activity, but then all of Sub Zone 2 makes up the remainder of the critical path. This is likely due to an inability to properly forecast the schedule durations for these activities. Once the process began and was taking longer than planned, the project team needed to work out a plan to complete all three zones by the required date to avoid impacting the succeeding steelwork installation activities, thus the resulting critical path. In all three sub zones, however, the paint activity cannot occur prior to the completion of the plaster. The reader might also infer from the schedule that none of the paint activities overlap with one another. This is due to a limited resource on skilled painters available to paint. The reader might also notice that the paint activities are consecutive to one another, with few to no gaps between. Hierarchical Constraint-Based Approach Format The hierarchical constraint-based approach is relatively simple when applied to this project as the activities are at a higher level of detail (as in, longer tasks with fewer 38

39 detailed or intricate tasks). The resource space is made up of the dimensions of time on the vertical axis and rockwork area (in square feet) on the horizontal axis. The primary work units are each of the three sub zones Sub Zone 1, Sub Zone 2, and Sub Zone 3. within each sub zone and sub-work units of chips, plaster, and paint. These sub-work units are then further broken down to show the rate of completion. This is demonstrated in Figure 5-1. Figure 5-1. Visual of rockwork construction and installation activities presented in HCM format. Note that the figure is not to scale. The team who planned this project chose to execute the construction in a strategy of zone break down. This display makes it evident that Sub Zone 2 activities were on the critical path, following the completion of the chips activity in Sub Zone 1. It might also be prudent to switch Sub Zone 2 and Sub Zone 3 in their layout as it would more easily demonstrate paint as a constraining resource. This is demonstrated in Figure

40 Figure 5-2. The HCM approach to rockwork installation, switching positions of Sub Zone 2 and Sub Zone 3 and eliminating idle time. Note that the figure is not to scale. The flexibility of HCM allows the user to make these modifications with ease to provide different viewpoints on the construction plan. The format in Figure 5-2 makes the resource constraint of the paint sub-work unit clearer, as all three sub zones are stacked vertically and continue straight through along the horizontal square footage. This format also resolves the time constraints while eliminating the idle time between activities that do not require time constraints. This appears to reduce the overall duration to about 100 days, which is almost a full month shorter than the unresolved method from the CPM bar chart. The CPM bar chart format does not indicate the ability to reduce these durations. Putting the project in HCM format makes it easier to visualize constraints and idle time, allowing the user to easily resolve constraints and eliminate idle time while achieving a graphical image of the schedule. The user should also notice that there is idle time in Sub Zone 2 between the completion of plaster and the start of paint. Since the objective of this model is to reduce 40
41 the overall duration, but it is known that the same paint resources are used for all three zones and cannot be used concurrently or with overlap, it is not necessary to remove that idle time. The hierarchical constraint-based approach on this project also provides visibility to the fact that Sub Zone 1 is the only one of the three sub zones where the activities of chips and plaster do not overlap. This is easier to point out as the schedule being evaluated is an as-built schedule. The user could infer any number of reasons for this: the required completion date of the rockwork installation moved earlier during the construction process of Sub Zone 1; the scheduled durations were taking longer than the plan, and the completion deadline remained the same; additional resources were added to allow concurrent activities in Sub Zone 2 and Sub Zone 3, etc. Viewing the schedule in HCM format provides the user with an easier tool for analysis of how to modify durations. By viewing this layout, the user could determine that he or she needs to bring on additional resources to aid in rockwork painting, so painting can occur concurrently in multiple sub zones. Or, the user may choose to add additional resources to the chips and plaster activities from the start of Sub Zone 1, allowing the durations of those activities to be reduced and therefore reduce the overall rockwork installation duration. In addition, the user can see the gaps between work unit completions and could potentially reduce the overall project duration by beginning other activities early and resolving the false time constraints that appear. Resolutions Regarding HCM with Case Study #2 The hierarchical constraint-based approach to modeling Case Study #2 proves to be incredibly helpful. HCM in this instance provides significantly more visual insight to the construction schedule that is available from the CPM bar chart. Idle time between 41
42 activities is visible without having to search for gaps in a bar chart schedule. The critical path is relatively easy to point out and constraints are clearly identified. The model is flexible so that the user may exercise several options to consider in what-if situations. Reorganizing the sub zones in the HCM approach so that the paint activities are chronological results in a quick identification of the paint constraint and the project s critical path. This also allows the user to how the production rates (or construction/installation rates) of the repetitive activities varies across each of the three rockwork sub zones. The bar chart format for Case Study #2 seems difficult to read and interpret compared to the HCM model. For this example, identifying the project constraints and idle time is much tougher and more time consuming in the bar chart format than in the HCM model. In this HCM model, is it just as easy to identify the critical path as it is in bar chart format and is much more flexible for what-if situations. It also provides a better visual for a what-if scenario depending on whether the user wishes to add or remove resources or reorganize activities. For project schedules like those of this themed rockwork installation, the new proposed HCM approach could prove to be immensely helpful to the user. It allows the user the opportunity and flexibility to achieve the objective of reducing the project duration. More simply, this approach allows the user to view gaps in time in the process and changing patterns. 42
43 CHAPTER 6 CONCLUSIONS AND SUGGESTIONS FOR FUTURE REASEARCH The newly proposed hierarchical constraint-based approach to planning is a flexible and useful tool when modeling various forms of construction processes. HCM provides a unique visual model that allows the user to evaluate the project across multiple resources and makes it easier to evaluate what-if situations and how those resources may be affected. A key objective of HCM is to provide visual insight to a project like linear scheduling, while also maintaining the simple aspects of a schedule like CPM bar charts. The Linear Scheduling Method is limited to repetitive activity projects that typically have a lineal construction path, but provides users with a visual of the project. HCM is designed to maintain that visual appeal but be more versatile in the types of projects that it can present. CPM bar charts provide users with a basic visual but are less helpful when trying to portray constraints and do what-if analyses. The purpose of the case studies was to examine two unrelated projects in their native schedule format CPM bar chart and apply the hierarchical constraint-based approach and compare. The first case study, the mid-rise structural concrete building, was very repetitive in its makeup. Applying HCM to this was helpful as it clearly demonstrates the construction process and allows the user to shift activities around to determine the most efficient use of time or other resources. The second case study really benefitted from the HCM approach. Applying HCM to the themed rockwork installation was very interesting, as it was made immediately apparent that the final activity to each work unit, paint, was the constraining resource. The painting of all three sub zones occurred one on top of the other with no idle time between. This allows the 43
44 user to determine that perhaps it would be best to bring on additional paint resources if necessary. The critical path also became clear with HCM. What was interesting about the second project was the addition of the sub-work unit boxes, which each represented one work day. Theoretically the lines should be relatively linear, but for the sake of presenting the model in a simple format, the manually placed boxes in a line are sufficient. When viewing the work units, it appeared there could be significantly more overlap in the activities. As themed rockwork is an art in addition to a construction/installation activity, however, simply adding additional resources is not easy and can be costly. Only in Sub Zone 3 does it appear that the activities are more stacked and have little idle time among them. Overall, these two case studies represented very different types of projects on different levels of detail. Both were scheduled in CPM bar chart format originally, and both benefitted from the use of HCM, even if just to provide an additional visual scheduling tool. Some limitations to the research and the hierarchical constraint-based approach to modeling include that it is time-consuming, no software exists for it yet, and it may not accurate represent resource usage rates. Depending on the complexity of the project being analyzed, the HCM approach can take a long time to develop. Each box has to be created and formatted and the small individual work units need to be lined up and stacked according to some type of system. There is no computer software yet to provide this simulation, so the process must be done manually and this may take more time than is worth in some instances. Also, in many cases, the sub-work unit rates area calculated and implied. For the 44
45 rockwork project, the rate was interpreted by dividing the square footage of the area by the number of work days it took to complete that sub-work unit. Especially for unique projects like themed rockwork installation, this rate could actually vary significantly throughout the completion of the task. Therefore it might not be an accurate representation if a user wanted to perform a what-if to shift all activities so the least amount of time is consumed. As this is a fairly new approach to modeling, further research would be extremely beneficial. Performing case studies using different resources would be a good method. Also, evaluating a model across a multi-dimensional resource space could prove very interesting. Researching software options for providing an electronic, automated use of the tool would also be helpful. 45
46 APPENDIX A MID-RISE BUILDING BAR CHART SCHEDULE 46
47 47
48 48
49 49
50 50
51 51
52 52
53 53
54 54
55 APPENDIX B THEMED ROCKWORK INSTALLATION BAR CHART SCHEDULE 55
56 56
A COMPARISON OF THE FORESIGHT AND STROBOSCOPE METHODS OF MODELING CONSTRUCTION PROCESSES
 A COMPARISON OF THE FORESIGHT AND STROBOSCOPE METHODS OF MODELING CONSTRUCTION PROCESSES By VALEH NOWROUZIAN A THESIS PRESENTED TO THE GRADUATE SCHOOL OF THE UNIVERSITY OF FLORIDA IN PARTIAL FULFILLMENT
Program Evaluation and Review Technique (PERT)
") Program Evaluation and Review Technique (PERT) PERT Bar charts and CPM networks assume all activity durations are constant or deterministic. The assumption of constant durations may not be realistic because
Program Evaluation and Review Technique (PERT) PERT Bar charts and CPM networks assume all activity durations are constant or deterministic. The assumption of constant durations may not be realistic because
Office Building. Analysis #2: Utilizing a Matrix Schedule
 Analysis #2: Utilizing a Matrix Schedule Problem Statement In the past, the team has accelerated the schedule by re-sequencing or re-designing a specific system and/or piece of the schedule to gain back
EXHIBIT 2-2-C SCHEDULES
 EXHIBIT 2-2-C SCHEDULES PART 1 GENERAL 1.01 SUMMARY A. The Work specified in this section consists of furnishing transportation, labor, materials, equipment, and incidentals necessary for preparation,
Project Planning & CPM Scheduling using MS Project. APWA NorCal 2018 Annual Conference
 Project Planning & CPM Scheduling using MS Project APWA NorCal 2018 Annual Conference What is Planning? Planning: A determination of the what, how, where and by whom ; the tasks that need to be completed
13 Project Graphics Introduction
 Page 725 13 Project Graphics 13.0 Introduction In Chapter 11, we defined the steps involved in establishing a formal program plan with detailed schedules such that the total program can be effectively
Week 5 Project Work Plan
 Week 5 Project Work Plan 457.657 Civil and Environmental Project Management Department of Civil and Environmental Engineering Seoul National University Prof. Seokho Chi shchi@snu.ac.kr 건설환경공학부 35 동 304
Project Time Management
 Project Time Management Understand the importance of project schedules and good project time management. Define activities as the basis for developing project schedules. Describe how project managers use
SECTION CONSTRUCTION SCHEDULES (COMPUTERIZED CPM FORMAT) UNIT PRICE CONTRACTS
 UNIT PRICE CONTRACTS") SECTION 01 32 00.3 CONSTRUCTION SCHEDULES (COMPUTERIZED CPM FORMAT) UNIT PRICE CONTRACTS Note: This section is intended to include general procedural requirements for the preparation, submittal and updating
SECTION 01 32 00.3 CONSTRUCTION SCHEDULES (COMPUTERIZED CPM FORMAT) UNIT PRICE CONTRACTS Note: This section is intended to include general procedural requirements for the preparation, submittal and updating
A New Networking Technique The Beeline Diagramming Method Seon-Gyoo Kim
 2018 International Conference on Mechanical, Electronic and Information Technology (ICMEIT 2018) ISBN: 978-1-60595-548-3 A New Networking Technique The Beeline Diagramming Method Seon-Gyoo Kim Department
PROJECT PLANNING AND SCHEDULING
 PROJECT PLANNING AND SCHEDULING AFTAB HAMEED MEMON Office: E6-003A, Makmal Kej. Bangunan Jab. Kej. Bangunan & Peminaan, FKAAS Contact No. 014-2527620 E-mail: ah78memon@hotmail.com Introduction to Project
SECTION CONSTRUCTION SCHEDULES (COMPUTERIZED CPM FORMAT) [LUMP SUM CONTRACTS]
![SECTION CONSTRUCTION SCHEDULES (COMPUTERIZED CPM FORMAT) [LUMP SUM CONTRACTS]](/thumbs/87/96039203.jpg "SECTION CONSTRUCTION SCHEDULES (COMPUTERIZED CPM FORMAT) [LUMP SUM CONTRACTS]") SECTION 01 32 00.1 CONSTRUCTION SCHEDULES (COMPUTERIZED CPM FORMAT) [LUMP SUM CONTRACTS] Note: This section is intended to include general procedural requirements for the preparation, submittal and updating
SECTION 01 32 00.1 CONSTRUCTION SCHEDULES (COMPUTERIZED CPM FORMAT) [LUMP SUM CONTRACTS] Note: This section is intended to include general procedural requirements for the preparation, submittal and updating
DIVISION 1 GENERAL REQUIREMENTS SECTION PROJECT SCHEDULE
 DIVISION 1 GENERAL REQUIREMENTS SECTION 01 32 16 PART 1 - GENERAL 1.1 RELATED DOCUMENTS A. All drawings and technical specifications, Notice to Bidders, Instructions and Information to Bidders, Bid Proposal
ENGINEERING MANAGEMENT (GE
 بسم هللا الرحمن الرحيم ENGINEERING MANAGEMENT (GE 404) 1 L E C T U R E # 4 Scheduling and Bar Chart Contents Objectives of the present lecture Planning and Scheduling Activity and Event Scheduling Techniques
COST LOADED CONSTRUCTION SCHEDULES PART 1 - GENERAL
 SECTION 01310 COST LOADED CONSTRUCTION SCHEDULES PART 1 - GENERAL 1.01 SCOPE: A. COST LOADED CONSTRUCTION SCHEDULE (Construction Schedule): The WORK under this Contract shall be planned, scheduled, executed,
Construction Planning and Scheduling
 Instructor s Manual to accompany Construction Planning and Scheduling Fourth Edition Jimmie W. Hinze Updated by Paresh Shettigar Upper Saddle River, New Jersey Columbus, Ohio Copyright 2012, 2008, 2004,
Project Time Management
 Project Time Management Prof. Dr. Daning Hu Department of Informatics University of Zurich Adapted from Managing Information Technology Projects, Schwalbe Learning Objectives Define activities as the basis
5.3 Supply Management within the MES
 Technical 6x9 / Manufacturing Execution Sytems (MES): Design, Planning, and Deployment / Meyer / 0-07-162383-3 / Chapter 5 Core Function Production Flow-Oriented Planning 85 Customer data (e.g., customer
The Effects of Comparative 4D Models on Schedule Development and Controls. Abstract
 The Effects of Comparative 4D Models on Schedule Development and Controls Kevin Coyne, P.E. Managing Engineer, Exponent, Inc. Abstract In this paper the argument is made that the use of comparative 4D
PMP Exam Preparation Course Project Time Management
 Project Time Management 1 Project Time Management Processes Define Activities Sequence Activities Estimate Activity Resources Estimate Activity duration Develop Schedule Control Schedule In some projects,
Cambridge International AS & A Level Computer Science
 Topic Support Guide Cambridge International AS & A Level Computer Science 9608 For examination from 2017 Topic 4.4.3 Project management PERT and GANTT charts Cambridge International Examinations retains
Technical Report II. The Office Building. Rendering courtesy of DAVIS. Brett Miller. Dr. Gannon Construction
 Technical Report II The Office Building Rendering courtesy of DAVIS Brett Miller Dr. Gannon Construction 10/16/2013 Executive Summary This technical report analyzes key features of The Office Building
4D Model Analysis. Introduction
 4D Model Analysis Introduction 4D models can be useful either as alternatives to CPM networks and bar charts, or as supplements to these schedules. People can more easily understand the project schedule
Project Planning, Scheduling and Preparation of Quality Assurance Control Documents
 Project Planning, Scheduling and Preparation of Quality Assurance Control Documents J.SHARANYASREENIVAS 1, G.GAJALAKSHMI 2, K.RAVI THEJA 3 1P.G Student M.Tech (Structural Engg. and construction managment),
Scott M. Francis, P.E., PSP
 Scott M. Francis, P.E., PSP LONG INTERNATIONAL Long International, Inc. 5265 Skytrail Drive Littleton, Colorado 80123-1566 USA Telephone: (303) 972-2443 Fax: (303) 200-7180 www.long-intl.com Scott M. Francis,
The concept of linear scheduling
 2010 The concept of linear scheduling TILOS Linear project GmbH 22.06.2010 THE CONCEPT OF LINEAR SCHEDULING INTRODUCTION Traditional scheduling software for the construction industry is dominated by Primavera,
Plan Your Work, Work Your Plan. Dr. R. Rockland Chair and Professor, Department of Engineering Technology New Jersey Institute of Technology
 Plan Your Work, Work Your Plan Dr. R. Rockland Chair and Professor, Department of Engineering Technology New Jersey Institute of Technology Agenda Understand what a project is Understand the basics of
Time Management PLANNING
 Time Management 6.1 Plan Schedule Management: The process of establishing policies, procedures and documentation for planning, developing, managing, executing and controlling the project schedule # Schedule
6 PROJECT TIME MANAGEMENT
 CHAPTER 6 PROJECT TIME MANAGEMENT LEARNING OBJECTIVES After reading this chapter, you will be able to: Understand the importance of project schedules and good project time management Define activities
"Computer Application in Project Management" may simply be described as five-step process as follows (Rosenau, 1992)
") 01. Introduction 1.1 Background 1.1.1 Project management concept "Computer Application in Project Management" may simply be described as five-step process as follows (Rosenau, 1992) (1) Defining Defining
01. Introduction 1.1 Background 1.1.1 Project management concept "Computer Application in Project Management" may simply be described as five-step process as follows (Rosenau, 1992) (1) Defining Defining
Chapter 8 Project Monitoring and Control It s important to have a schedule, but it s more important to use it
 Chapter 8 Project Monitoring and Control It s important to have a schedule, but it s more important to use it Header1 Project control can be reduced to two basic components: Monitoring and control Construction
Line of balance programming
 Line of balance programming 1. INTRODUCTION Most contractors are familiar with programming a single project where a critical path analysis or, more likely, a bar chart is drawn up indicating what activities
Chapter 3 Assembly Systems. Screen Titles
 Chapter 3 Assembly Systems Screen Titles System Input / Output Methods of Assembly Manual Assembly Automated Assembly Flexible Assembly Choice of Assembly Assembly Economics Assembly Line Components Assembly
Network Diagram 11/10/2016 WORK BREAKDOWN STRUCTURE (WBS)
") /11/16 Network Diagram 11//16 1 WORK BREAKDOWN STRUCTURE (WBS) A work breakdown structure is a key project deliverable that organizes the team's work into manageable sections. The Project Management Body
/11/16 Network Diagram 11//16 1 WORK BREAKDOWN STRUCTURE (WBS) A work breakdown structure is a key project deliverable that organizes the team's work into manageable sections. The Project Management Body
L & L Mitigation Aid for Effective Project Management System
 www.cafetinnova.org Indexed in Scopus Compendex and Geobase Elsevier, Geo-Ref Information Services-USA, List B of Scientific Journals, Poland, Directory of Research Journals ISSN 0974-5904, Volume 09,
Information Technology Project Management, Seventh Edition
 Information Technology Project Management, Note: See the text itself for full citations. Understand the importance of project schedules and good project time management Discuss the process of planning
Scheduling. Adapted from John Musser
 Scheduling Adapted from John Musser Today Network Fundamentals Gantt Charts PERT/CPM Techniques WBS Review Types: Process, product, hybrid Formats: Outline or graphical organization chart High-level WBS
Charting and Diagramming Techniques for Operations Analysis. How to Analyze the Chart or Diagram. Checklist of Questions - Example
 Chapter 9 Charting and Diagramming Techniques for Operations Analysis Sections: 1. Overview of Charting and Diagramming Techniques 2. Network Diagrams 3. Traditional Engineering Charting and Diagramming
Managing Projects with MS Project 2010
 Aptech Ltd. Version 1.0 Page 1 of 13 Table of Contents A B C D E F G H I J K L M N O P Q R S T U V W X Y Z Aptech Ltd. Version 1.0 Page 2 of 13 Accrual Actuals Allocation Assignment Assignmenttimephased
FACTFILE: GCE DIGITAL TECHNOLOGY
 FACTFILE: GCE DIGITAL TECHNOLOGY AS1: APPROACHES TO SYSTEMS DEVELOPMENT Alternative development approaches and Software projects Learning Outcomes Students should be able to: describe the main features
Planning & scheduling
 Hashemite University Department of Civil Engineering Construction Planning & scheduling Introduction Dr. Maha alkasasbeh Planning & scheduling Owners want their projects completed within specified time
Project Planning & Scheduling
 Project Planning & Scheduling 2 Objectives To introduce and discuss key concepts and techniques for planning and scheduling major projects To provide ideas for development of a practice session to apply
Proceedings of the 2014 Winter Simulation Conference A. Tolk, S. Y. Diallo, I. O. Ryzhov, L. Yilmaz, S. Buckley, and J. A. Miller, eds.
 Proceedings of the 2014 Winter Simulation Conference A. Tolk, S. Y. Diallo, I. O. Ryzhov, L. Yilmaz, S. Buckley, and J. A. Miller, eds. MODELING CONSTRUCTION MANUFACTURING PROCESSES USING FORESIGHT Ian
Civil Engineering and Architecture Detailed and Performance Objective Outline
 Civil Engineering and Architecture Detailed and Performance Objective Outline Unit 1: History of Civil Engineering and Architecture (21 Total Days) Lesson 1.1: History of Civil Engineering and Architecture
THE IMPORTANCE OF PLANNING DURING PROJECT EXECUTION
 THE IMPORTANCE OF PLANNING DURING PROJECT EXECUTION A BASIS White Paper by Dr. Dan Patterson, PMP Introduction Twenty-five years ago, I was taught that project management was built upon the premise of
Microsoft Excel or Microsoft Project? Why Microsoft Office Project 2007 is Easier and More Effective for Managing Projects
 Microsoft Excel or Microsoft Project? Why Microsoft Office Project 2007 is Easier and More Effective for Managing Projects Summary: Using the right tool gives project managers a distinct advantage when
Project Time Management
 Project Time Management Project Time Management Project Time Management includes the processes required to manage timely completion of the project. Plan schedule management The process of establishing
Your easy, colorful, SEE-HOW guide! Plain&Simple. Microsoft Project Ben Howard
 Your easy, colorful, SEE-HOW guide! Plain&Simple Microsoft Project 03 Ben Howard Published with the authorization of Microsoft Corporation by O Reilly Media, Inc. 005 Gravenstein Highway North Sebastopol,
Project Planning & Control Prof. Koshy Varghese Department of Civil Engineering Indian Institute of Technology, Madras
 Project Planning & Control Prof. Koshy Varghese Department of Civil Engineering Indian Institute of Technology, Madras Lecture 10 Lesson 04 Gantt / Bar Chart History, Representation Progress Monitoring,
THE IMPORTANCE OF PLANNING DURING PROJECT EXECUTION
 THE IMPORTANCE OF PLANNING DURING PROJECT EXECUTION Dr. Dan Patterson, PMP Chief Design Officer, PLANNING & SCHEDULING Introduction Twenty-five years ago, I was taught that project management was built
Unit 3: Traditional Project Delivery Using IT Applications
 Unit 3: Traditional Project Delivery Using IT Applications 3.1 Construction Project Process Flow i. In a typical construction project, the major key to its success hinges on how well the project process
SECTION CONSTRUCTION PROGRESS DOCUMENTATION
 SECTION 01 32 00 CONSTRUCTION PROGRESS DOCUMENTATION PART 1 - GENERAL 1.1 RELATED DOCUMENTS A. Drawings and general provisions of the Contract, including General and Supplementary Conditions and other
Chapter 3 Managing Systems Projects
 Chapter 3 Managing Systems Projects Harry J. Rosenblatt. (2014). Systems Analysis and Design, 10 th Edition, International Edition. Course Technology, Cengage Learning. Modified by Nichnan K., 2013 Systems
Civil Engineering and Architecture Detailed and Performance Objective Outline
 Civil Engineering and Architecture Detailed and Performance Objective Outline Deadlines Unit 1: 11 Blocks 1/20/2015 Unit 2: 27 Blocks 2/27/2015 Unit 3: 28 Blocks 4/15/2015 Unit 4: 17 Blocks 5/8/2015 Unit
Principles of Schedule Contingency Management
 Principles of Schedule Contingency Management Ted Douglas, CCC, PSP ACTPMA, LLC Consulting 2014 Construction CPM Conference Orlando, Florida Schedule Contingency Management Background Outline of Presentation
Exposition Metro Line Construction Authority CRITICAL PATH METHOD SCHEDULE AND COST/SCHEDULE INTEGRATION SYSTEM
 SECTION 01310 CRITICAL PATH METHOD SCHEDULE AND COST/SCHEDULE INTEGRATION SYSTEM 1.0 General 1.1 Description The Work specified in this Section consists of developing and maintaining a Critical Path Method
Planning & Scheduling CSTM 102
 Planning & Scheduling CSTM 102 Items Big A Project on Website Thursday Discuss Big A Project next Tuesday April 18, 2011 CPM Scheduling You were the successful bidder! What s next? Procurement/Buy
Estimating Project Schedule-Time and Cost
 Estimating Project Schedule-Time and Cost Chapter 5 5 1 Where We Are Now 5 2 1 Overview Seminar Agenda What is involved in schedule and cost management? In-depth Determining the sequence of activities
Mastering Microsoft Project 2010
 Course 50413B: Mastering Microsoft Project 2010 Page 1 of 10 Mastering Microsoft Project 2010 Course 50413B: 2 days; Instructor-Led About this Course This two-day instructor-led course provides students
Analysis I: 4D CAD Analysis
 Analysis I: 4D CAD Analysis Background Combining 3D CAD elements with the schedule of the project produces an image that aids in visualizing the schedule, determining any inconsistencies in the schedule
Hydra White Paper. Scheduling technologies: Resource centric versus Task centric
 Hydra White Paper Scheduling technologies: Resource centric versus Task centric Introduction Historically all project management products have revolved around a common set of techniques to determine the
MBP1133 Project Management Framework Prepared by Dr Khairul Anuar
 MBP1133 Project Management Framework Prepared by Dr Khairul Anuar L4 Project Time Management www.notes638.wordpress.com Content 1. Scheduling 2. Common Scheduling Techniques 3. PERT 4. Network Fundamentals
East Central College
 SECTION 013200 - CONSTRUCTION PROGRESS DOCUMENTATION PART 1 - GENERAL 1.1 RELATED DOCUMENTS A. Drawings and general provisions of the Contract, including General and Supplementary Conditions and other
Schedule Module Exploration Systems Engineering, version 1.0
 Schedule Module Exploration Systems Engineering, version.0 Exploration Systems Engineering: Schedule Module Module Purpose: Schedule To understand the different types of schedules: Gantt chart, milestone
P6 Instructors Sample Presentation
 Welcome to the Eastwood Harris Pty Ltd Primavera P6 Versions 8.1 to 8.4 Professional and Optional Client 3 day training course PMI REP No 3001 Course Number PP6 Page 2 Page 4 Administration Evacuation
Week 5 Project Work Plan
 Week 5 Project Work Plan 457.657 Civil and Environmental Project Management Department of Civil and Environmental Engineering Seoul National University Prof. Seokho Chi shchi@snu.ac.kr 건설환경공학부 35 동 304
Implementing Resource Scheduling Techniques
 Implementing Resource Scheduling Techniques A Guide for Planners and Scheduler s Presented 26 th November 2009 at Park Regis Hotel, Brisbane for Tonkin Corporation Micro Planning International Asia Pacific
CONSTRUCTION PROGRESS DOCUMENTATION (SCHEDULING)
") 01 32 00 CONSTRUCTION PROGRESS DOCUMENTATION (SCHEDULING) PART 1 - GENERAL 1.1 RELATED DOCUMENTS A. Drawings and general provisions of the Contract, including General and Supplementary Conditions and other
01 32 00 CONSTRUCTION PROGRESS DOCUMENTATION (SCHEDULING) PART 1 - GENERAL 1.1 RELATED DOCUMENTS A. Drawings and general provisions of the Contract, including General and Supplementary Conditions and other
The Survey Says! Source: The Project Manager, Pinnell-Bush, Inc. Owner s say 31% of contractors do not submit monthly updates. 41% don t submit recove
 Improved Project Control Through Scheduling January 24, 2014 The Survey Says! Source: The Project Manager, Pinnell-Bush, Inc. Owner s say 31% of contractors do not submit monthly updates. 41% don t submit
PLANNING & SCHEDULING
 PLANNING & SCHEDULING 1 Planning & Scheduling Planning: Process of choosing the method and order of work Scheduling: Process of determining the interrelationship of associated timings of operations. 2
SPECIFICATIONS - DETAILED PROVISIONS Section Project Control Schedule C O N T E N T S
 SPECIFICATIONS - DETAILED PROVISIONS Section 01310 - Project Control Schedule C O N T E N T S PART 1 - SCHEDULE REQUIREMENTS PROGRESS SCHEDULE... 1 PART 2 - SUBMITTAL PROCEDURES... 2 PART 3 - DEFINITIONS...
Sunnyvale Plaza. Mid-Atlantic Region, United States. Nathan Braskey Construction Management. November 15, Technical Assignment #3
 November 15, 2013 Sunnyvale Plaza Mid-Atlantic Region, United States Nathan Braskey Construction Management FACULTY CONSULTANT: CRAIG DUBLER EXECUTIVE SUMMARY The following technical report explores several
Prepared by: Mr.M.SYED SHAHUL HAMEED CHAPTER 3 SYSTEMS PLANNING - MANAGING SYSTEMS PROJECTS
 CHAPTER 3 SYSTEMS PLANNING - MANAGING SYSTEMS PROJECTS 1 Project Management: - Is the process of planning, scheduling, monitoring and controlling and reporting upon the development of an information system.
Finally: the resource leveling feature explained May4, 12pm-1pm EST Sander Nekeman
 Finally: the resource leveling feature explained May4, 2016 @ 12pm-1pm EST Sander Nekeman In which group are you? Group 1: It s a buggy feature Group 2: Not buggy, just a huge pain Group 3: A feature I
MnDOT Project Management Office Presents: Impact Schedules. Presenter: Jonathan McNatty Senior Schedule Consultant DRMcNatty & Associates, Inc.
 MnDOT Project Management Office Presents: Impact Schedules Presenter: Jonathan McNatty Senior Schedule Consultant DRMcNatty & Associates, Inc. Housekeeping Items Lines will be muted during the webinar
Repetitive construction processes scheduling using mixed-integer linear programming
 Budownictwo i Architektura 14(2) (2015) 55-61 Repetitive construction processes scheduling using mixed-integer linear programming Piotr Jaśkowski Katedra Inżynierii Procesów Budowlanych, Wydział Budownictwa
Welcome to the Eastwood Harris Pty Ltd PRINCE2 TM Revised 2009 and Microsoft Project 2010 training course
 Welcome to the Eastwood Harris Pty Ltd PRINCE2 TM Revised 2009 and Microsoft Project 2010 training course Administration Evacuation Timings, meals and facilities Mobile phones and emails Introductions
MBH1123 Project Scope, Time and Cost Management Prepared by Dr Khairul Anuar. Lecture 6b Project Time Management - II
 MBH1123 Project Scope, Time and Cost Management Prepared by Dr Khairul Anuar Lecture 6b Project Time Management - II MBP1123 Scope, Time & Cost Management Prepared by Dr. Zohreh Content 1. Introduction
Week 5 Project Work Plan
 Week 5 Project Work Plan 457.307 Construction Planning and Management Department of Civil and Environmental Engineering Seoul National University Prof. Seokho Chi shchi@snu.ac.kr 건설환경공학부 35 동 304 호 Project
Project Forecast Survey Results Good Scheduling Practices June 2016
 Good Scheduling Practices 5 June 6 Good Scheduling Practices 5 June 6 Executive Summary There is a saying failing to plan is planning to fail, but what if the plan itself is a failure? The scheduling of
Contrasting Project Production Control With Project Controls
 Contrasting Project Production Control With Project Controls Roberto J. Arbulu, M.Eng. 1*, H. J. James Choo, PhD 2 and Mike Williams, PhD, P.E. 3 1 Vice President of Technical Services, Strategic Project
Chapter 5 Project Scheduling. (Source: Pressman, R. Software Engineering: A Practitioner s Approach. McGraw-Hill,
 Chapter 5 Project Scheduling (Source: Pressman, R. Software Engineering: A Practitioner s Approach. McGraw-Hill, Project Scheduling Project Scheduling Project Scheduling important task to completed in
SECTION CONSTRUCTION PROGRESS DOCUMENTATION SECTION CONSTRUCTION PROGRESS DOCUMENTATION
 PART 1 GENERAL 1.01 SECTION INCLUDES A. Preliminary schedule. SECTION 01 32 00 SECTION 01 32 00 B. Construction progress schedule, with network analysis diagrams and reports. C. Daily construction reports.
CHAPTER 1 INTRODUCTION
 1 CHAPTER 1 INTRODUCTION 1.1 MANUFACTURING SYSTEM Manufacturing, a branch of industry, is the application of tools and processes for the transformation of raw materials into finished products. The manufacturing
International Association of Certified Practicing Engineers
 www.iacpe.com Knowledge, Certification, Networking Page: 1 71 IACPE No 19, Jalan Bilal Mahmood 80100 Johor Bahru Malaysia The International is providing the introduction to the Training Module for your
Become a PowerPoint Guru [Sample Chapters]
![Become a PowerPoint Guru [Sample Chapters]](/thumbs/73/68573509.jpg "Become a PowerPoint Guru [Sample Chapters]") Become a PowerPoint Guru [Sample Chapters] Learn How to Create Effective Presentations By Dave Tracy dave@learnppt.com Thank you for your interest in my ebook. This PDF includes a sampling of content from
Become a PowerPoint Guru [Sample Chapters] Learn How to Create Effective Presentations By Dave Tracy dave@learnppt.com Thank you for your interest in my ebook. This PDF includes a sampling of content from
THIS ADDENDUM IS FOR THE PURPOSE OF MAKING THE FOLLOWING CHANGES OR CLARIFICATIONS:
 ADDENDUM NUMBER: TWO (2) Procurement Department Bid Office Customer Center 1 st Floor, Room 002 21 W. Church Street Jacksonville, Florida 32202 July 6, 2017 TITLE: Water/Wastewater General Construction
Introduction. Project Scheduling. Morgan State University ARCH 738: REAL ESTATE PROJECT MANAGEMENT. Jason E. Charalambides, PhD, M.
 Project Scheduling ARCH 738: REAL ESTATE PROJECT MANAGEMENT Morgan State University Jason E. Charalambides, PhD, M.ASCE, AIA, ENV_SP (This material has been prepared for educational purposes) Introduction
James M. Bolin and Andrew Avalon, P.E., PSP
 James M. Bolin and Andrew Avalon, P.E., PSP LONG INTERNATIONAL Long International, Inc. 5265 Skytrail Drive Littleton, Colorado 80123-1566 USA Telephone: (303) 972-2443 Fax: (303) 200-7180 www.long-intl.com
EVALUATION COPY. Unauthorized Reproduction or Distribution Prohibited THE OCCASIONAL PROJECT MANAGER
 THE OCCASIONAL PROJECT MANAGER 2016 by Systemation. ALL RIGHTS RESERVED. No part of this book may be reproduced or transmitted in any form or by any means, electronic or mechanical, including photocopying
Imagine this: If you create a hundred tasks and leave their default constraints
 Chapter 6 Timing Is Everything In This Chapter Discovering how dependency links affect timing Reviewing the different kinds of dependency relationships Allowing for lag and lead time Creating dependency
Scheduling Resources and Costs
 Student Version CHAPTER EIGHT Scheduling Resources and Costs McGraw-Hill/Irwin Copyright 2011 by The McGraw-Hill Companies, Inc. All rights reserved. Gannt Chart Developed by Henry Gannt in 1916 is used
Analysis 1: Project Sequencing. Analysis 2: MEP Prefabrication. Analysis 3: Green Roof Implementation. Analysis 4: Alternate Delivery Method
 The purpose of this proposal is to outline four construction analyses and two breadth studies that will be explored in an effort to provide feasible solutions to increase the success of the Mary J. Drexel
Civil Engineering and Architecture TEKS/LINKS Student Objectives One Credit
 First Six Weeks History of Civil Architect CEA 1.1(A) The student will connect modern structural and architectural designs to historical architectural and civil engineering achievements. CEA 1.1(B) The
Step 1 Preliminary Design and Engineering
 The Austin Company offers a variety of approaches in implementing a project. These generally can be classified into either a design-bid-construct or design-build project approach. In addition, Austin offers
Industrial Engineering Prof. Inderdeep Singh Department of Mechanical and Industrial Engineering Indian Institute of Technology, Roorkee
 Industrial Engineering Prof. Inderdeep Singh Department of Mechanical and Industrial Engineering Indian Institute of Technology, Roorkee Module - 04 Lecture - 04 Sales Forecasting I A very warm welcome
CHAPTER 1 INTRODUCTION
 1 CHAPTER 1 INTRODUCTION 1.1 GENERAL Planning and Scheduling of construction projects has always been a significant factor determining the successful completion of a project due to competition, time, space
LINEAR PROJECT SOFTWARE IMPROVING SCHEDULING OUTCOMES USING TIME LOCATION CHARTING
 IMPROVING SCHEDULING OUTCOMES USING TIME LOCATION CHARTING January 20-23 2019 San Diego, USA Overview Outcomes Gain understanding of Time Location charts Demonstration of a practical application Realise
The Project Planning Process Group
 3 The Project Planning Process Group............................................... Terms you ll need to understand: Activity Activity attributes Activity list Activity on arrow diagram (AOA) Activity