Chapter 5 Introduction to Statistical Quality Control, 7th Edition by Douglas C. Montgomery. Copyright (c) 2012 John Wiley & Sons, Inc.
|
|
|
- Helen Holland
- 6 years ago
- Views:
Transcription
1 1
2 Learning Objectives 2
3 Basic SPC Tools 3
4 5.2 Chance and Assignable Causes of Variation A process is operating with only chance causes of variation present is said to be in statistical control. A process that is operating in the presence of assignable causes is said to be out of control. 4
5 5.3 Statistical Basis of the Control Chart A control chart contains A center line An upper control limit A lower control limit A point that plots within the control limits indicates the process is in control No action is necessary A point that plots outside the control limits is evidence that the process is out of control Investigation and corrective action are required to find and eliminate assignable cause(s) There is a close connection between control charts and hypothesis testing 5
6 Photolithography Example Important quality characteristic in hard bake is resist flow width Process is monitored by average flow width Sample of 5 wafers Process mean is 1.5 microns Process standard deviation is 0.15 microns Note that all plotted points fall inside the control limits Process is considered to be in statistical control 6
7 Determination of the Control Limits 7
8 Shewhart Control Chart Model 8
9 How the Shewhart Control Chart Works 9
10 10
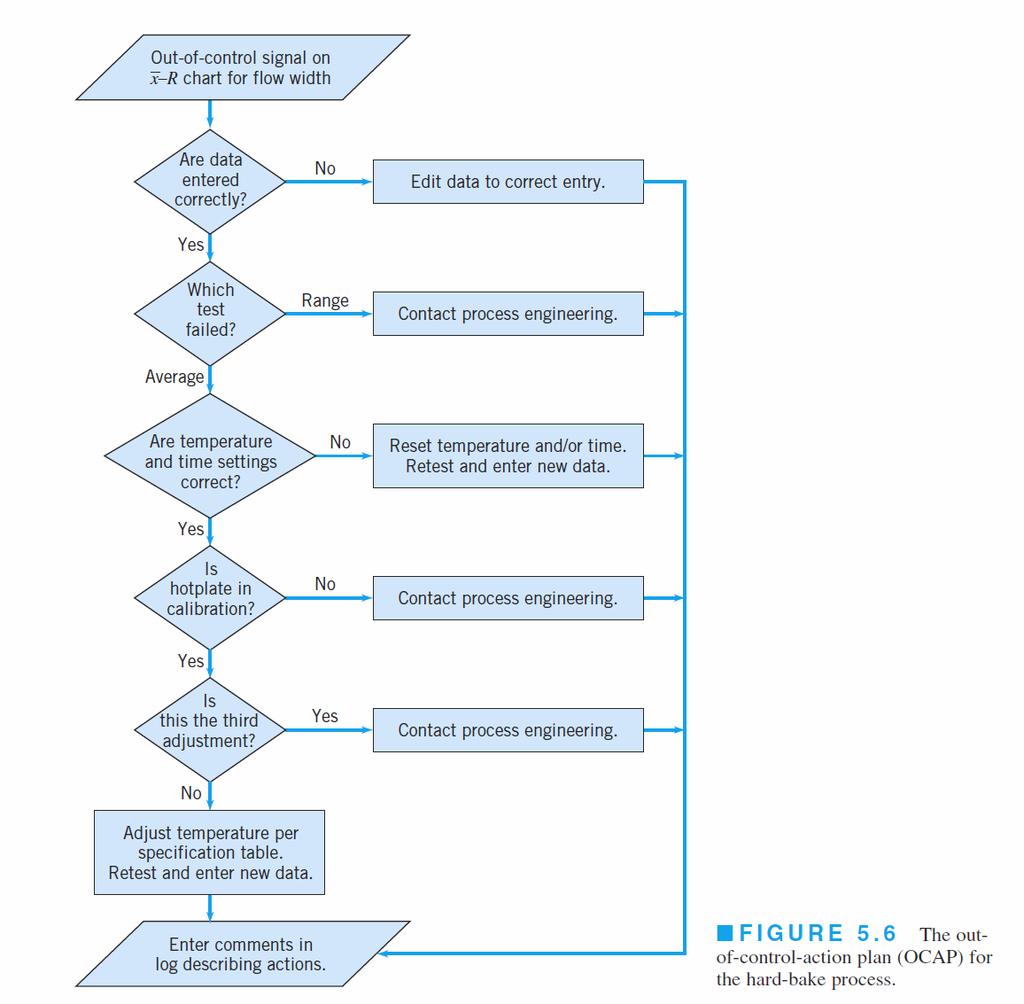
11 Out-Of-Control-Action Plans 11
12 More Basic Principles Control charts may be used to estimate process parameters, which are used to determine capability Two general types of control charts Variables (Chapter 6) Continuous scale of measurement Quality characteristic described by central tendency and a measure of variability Attributes (Chapter 7) Conforming/nonconforming Counts Control chart design encompasses selection of sample size, control limits, and sampling frequency 12

13 Types of Process Variability Stationary and uncorrelated data vary around a fixed mean in a stable or predictable manner Stationary and autocorrelated successive observations are dependent with tendency to move in long runs on either side of mean Nonstationary process drifts without any sense of a stable or fixed mean 13
14 Reasons for Popularity of Control Charts 1. Control charts are a proven technique for improving productivity. 2. Control charts are effective in defect prevention. 3. Control charts prevent unnecessary process adjustment. 4. Control charts provide diagnostic information. 5. Control charts provide information about process capability. 14

15 3-Sigma Control Limits Probability of type I error is Probability Limits Type I error probability is chosen directly For example, gives 3.09-sigma control limits Warning Limits Typically selected as 2-sigma limits 15
16 5.3.3 Sample Size and Sampling Frequency 16
17 17
18 18
19 19
20 20
21 21
22 22
23 5.3.4 Rational Subgroups The rational subgroup concept means that subgroups or samples should be selected so that if assignable causes are present, chance for differences between subgroups will be maximized, while chance for difference due to assignable causes within a subgroup will be minimized. Two general approaches for constructing rational subgroups: 1. Sample consists of units produced at the same time consecutive units Primary purpose is to detect process shifts 2. Sample consists of units that are representative of all units produced since last sample random sample of all process output over sampling interval Often used to make decisions about acceptance of product Effective at detecting shifts to out-of-control state and back into in-control state between samples Care must be taken because we can often make any process appear to be in statistical control just by stretching out the interval between observations in the sample. 23
24 Rational Subgroups 24
25 5.3.5 Patterns on Control Charts Pattern is very nonrandom in appearance 19 of 25 points plot below the center line, while only 6 plot above Following 4 th point, 5 points in a row increase in magnitude, a run up There is also an unusually long run down beginning with 18 th point 25
26 The Cyclic Pattern 26
27 27

28 5.3.6 Discussion of the Sensitizing Rules 28
29 See Champ and Woodall (1987) 29
30 30
31 4.3.7 Phase I and Phase II of Control Chart Application Phase I is a retrospective analysis of process data to construct trial control limits Charts are effective at detecting large, sustained shifts in process parameters, outliers, measurement errors, data entry errors, etc. Facilitates identification and removal of assignable causes In phase II, the control chart is used to monitor the process Process is assumed to be reasonably stable Emphasis is on process monitoring, not on bringing an unruly process into control 31
32 5.4 THE REST OF THE MAGNIFICENT SEVEN 1. Histogram or stem-and-leaf plot 2. Check sheet 3. Pareto chart 4. Cause-and-effect diagram 5. Defect concentration diagram 6. Scatter diagram 7. Control chart 32
33 Check Sheet 33
34 Pareto Chart 34
35 35
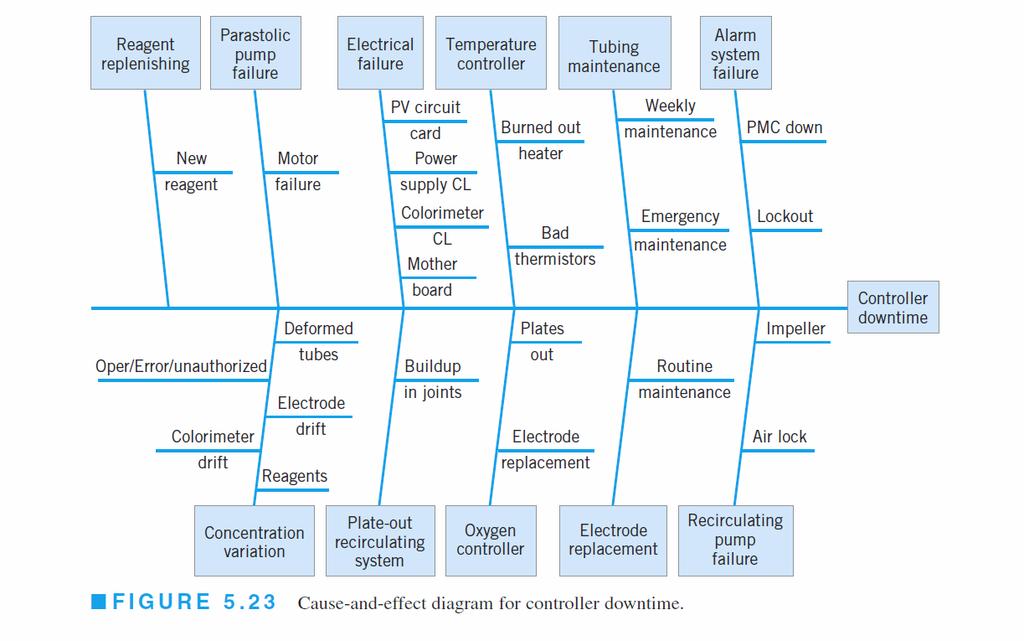
36 Cause-and-Effect Diagram 36
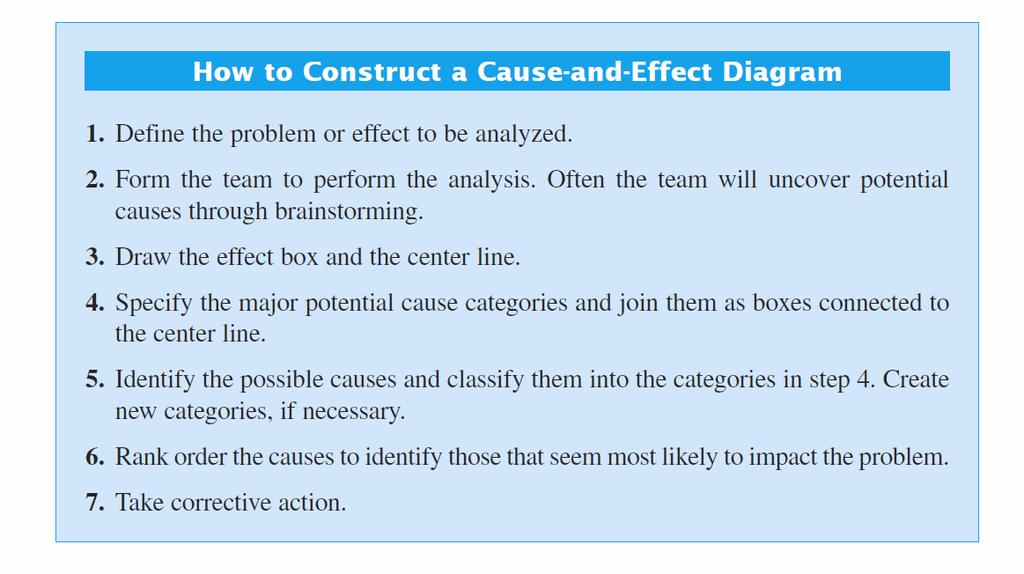
37 37
38 Defect Concentration Diagram 38
39 Scatter Diagram 39

40 5.5 Implementing SPC in a Quality Improvement Program 40
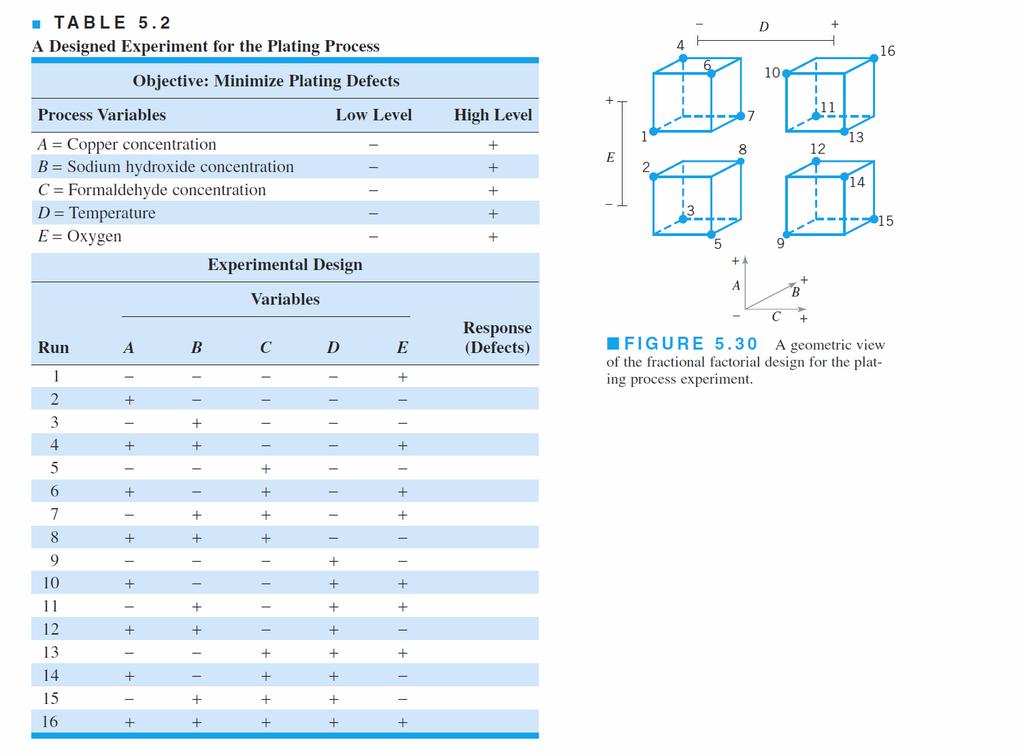
41 5.6 An Application of SPC Improving quality in a copper plating operation at a printed circuit board fabrication plant The DMAIC process was used During the define step, the team decided to focus on reducing flow time through the process During the measures step, controller downtown was recognized as a major factor in excessive flow time 41
42 42
43 43
44 44
45 45
46 46
47 47
48 48
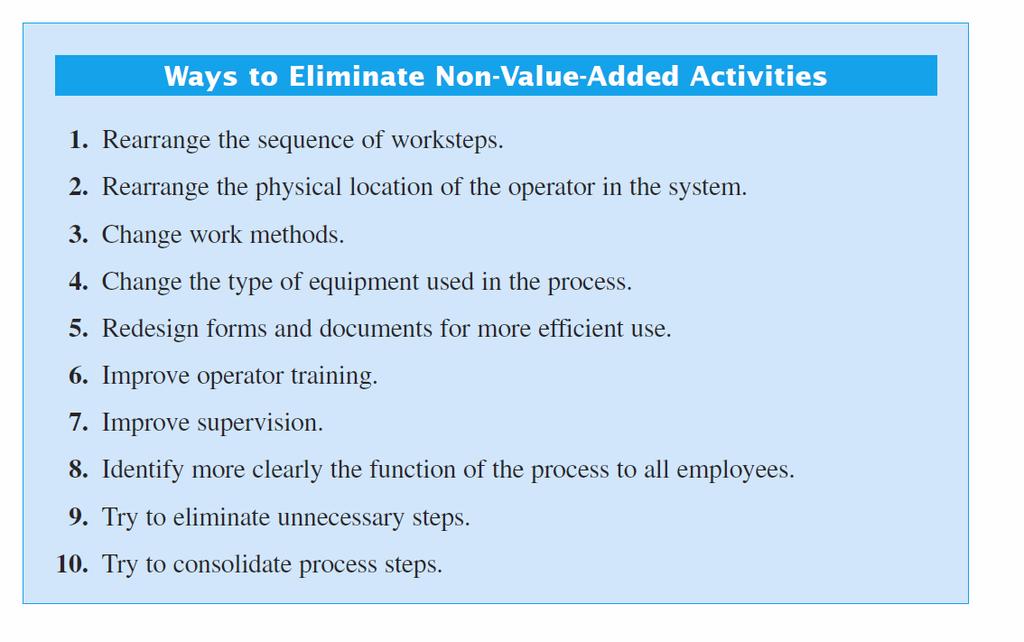
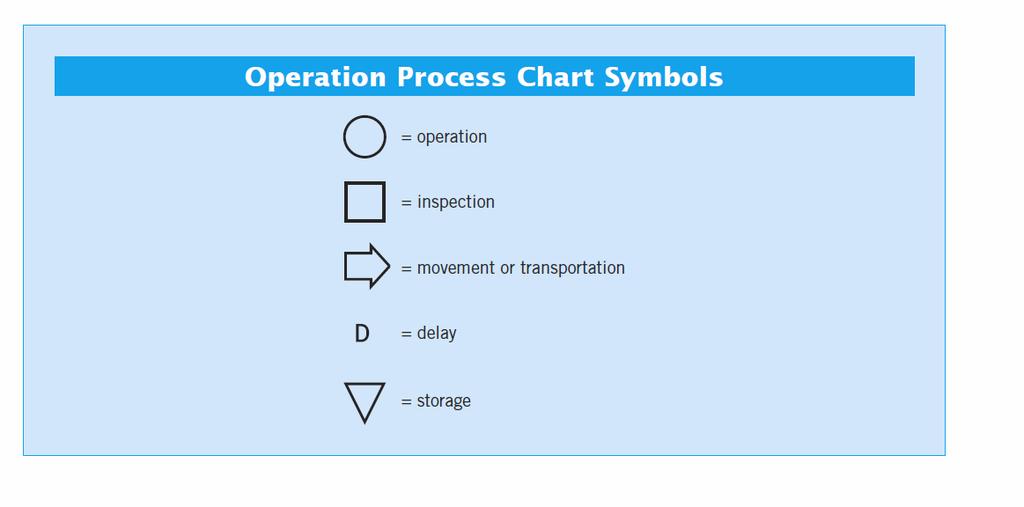
49 5.7 Applications of SPC and Quality Improvement Tools in Transactional and Service Businesses Nonmanufacturing applications often do not differ substantially from industrial applications, but sometimes require ingenuity 1. Most nonmanufacturing operations do not have a natural measurement system 2. The observability of the process may be fairly low 3. People are usually involved in transactional and services processes, and variability between people may be an important part of the problem Flow charts, operation process charts and value stream mapping are particularly useful in developing process definition and process understanding. This is sometimes called process mapping. Used to identify value-added versus nonvalue-added activity 49
50 50
51 51
52 52

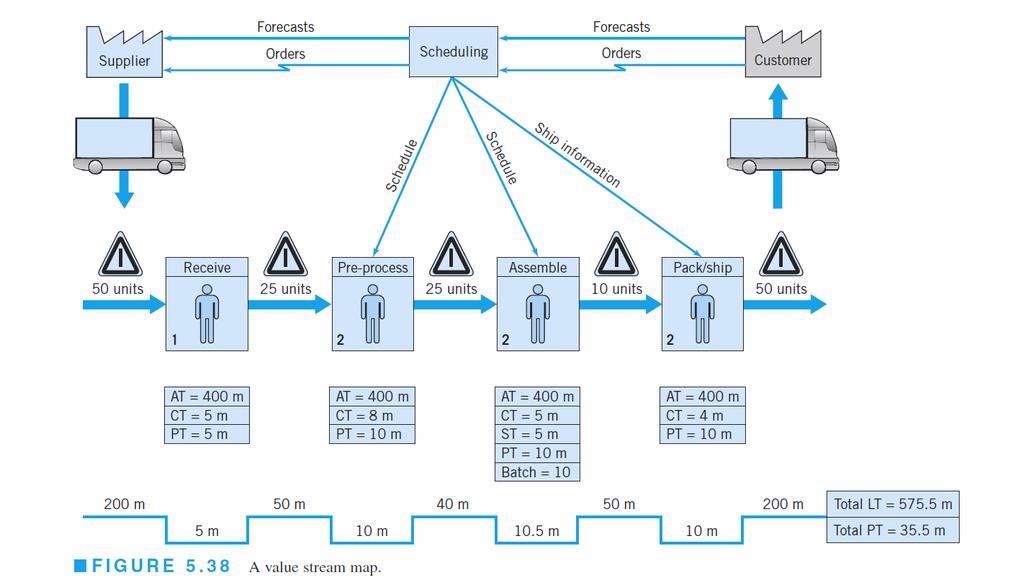
53 Value Stream Mapping 53
54 54
55 55
56 56
57 Transactional and Service Businesses All of the quality improvement tools can be used, including designed experiments Sometimes a simulation model if the process is useful More likely to encounter attribute data Lots of the continuous data may not be normally distributed (such as cycle time) Non-normality isn t a big problem, because many techniques are relatively insensitive to the normality assumption Transformations and nonparametric methods could be used if the problem is severe enough 57

58 Consider a regression model on y = cycle time to process a claim in an insurance company: 58
59 59
Introduction to Statistical Quality Control, 5 th edition Douglas C. Montgomery
 کنترل کیفیت آماری اقتباس از: Introduction to Statistical Quality Control, 5 th edition Douglas C. Montgomery دکتر محمد صالح اولیاء دانشکده مهندسی صنایع دانشگاه یزد روش و 4 فلسفه کنترل فرایند آماری فهرست
Lecture Notes on Statistical Quality Control
 STATISTICAL QUALITY CONTROL: The field of statistical quality control can be broadly defined as those statistical and engineering methods that are used in measuring, monitoring, controlling, and improving
STAT 2300: Unit 1 Learning Objectives Spring 2019
 STAT 2300: Unit 1 Learning Objectives Spring 2019 Unit tests are written to evaluate student comprehension, acquisition, and synthesis of these skills. The problems listed as Assigned MyStatLab Problems
Statistical Process Control
 FH MAINZ MSC. INTERNATIONAL BUSINESS Statistical Process Control Application of Classical Shewhart Control Charts February Amelia Curry Matrikel-Nr.: 903738 Prepared for: Prof. Daniel Porath Due Date:
Chapter 1. Introduction
 Chapter 1 Introduction INTRODUCTION 1.1 Introduction Statistics and statisticians can throw more light on an issue than a committee. of experts for making decisions on real life problems. Professor C.
DOWNLOAD PDF MANUAL ON PRESENTATION OF DATA AND CONTROL CHART ANALYSIS
 Chapter 1 : ASTM manual on presentation of data and control chart analysis ( edition) Open Library tis Atmh s Manual on Presentation of Data and Control Chart Analysis is the ninth edition of the Astm
Chapter 4 Exercise Solutions
 Several exercises in this chapter differ from those in the 4 th edition. An * following the exercise number indicates that the description has changed. New exercises are denoted with an. A second exercise
FUNDAMENTALS OF QUALITY CONTROL AND IMPROVEMENT. Fourth Edition. AMITAVA MITRA Auburn University College of Business Auburn, Alabama.
 FUNDAMENTALS OF QUALITY CONTROL AND IMPROVEMENT Fourth Edition AMITAVA MITRA Auburn University College of Business Auburn, Alabama WlLEY CONTENTS PREFACE ABOUT THE COMPANION WEBSITE PART I PHILOSOPHY AND
Online Student Guide Types of Control Charts
 Online Student Guide Types of Control Charts OpusWorks 2016, All Rights Reserved 1 Table of Contents LEARNING OBJECTIVES... 4 INTRODUCTION... 4 DETECTION VS. PREVENTION... 5 CONTROL CHART UTILIZATION...
Six Sigma Black Belt Study Guides
 Six Sigma Black Belt Study Guides 1 www.pmtutor.org Powered by POeT Solvers Limited. Overview of Six Sigma DMAIC Define Define the project targets and customer (internal and external) deliverables. Measure
Quantitative Methods. Presenting Data in Tables and Charts. Basic Business Statistics, 10e 2006 Prentice-Hall, Inc. Chap 2-1
 Quantitative Methods Presenting Data in Tables and Charts Basic Business Statistics, 10e 2006 Prentice-Hall, Inc. Chap 2-1 Learning Objectives In this chapter you learn: To develop tables and charts for
Statistics Quality: Control - Statistical Process Control and Using Control Charts
 Statistics Quality: Control - Statistical Process Control and Using Control Charts Processes Processing an application for admission to a university and deciding whether or not to admit the student. Reviewing
SELECTED APPLICATIONS OF STATISTICAL PROCESS CONTROL IN METALLURGY. Darja NOSKIEVIČOVÁ
 SELECTED APPLICATIONS OF STATISTICAL PROCESS CONTROL IN METALLURGY Abstract Darja NOSKIEVIČOVÁ FMMI, VŠB-TU Ostrava, 17. listopadu 15, 708 33 Ostrava Poruba, Czech Republic, darja.noskievicova@vsb.cz Statistical
FUNDAMENTALS OF QUALITY CONTROL AND IMPROVEMENT
 FUNDAMENTALS OF QUALITY CONTROL AND IMPROVEMENT Third Edition AMITAVA MITRA Auburn University College of Business Auburn, Alabama WILEY A JOHN WILEY & SONS, INC., PUBLICATION PREFACE xix PARTI PHILOSOPHY
Practice Final Exam STCC204
 Practice Final Exam STCC24 The following are the types of questions you can expect on the final exam. There are 24 questions on this practice exam, so it should give you a good indication of the length
Why Learn Statistics?
 Why Learn Statistics? So you are able to make better sense of the ubiquitous use of numbers: Business memos Business research Technical reports Technical journals Newspaper articles Magazine articles Basic
QUESTION 2 What conclusion is most correct about the Experimental Design shown here with the response in the far right column?
 QUESTION 1 When a Belt Poka-Yoke's a defect out of the process entirely then she should track the activity with a robust SPC system on the characteristic of interest in the defect as an early warning system.
Computer Science and Software Engineering University of Wisconsin - Platteville 3. Statistical Process Control
 Computer Science and Software Engineering University of Wisconsin - Platteville 3. Statistical Process Control Yan Shi SE 3730 / CS 5730 Lecture Notes Outline About Deming and Statistical Process Control
Big Data and Statistical Process Control. By Marc Schaeffers
 Big Data and Statistical Process Control By Marc Schaeffers Big Data and Statistical Process Control INTRODUCTION Companies have been applying statistical process control (SPC) techniques since 1935. SPC
Continuous Improvement Toolkit
 Continuous Improvement Toolkit Sampling Sample Population Managing Risk PDPC Pros and Cons Importance-Urgency Mapping RACI Matrix Stakeholder Analysis FMEA RAID Logs Break-even Analysis Cost Benefit Analysis
Introduction to Control Charts
 Introduction to Control Charts Highlights Control charts can help you prevent defects before they happen. The control chart tells you how the process is behaving over time. It's the process talking to
Ch. 16 Exploring, Displaying, and Examining Data
 TECH 646 Analysis of Research in Industry and Technology PART IV Analysis and Presentation of Data: Data Presentation and Description; Exploring, Displaying, and Examining Data; Hypothesis Testing; Measures
Statistics and data analysis procedures can be divided into two general categories: quantitative techniques and graphical techniques.
 http://en.wikipedia.org/wiki/seven_tools_of_quality http://deming.eng.clemson.edu/pub/tutorials/qctools/qct.htm http://en.wikipedia.org/wiki/5_whys http://en.wikipedia.org/wiki/brainstorming http://syque.com/quality_tools/toolbook/brainstorm/example.htm
Quality Control Troubleshooting Tools for the Mill Floor
 Quality Control Troubleshooting Tools for the Mill Floor John Rusty Dramm Forest Products Utilization Specialist USDA Forest Service, State & Private Forestry Forest Products Laboratory Madison, Wisconsin
I/A Series Software Statistical Process Control Package (SPCP)
") I/A Series Software Statistical Process Control Package (SPCP) The SPCP is an application software package that provides on-line displays of Statistical Process Control (SPC) charts for analysis of process
I/A Series Software Statistical Process Control Package (SPCP) The SPCP is an application software package that provides on-line displays of Statistical Process Control (SPC) charts for analysis of process
Graphical Tools - SigmaXL Version 6.1
 Graphical Tools - SigmaXL Version 6.1 Basic and Advanced (Multiple) Pareto Charts Multiple Boxplots and Dotplots EZ-Pivot/Pivot Charts Multiple Normal Probability Plots (with 95% confidence intervals to
JMP TIP SHEET FOR BUSINESS STATISTICS CENGAGE LEARNING
 JMP TIP SHEET FOR BUSINESS STATISTICS CENGAGE LEARNING INTRODUCTION JMP software provides introductory statistics in a package designed to let students visually explore data in an interactive way with
Seven Basic Quality Tools. SE 450 Software Processes & Product Metrics 1
 Seven Basic Quality Tools SE 450 Software Processes & Product Metrics 1 The Seven Basic Tools Checklists (Checksheets) Pareto Diagrams Histograms Run Charts Scatter Diagrams (Scatter Plots) Control Charts
Continuous Improvement Toolkit. Graphical Analysis. Continuous Improvement Toolkit.
 Continuous Improvement Toolkit Graphical Analysis The Continuous Improvement Map Managing Risk FMEA Understanding Performance Check Sheets Data Collection PDPC RAID Log* Risk Assessment* Fault Tree Analysis
Chapter 2 Ch2.1 Organizing Qualitative Data
 Chapter 2 Ch2.1 Organizing Qualitative Data Example 1 : Identity Theft Identity fraud occurs someone else s personal information is used to open credit card accounts, apply for a job, receive benefits,
1. What is a key difference between an Affinity Diagram and other tools?
 1) AFFINITY DIAGRAM 1. What is a key difference between an Affinity Diagram and other tools? Affinity Diagram builds the hierarchy 'bottom-up', starting from the basic elements and working up, as opposed
INDUSTRIAL ENGINEERING
 1 P a g e AND OPERATION RESEARCH 1 BREAK EVEN ANALYSIS Introduction 5 Costs involved in production 5 Assumptions 5 Break- Even Point 6 Plotting Break even chart 7 Margin of safety 9 Effect of parameters
What is DMAIC? What are the tools of DMAIC?
 What is DMAIC? DMAIC is an acronym for a series of steps used to measure defects in business processes and improve profitability. It is one of two key methods used to implement Six Sigma. DMAIC stands
IE 301 Industrial Engineering laboratory LAB No.5: The seven QC tools and Acceptance sampling Instructor: Assisant.Prof. Parichat Chuenwatanakul Lab
 IE 301 Industrial Engineering laboratory LAB No.5: The seven QC tools and Acceptance sampling Instructor: Assisant.Prof. Parichat Chuenwatanakul Lab objectives: To practice using the seven QC tools to
Statistics 201 Summary of Tools and Techniques
 Statistics 201 Summary of Tools and Techniques This document summarizes the many tools and techniques that you will be exposed to in STAT 201. The details of how to do these procedures is intentionally
Sensitizing Rules for Fuzzy Control Charts
 Sensitizing Rules for Fuzzy Control Charts N. Pekin Alakoç and A. Apaydın Abstract Quality control charts indicate out of control conditions if any nonrandom pattern of the points is observed or any point
SPECIAL CONTROL CHARTS
 INDUSTIAL ENGINEEING APPLICATIONS AND PACTICES: USES ENCYCLOPEDIA SPECIAL CONTOL CHATS A. Sermet Anagun, PhD STATEMENT OF THE POBLEM Statistical Process Control (SPC) is a powerful collection of problem-solving
If you are using a survey: who will participate in your survey? Why did you decide on that? Explain
 Journal 11/13/18 If you are using a survey: who will participate in your survey? Why did you decide on that? Explain If you are not using a survey: Where will you look for information? Why did you decide
CHAPTER 2: ORGANIZING AND VISUALIZING VARIABLES
 2-1 Organizing and Visualizing Variables Organizing and Visualizing Variables 2-1 Statistics for Managers Using Microsoft Excel 8th Edition Levine SOLUTIONS MANUAL Full download at: https://testbankreal.com/download/statistics-for-managers-using-microsoftexcel-8th-edition-levine-solutions-manual/
ROADMAP. Introduction to MARSSIM. The Goal of the Roadmap
 ROADMAP Introduction to MARSSIM The Multi-Agency Radiation Survey and Site Investigation Manual (MARSSIM) provides detailed guidance for planning, implementing, and evaluating environmental and facility
Continuous Improvement Toolkit. Traffic Light Assessment. Continuous Improvement Toolkit.
 Continuous Improvement Toolkit Traffic Light Assessment The Continuous Improvement Map Managing Risk FMEA Understanding Performance Check Sheets Data Collection PDPC RAID Log* Risk Assessment* Fault Tree
Continuous Improvement Toolkit. Improvement Roadmaps. Continuous Improvement Toolkit.
 Continuous Improvement Toolkit Improvement Roadmaps 0 1 2 3 The Continuous Improvement Map Managing Risk FMEA Understanding Performance Check Sheets Data Collection PDPC RAID Log* Risk Assessment* Fault
Continuous Improvement Toolkit. Pugh Matrix. Continuous Improvement Toolkit.
 Continuous Improvement Toolkit Pugh Matrix Continuous Improvement Toolkit. www.citoolkit.com The Continuous Improvement Map Managing Risk FMEA Check Sheets** PDPC RAID Log* Risk Analysis* Fault Tree Analysis
Lean Six Sigma Green Belt Supplement
 Problem Solving and Process Improvement Tools and Techniques Guide Book Lean Six Sigma Green Belt Supplement Max Zornada, University of Adelaide Executive Education 7 th Floor, 10 Pultney Street, Adelaide,
CHAPTER 2: ORGANIZING AND VISUALIZING VARIABLES
 Organizing and Visualizing Variables 2-1 CHAPTER 2: ORGANIZING AND VISUALIZING VARIABLES SCENARIO 2-1 An insurance company evaluates many numerical variables about a person before deciding on an appropriate
CHAPTER 2: ORGANIZING AND VISUALIZING VARIABLES
 Statistics for Managers Using Microsoft Excel 8th Edition Levine Solutions Manual Full Download: http://testbanklive.com/download/statistics-for-managers-using-microsoft-excel-8th-edition-levine-solutions-manu
Assignment 5: Statistical Process Controls. Laura M Williams, RN, CLNC, MSN. IET603: Statistical Quality Assurance in Science and Technology
 Running head: WILLIAMS ASSIGNMENT Assignment : Statistical Process Controls, RN, CLNC, MSN IET60: Statistical Quality Assurance in Science and Technology Morehead State University Dr. Ahmad Zargari 8 March
Shewhart and the Probability Approach. The difference is much greater than how we compute the limits
 Quality Digest Daily, November 2, 2015 Manuscript 287 The difference is much greater than how we compute the limits Donald J. Wheeler & Henry R. Neave In theory, there is no difference between theory and
MAKING SENSE OF DATA
 MAKING SENSE OF DATA Donald J. Wheeler SPC Press Knoxville, Tennessee Contents About the Author Introduction ix xi Chapter One Why Continual Improvement? 1 1.1 What is Quality? 3 1.2 The Three Questions
Continuous Improvement Toolkit. Value Analysis
 Continuous Improvement Toolkit Value Analysis VA NVA The Continuous Improvement Map Managing Risk FMEA Understanding Performance** Check Sheets Data Collection PDPC RAID Log* Risk Analysis* Benchmarking***
Statistics, Data Analysis, and Decision Modeling
 - ' 'li* Statistics, Data Analysis, and Decision Modeling T H I R D E D I T I O N James R. Evans University of Cincinnati PEARSON Prentice Hall Upper Saddle River, New Jersey 07458 CONTENTS Preface xv
Data Analysis Boot Camp
 Data Analysis Boot Camp DATA200; 3 Days, Instructor-led Course Description Today's organizations face both a promise and a dilemma. The growth in availability and quantity of data, as well as the tools
An ordered array is an arrangement of data in either ascending or descending order.
 2.1 Ordered Array An ordered array is an arrangement of data in either ascending or descending order. Example 1 People across Hong Kong participate in various walks to raise funds for charity. Recently,
Design of Experiments (DOE) Instructor: Thomas Oesterle
 Instructor: Thomas Oesterle") 1 Design of Experiments (DOE) Instructor: Thomas Oesterle 2 Instructor Thomas Oesterle thomas.oest@gmail.com 3 Agenda Introduction Planning the Experiment Selecting a Design Matrix Analyzing the Data Modeling
1 Design of Experiments (DOE) Instructor: Thomas Oesterle 2 Instructor Thomas Oesterle thomas.oest@gmail.com 3 Agenda Introduction Planning the Experiment Selecting a Design Matrix Analyzing the Data Modeling
The Role of Continuous Improvement in Health Care
 The Role of Continuous Improvement in Health Care Eduardo Santiago, Ph.D. Minitab, Inc. State College, PA Agenda The Role of Continuous Improvement The NAE/IOM report (2005) The Role of Statistics and
Use and interpretation of statistical quality control charts
 International Journal for Quality in Health Care 1998; Volume 10, Number I: pp. 69-73 Methodology matters VIII 'Methodology Matters' is a series of intermittently appearing articles on methodology. Suggestions
Confidence Critical to Batch Release
 Confidence Critical to Batch Release Application of ASTM E2709 Standard Practice for Demonstrating Capability to Comply with a Lot Acceptance Procedure and Its Relationship to USP Standards 1 Product Research
Chapter 03 Control Charts. Process Variations and Quality
 University of Hail College of Engineering QEM 511 - Total Quality Management Chapter 03 Control Charts Prof. Mohamed Aichouni Lectures notes adapted from: PowerPoint presentation to accompany Besterfield,
Industrial Problem Solving
 Industrial Problem Solving Presented by Chris Butterworth Six Sigma Master Black Belt Chris Butterworth ASQ Certified Six Sigma Master Black Belt 30+ years experience in Manufacturing Inspector - Quality
Continuous Improvement Toolkit
 Continuous Improvement Toolkit Confidence Intervals Managing Risk PDPC Pros and Cons Importance-Urgency Mapping RACI Matrix Stakeholders Analysis FMEA RAID Logs Break-even Analysis Cost -Benefit Analysis
STAT 206: Chapter 2 (Organizing and Visualizing Variables)
") STAT 206: Chapter 2 (Organizing and Visualizing Variables) Methods to Organize and Visualize Variables For Categorical Variables: Summary Table; contingency table (2.1) Bar chart, pie chart, Pareto chart,
STAT 206: Chapter 2 (Organizing and Visualizing Variables) Methods to Organize and Visualize Variables For Categorical Variables: Summary Table; contingency table (2.1) Bar chart, pie chart, Pareto chart,
NHS Improvement An Overview of Statistical Process Control (SPC) October 2011
 October 2011") NHS Improvement An Overview of Statistical Process Control (SPC) October 2011 Statistical Process Control Charts (X, Moving R Charts) What is Statistical Process Control (SPC)? We all know that measurement
NHS Improvement An Overview of Statistical Process Control (SPC) October 2011 Statistical Process Control Charts (X, Moving R Charts) What is Statistical Process Control (SPC)? We all know that measurement
Quality Control Charts
 Quality Control Charts General Purpose In all production processes, we need to monitor the extent to which our products meet specifications. In the most general terms, there are two "enemies" of product
Pareto Charts [04-25] Finding and Displaying Critical Categories
![Pareto Charts [04-25] Finding and Displaying Critical Categories](/thumbs/72/68045074.jpg "Pareto Charts [04-25] Finding and Displaying Critical Categories") Introduction Pareto Charts [04-25] Finding and Displaying Critical Categories Introduction Pareto Charts are a very simple way to graphically show a priority breakdown among categories along some dimension/measure
Introduction Pareto Charts [04-25] Finding and Displaying Critical Categories Introduction Pareto Charts are a very simple way to graphically show a priority breakdown among categories along some dimension/measure
The Design of GLR Control Charts for Process Monitoring
 The Design of GLR Control Charts for Process Monitoring Liaosa Xu Dissertation submitted to the Faculty of the Virginia Polytechnic Institute and State University in partial fulfillment of the requirements
Continuous Improvement Toolkit
 Continuous Improvement Toolkit Regression (Introduction) Managing Risk PDPC Pros and Cons Importance-Urgency Mapping RACI Matrix Stakeholders Analysis FMEA RAID Logs Break-even Analysis Cost -Benefit Analysis
Six Sigma Dictionary
 Six Sigma Dictionary # 4M / 5M / 6M Framework for root cause brainstorming. Categorizes root causes by: Man, Methods, Machines, Material, (5M) Mother Nature and (6M) Measurement System Impact 8D Process
Business Quantitative Analysis [QU1] Examination Blueprint
![Business Quantitative Analysis [QU1] Examination Blueprint](/thumbs/94/121308410.jpg "Business Quantitative Analysis [QU1] Examination Blueprint") Business Quantitative Analysis [QU1] Examination Blueprint 2014-2015 Purpose The Business Quantitative Analysis [QU1] examination has been constructed using an examination blueprint. The blueprint, also
Business Quantitative Analysis [QU1] Examination Blueprint 2014-2015 Purpose The Business Quantitative Analysis [QU1] examination has been constructed using an examination blueprint. The blueprint, also
Project Management CTC-ITC 310 Spring 2018 Howard Rosenthal
 Project Management CTC-ITC 310 Spring 2018 Howard Rosenthal 1 Notice This course is based on and includes material from the text: A User s Manual To the PMBOK Guide Authors: Cynthia Stackpole Snyder Publisher:
The Six Sigma Practitioner s. Guide to Data Analysis
 The Six Sigma Practitioner s Guide to Data Analysis Second Edition Donald J. Wheeler Fellow of the American Statistical Association Fellow of the American Society for Quality SPC Press Knoxville, Tennessee
Continuous Improvement Toolkit. Flow Process Chart. Continuous Improvement Toolkit.
 Continuous Improvement Toolkit Flow Process Chart The Continuous Improvement Map Managing Risk FMEA Understanding Performance Check Sheets Data Collection PDPC RAID Log* Risk Assessment* Fault Tree Analysis
Super-marketing. A Data Investigation. A note to teachers:
 Super-marketing A Data Investigation A note to teachers: This is a simple data investigation requiring interpretation of data, completion of stem and leaf plots, generation of box plots and analysis of
CERTIFIED QUALITY PROCESS ANALYST BODY OF KNOWLEDGE
 CERTIFIED QUALITY PROCESS ANALYST BODY OF KNOWLEDGE Included in this body of knowledge (BOK) are explanations (subtext) and cognitive levels for each topic or subtopic in the test. These details will be
Process Performance and Quality Chapter 6
 Process Performance and Quality Chapter 6 How Process Performance and Quality fits the Operations Management Philosophy Operations As a Competitive Weapon Operations Strategy Project Management Process
Change-Point Analysis: A Powerful New Tool For Detecting Changes
 Change-Point Analysis: A Powerful New Tool For Detecting Changes WAYNE A. TAYLOR Baxter Healthcare Corporation, Round Lake, IL 60073 Change-point analysis is a powerful new tool for determining whether
Continuous Improvement Toolkit. Questionnaires. Continuous Improvement Toolkit.
 Continuous Improvement Toolkit Questionnaires The Continuous Improvement Map Managing Risk FMEA Understanding Performance Check Sheets Data Collection PDPC RAID Log* Risk Assessment* Fault Tree Analysis
Cycle Time Forecasting. Fast #NoEstimate Forecasting
 Cycle Time Forecasting Fast #NoEstimate Forecasting 15 th August 2013 Forecasts are attempts to answer questions about future events $1,234,000 Staff 2 Commercial in confidence We estimated every task
= = Intro to Statistics for the Social Sciences. Name: Lab Session: Spring, 2015, Dr. Suzanne Delaney
 Name: Intro to Statistics for the Social Sciences Lab Session: Spring, 2015, Dr. Suzanne Delaney CID Number: _ Homework #22 You have been hired as a statistical consultant by Donald who is a used car dealer
Process Performance and Quality
 Process Performance and Quality How Process Performance and Quality fits the Operations Management Philosophy Chapter 6 Operations As a Competitive Weapon Operations Strategy Project Management Process
GSU College of Business MBA Core Course Learning Outcomes. Updated 9/24/2015
 GSU College of Business MBA Core Course Learning Outcomes Updated 9/24/2015 ACCT 6100 ACCT 7101 ECON 6100 ECON 7500 FIN 7101 MIS 7101 MGMT 6100 MGMT 6700 MGMT 7400 MGMT 7500 MGMT 7600 MGMT 8900 MKTG 7100
Continuous Improvement Toolkit. Project Charter. Continuous Improvement Toolkit.
 Continuous Improvement Toolkit Project Charter The Continuous Improvement Map Managing Risk FMEA Check Sheets Data Collection PDPC RAID Log* Risk Assessment* Fault Tree Analysis Traffic Light Assessment
CH (8) Hot Topics. Quality Management
 Hot Topics. Quality Management") CH (8) Hot Topics Quality Management 1 CH ( 8 ) Quality Management 2 Introduction This knowledge area requires you to understand three processes, as described in the book PMP : Plan Quality Management,
CH (8) Hot Topics Quality Management 1 CH ( 8 ) Quality Management 2 Introduction This knowledge area requires you to understand three processes, as described in the book PMP : Plan Quality Management,
HIMSS ME-PI Community. Quick Tour. Sigma Score Calculation Worksheet INSTRUCTIONS
 HIMSS ME-PI Community Sigma Score Calculation Worksheet INSTRUCTIONS Quick Tour Let s start with a quick tour of the Excel spreadsheet. There are six worksheets in the spreadsheet. Sigma Score (Snapshot)
Displaying Bivariate Numerical Data
 Price ($ 000's) OPIM 303, Managerial Statistics H Guy Williams, 2006 Displaying Bivariate Numerical Data 250.000 Price / Square Footage 200.000 150.000 100.000 50.000 - - 500 1,000 1,500 2,000 2,500 3,000
Continuous Improvement Toolkit. Standard Work. Continuous Improvement Toolkit.
 Continuous Improvement Toolkit Standard Work The Continuous Improvement Map Managing Risk FMEA Understanding Performance** Check Sheets Data Collection PDPC RAID Log* Risk Analysis* Benchmarking*** Interviews
Math 1 Variable Manipulation Part 8 Working with Data
 Name: Math 1 Variable Manipulation Part 8 Working with Data Date: 1 INTERPRETING DATA USING NUMBER LINE PLOTS Data can be represented in various visual forms including dot plots, histograms, and box plots.
Math 1 Variable Manipulation Part 8 Working with Data
 Math 1 Variable Manipulation Part 8 Working with Data 1 INTERPRETING DATA USING NUMBER LINE PLOTS Data can be represented in various visual forms including dot plots, histograms, and box plots. Suppose
CHAPTER 2. Shewhart control charts and its application. for rare events in healthcare
 CHAPTER 2 Shewhart control charts and its application for rare events in healthcare The control charts considered in this chapter are those that are described in introductory text books on statistical
Continuous Improvement Toolkit. Risk Analysis. Continuous Improvement Toolkit.
 Continuous Improvement Toolkit Risk Analysis The Continuous Improvement Map Managing Risk FMEA Understanding Performance Check Sheets Data Collection PDPC RAID Log* Risk Analysis* Fault Tree Analysis Traffic
Overview. Presenter: Bill Cheney. Audience: Clinical Laboratory Professionals. Field Guide To Statistics for Blood Bankers
 Field Guide To Statistics for Blood Bankers A Basic Lesson in Understanding Data and P.A.C.E. Program: 605-022-09 Presenter: Bill Cheney Audience: Clinical Laboratory Professionals Overview Statistics
Business Statistics: A Decision-Making Approach 7 th Edition
 Business Statistics: A Decision-Making Approach 7 th Edition Chapter 2 Graphs, Charts, and Tables Describing Your Data Business Statistics: A Decision-Making Approach, 7e 2008 Prentice-Hall, Inc. Chap
2. List 5 processes of the Executing Process Group. (15)
") CSC 310 Program Management California State University Dominguez Hills Spring 2017 Instructor: Howard Rosenthal Assignment 3b Chapter 3 What Are The Project Management Process Groups The answers to these
CSC 310 Program Management California State University Dominguez Hills Spring 2017 Instructor: Howard Rosenthal Assignment 3b Chapter 3 What Are The Project Management Process Groups The answers to these
Application of statistical tools and techniques in Quality Management
 Application of statistical tools and techniques in Quality Management Asst. Professor Dr Predrag Djordjevic University of Belgrade, Technical Faculty in Bor, Serbia QUALITY IN SOCIETY The concept was known
Process Capability Studies
 Definition The quality of a production process is subject to certain fluctuations. What are known as capability indexes are calculated so that these processes can be assessed, with a broad distinction
Methodology of Fault Diagnosis in Ductile Iron Melting Process
 A R C H I V E S of F O U N D R Y E N G I N E E R I N G Published quarterly as the organ of the Foundry Commission of the Polish Academy of Sciences ISSN (897-) Volume 6 Issue /6 8 9/ Methodology of Fault
Data Visualization. Prof.Sushila Aghav-Palwe
 Data Visualization By Prof.Sushila Aghav-Palwe Importance of Graphs in BI Business intelligence or BI is a technology-driven process that aims at collecting data and analyze it to extract actionable insights
Daniel Y. Peng, Ph.D.
 Using Control Charts to Evaluate Process Variability Daniel Y. Peng, Ph.D. Quality Assessment Lead Office of Process and Facility (OPF) OPQ/CDER/FDA PQRI 205 Annual Meeting North Bethesda, Maryland October
Statistical Process Control Charts for Measuring and Monitoring Temporal Consistency of Ratings
 Journal of Educational Measurement Spring 21, Vol. 47, No. 1, pp. 18 35 Statistical Process Control Charts for Measuring and Monitoring Temporal Consistency of Ratings M. Hafidz Omar King Fahd University
Continuous Improvement Toolkit. QFD (Quality Function Deployment) Continuous Improvement Toolkit.
 Continuous Improvement Toolkit.") Continuous Improvement Toolkit QFD (Quality Function Deployment) The Continuous Improvement Map Managing Risk FMEA Understanding Performance Check Sheets Data Collection PDPC RAID Log* Risk Assessment*
Continuous Improvement Toolkit QFD (Quality Function Deployment) The Continuous Improvement Map Managing Risk FMEA Understanding Performance Check Sheets Data Collection PDPC RAID Log* Risk Assessment*
Project Quality Management. Prof. Dr. Daning Hu Department of Informatics University of Zurich
 Project Quality Management Prof. Dr. Daning Hu Department of Informatics University of Zurich Learning Objectives Define project quality management and understand how quality relates to various aspects