THE INFORMAL SECTOR AND INFORMAL EMPLOYMENT IN INDONESIA
|
|
|
- Herbert Davis
- 6 years ago
- Views:
Transcription


1 COUNTRY REPORT THE INFORMAL SECTOR AND INFORMAL EMPLOYMENT IN INDONESIA BPS-STASTICS INDONESIA 2010 Measuring the Informal Sector in Indonesia 1
2 FOREWORD Many studies have shown that the informal sector and informal employment continue to be a large and even growing component of the economies of developing countries. It is estimated that employment in the informal sector is over 50 percent of non-agricultural employment and nearly 30 percent of non-agricultural gross domestic product (GDP) in Asia. In Indonesia, 70 percent of the workforce was estimated be engaged in informal employment, mostly in the agriculture sector (Firdausy, 2000). This was an immediate result of the 1997 Asian financial crisis which saw a decline in the number of workers from the urban areas and industrial sector against a concomitant increase in the number of workers in the rural areas and agriculture sector. Statistics Indonesia (BPS) estimated informal employment to be about 64 percent in 2006 and the share of small enterprises (that seem to be mostly informal) to the GDP output to be roughly 38 percent. While it is perceived that the informal sector contributes significantly in Indonesia s economy, particularly in terms of employment by providing economic opportunities to those displaced from or who cannot be absorbed by the formal sector, informal sector and informal employment statistics have not been regularly collected and have not been included in Indonesia s official labor force statistics. For government and policy makers to be able to find ways of improving the conditions of those under informal employment and promoting decent work for all, it is necessary to measure this sector and incorporate in the set of official statistics data on informal sector and informal employment. However, because of the very nature of the informal production units, they are difficult to locate, they have high turnover and their financial accounts and assets cannot be easily separated from the households that own them, surveying them requires more effort and costs than the regular establishment or household surveys. This is perhaps the very reason why very few statistical systems in Asia have data series on the informal sector and informal employment. This report is a step towards institutionalizing the measurement of the informal sector and informal employment. It presents the results of the informal sector survey that Statistics Indonesia conducted in two pilot provinces Yogyakarta and Banten, under the Asian Development Bank s regional technical assistance, RETA 6430: Measurement of the Informal Sector in August Through the close collaboration between Statistics Indonesia and ADB, the cost effective data collection approach that was taken was able to provide reliable statistics on informal employment and in general, in estimating the contribution of the informal sector to the gross domestic product. This project also provided insights on how the informal sector survey should be enhanced to give better estimates and for institutionalization purposes. It is our hope that with the techniques that were learned from this project, Statistics Indonesia will be able to conduct the informal sector survey in all the provinces periodically to support in-depth study of the informal sector and informal employment. Jakarta, May 2010
3 TABLE OF CONTENTS FOREWORD 2 TABLE OF CONTENTS 3 GLOSSARY 4 LIST OF TABLES 5 LIST OF FIGURES 7 LIST OF APPENDIX 8 CHAPTER 1: INTRODUCTION Background Objectives Informal Sector Statistics in the Realm of Official Statistics Main data sources Layout of the Report 10 CHAPTER 2: EMPLOYMENT IN THE INFORMAL ECONOMY Labor Force Characteristics Jobs in the Informal Sector Persons Employed in the Informal Sector Informal Employment Industry of Economic Activity Occupation Employment Status Wages and Earnings Type of Tax Payments (for Employers and Self-Employed) Type of Enterprise Size of Establishment Legal Organization of the Enterprise Kind of Work Place Age Composition Level of Education Employment Conditions of Informal Employees Exclusion of Agriculture, Forestry and Fishing 41 CHAPTER 3: CONTRIBUTION OF THE INFORMAL SECTOR TO GDP Industry Administrative Unit and Urbanity Agriculture and Non-Agriculture Sectors Labor Productivity 46 CHAPTER 4: CHARACTERISTICS OF INFORMAL SECTOR ENTERPRISES Household Unincorporated Enterprise Producing Some Marketable Goods (HUEM) Financing and Other Support Structures Problems and Prospects 52 CHAPTER 5: INSTITUTIONALIZING INFORMAL EMPLOYMENT AND STATISTICS IN OFFICIAL STATISTICS 55 CHAPTER 6: SUMMARY AND CONCLUSIONS Summary of Main Results Importance of Measurement Informal Employment and Informal Sector Other Issues 60 CHAPTER 6: RECOMMENDATIONS 61 APPENDICES 63 REFERENCES 142 Measuring the Informal Sector in Indonesia 3
4 GLOSSARY ADB: BPS: CB: HH: HH member: Head of HH: ICLS: ILO: IS: ISS: LFS: Asian Development Bank BPS-Statistics Indonesia Census Block Household Household member Head of household International Conference of Labour Statisticians International Labour Organization Informal Sector Informal Sector Survey Labor Force Survey
5 LIST OF TABLES Table 2 Number of informal employment by province and production unit Table Total number of jobs, by activity and unit of production Table Total number of jobs, by nature of employment and activity 16 Table Percentage of employment by employment status, nature of employment and sex Table Comparison of industry classification: ISIC Rev. 3 vs Sakernas Table Nature of employment by industry and province (%) Table The structure of employment (total and informal) by province and sex Table Average wage and earnings by employment status and nature of employment Table Average wage and earnings by employment status, nature of employment, and sex Table Average wage and earnings by employment status, nature of employment, and urbanity Table Tax agency registration of registered production units and tax payments of all production units owned by own account workers and employers by urbanity Table Tax agency registration and tax payments of enterprise owned by own account workers Table 2.10 Percentage of type of enterprise and nature of employment Table Employment by type of production, nature of employment and employment size of establishment Table Employment by employment size of establishment, nature of employment and urbanity Table 2.12 Employment by legal organization, nature of employment and sex Table Employment by place of work and nature of employment Table Informal employment by place of work (excluding farm and agricultural plots) and urbanity Table Employment by urbanity and age groups Table Employment by nature of employment and age groups Table Informal employment by unit of production and age groups Table Employment by level of education and employment status Table Unpaid family workers with no education by industry Table Table Table Table Table Table Employment by level of education, employment status, and sex Employment by level of education, employment status, and nature of employment Number of wage workers who receive benefits by nature of employment and sex Percentage of wage workers who receive benefits by nature of employment and sex Informal employment by employment status, production unit and sex (excluding agriculture) Informal employment by employment status and production unit (excluding agriculture) Table 4.1 Distribution of Reasons for establishment of HUEMs, by province 49 Table Access to credit 50 Measuring the Informal Sector in Indonesia 5
6 Table Distribution of HUEMs by reason of not applying for loan by reason for loan rejection (%) 51 Table Distribution of HUEMs by impact of loan 52 Table Distribution of HUEMs by type of encountered problems (%) 52 Table Distribution of HUEMs by type of difficulties for which the organization has helped (%) 54 Table 5.1 Summary of recommendation... 57
7 LIST OF FIGURES Figure 2 Nature of employment by production unit Figure Labor force characteristics by sex: agriculture vs non-agriculture Figure Labor force characteristics by sex, nature of employment, and industry Figure 2.2 Employment by type of enterprise: primary and second job Figure 2.3 Formal and informal employment in informal enterprise by sex and province Figure Employment by type of production unit and nature of employment, and sex Figure Informal employment by production unit and province Figure Distribution of men and women engaged in informal employment Figure The structure of total employment in Yogyakarta and Banten Figure The structure of informal employment in Yogyakarta Figure The structure of informal employment in Banten Figure Employment by occupation and nature of employment in Yogyakarta Figure Employment by occupation and nature of employment in Banten Figure 2.7 Employment by employment status, nature of employment and sex Figure Percentage of jobs worked at formal/informal enterprise by type of enterprise, in Yogyakarta Figure Percentage of jobs worked at formal/informal enterprise by type of enterprise, in Banten Figure 2.12 Employment by legal organization, nature of employment and sex Figure 2.14 Employment by nature of employment and age groups Figure 2.16 Percentage of wage workers who receive benefits by nature of employment: Yogyakarta and Banten, Figure 3.1 Formal and informal contribution to GDP Figure 3.2 Contribution to GDP by sector and industry Figure 3.3 Informal sector productions in agriculture and non-agriculture sectors Figure 3.4 Labor productivity by industry in the formal and informal sectors Figure 4.1 Reasons for establishment of HUEMs (%) Figure 4.2 Types of assistance needed by HUEMs (%) Measuring the Informal Sector in Indonesia 7
8 LIST OF APPENDIX Appendix 1. Concept and Definitions Appendix 2. Cost Effective Sampling Design for the Informal Sector Appendix 3. Sampling Errors Appendix 4. Measuring Informal Employment Appendix 5. Estimating The Contibution of Informal Sector to GDP Appendix 6. List of Tables Appendix 7. Informal Sector Survey Form 1 Questionnaire: English Version Appendix 8. Informal Sector Survey Form 1 Questionnaire: Bahasa Version Appendix 9. Informal Sector Survey Form 2 Questionnaire: English Version Appendix 10. Informal Sector Survey Form 2 Questionnaire: Bahasa Version
9 INTRODUCTION Background While the economies of the Asian Development Bank's (ADB) developing member countries (DMCs) continue to grow at high rates, recent research indicate that there are widening inequalities in standard of living, and of the poor being bypassed by growth. On the basis of household income and expenditure survey data of DMCs, the special chapter of the 2008 Key Indicators (ADB, 2008) provides evidence that absolute inequality have increased in many countries in Asia and that the rich have grown richer faster than the poor. How can this problem be addressed? One way is to improve the labor market opportunities for workers since employment is the major vehicle of the poor to rise out of poverty. To cope with poverty, the poor takes on informal employment like subsistence informal jobs, secondary jobs and occasional jobs. This type of labor arrangement has grown in many DMCs making the informal sector a major component of the economy. Such situation also occurs in Indonesia as one of DMCs. The informal sector contributes significantly in Indonesia s economy, particularly in terms of employment by providing economic opportunities to those displaced from or who cannot be absorbed by the formal sector, but informal sector and informal employment statistics have not yet been regularly collected nor included in Indonesia s official labor force statistics. The Interregional Cooperation on the Measurement of Informal Sector and Informal Employment (ICMISIE) ventures that the informal sector accounts for over 50 percent of nonagricultural employment and about 30 percent of non-agricultural GDP in many countries. Consequently, understanding and measuring the informal sector is vital to improving the labor market opportunities for the poor. The informal sector is comprised of (i) households with at least some market production; and (ii) production units with low levels of organization and technology, and with unclear distinction between labor and capital or between household and production operations. Other typical characteristics of these units are high mobility and turnover, seasonality, lack of recognizable features for identification, and reluctance to share information. The turnover of these production units are quite fast making it highly unlikely for them to be included in the list of establishments/enterprises that is usually used as sampling frames for business surveys. Moreover, the total number of employees of these production units is usually lower than the threshold number for inclusion in the list of establishments. Thus, it is quite likely that these units are not covered by the regular establishment or enterprise surveys. And though these units might be covered by household surveys, the standard questionnaires for these surveys do not usually include questions pertaining to production. Because of these issues, informal sector statistics are not collected through the regular survey system of national statistical offices (NSOs). Recognizing the importance of measuring the informal sector and informal employment, a regional technical assistance 1 (RETA) was initiated by the Asian Development Bank (ADB) for this purpose that aims to contribute to the measurement of the informal sector by helping national statistics offices to find a sound and viable data collection strategy. With more accurate data, the prevalence of informal employment and social protection issues, the share of informal sector can be properly reflected in the gross domestic product and also, the relationship between poverty and the informal sector can be thoroughly examined. 1 A similar project was being implemented by ESCAP in Asia under the development account called Inter-regional Project on the Measurement of the Informal Sector and Informal Employment. ADB adopted ESCAP's data collection methodology which was implemented by ESCAP in three countries: Mongolia, Philippines and Sri Lanka. Measuring the Informal Sector in Indonesia 9
10 ADB had the benefit of learning from the experience of the United Nations Economic and Social Commission for Asia and the Pacific (ESCAP) which had already done the research on the existing data collection strategies for the informal sector. ADB adopted ESCAP's approach which was basically to use mixed survey technique to collect data on informal employment and informal sector using the definitions and concepts established by the 15 th and 17 th International Conference of Labor Statisticians (ICLS). The concepts and definitions are described in Appendix 2 of this report while the cost-effective data collection strategy is discussed in detail in Appendix Objectives This report presents the results and analysis of the informal sector and informal employment using the expanded Labor Force Survey (Sakernas) August 2009 round and the succeeding informal sector survey. The processes that were taken in the preparation of survey questionnaires, the sampling design, in survey operations and data analysis are also documented in this report. Moreover, the process of institutionalizing the production of informal sector and informal employment statistics are also described in this report Informal Sector Statistics in the Realm of Official Statistics The informal sector statistics in the realm of official statistics are very limited. Even if the statistics are available, limitations due to the poor definition or non-use of the international concept of the informal sector prevents comparison of statistics with other countries. For the time being, statistics on the informal economy in Indonesia are based on the employment status and occupation variables collected from the regular national labor force survey (Sakernas). However, statistical information on the informal economy is not published as frequently as that of the labor force indicators' Main data sources The main data sources used in this report are the 2009 Informal Sector Survey (ISS), while the basic characteristics of the labor force are taken from the 2009 Sakernas (August Round). The ISS has two phases with the first phase as a rider survey to the Sakernas and the second phase, the survey of household unincorporated enterprises with at least some market production (HUEMs) that used the HUEMs identified in the first phase as the sampling frame. Details of this method are in Appendix 2. The first phase of the ISS was conducted on August 8-31, 2009 in all districts of two provinces, namely Yogyakarta and Banten while the second phase was implemented in about 187 census blocks of these two pilot provinces Layout of the Report The analysis of the informal sector survey will be presented in the following chapters as follows: Chapter 2 Employment in the Informal Economy Labor Force Characteristics, Jobs in the Informal sector, Persons Employed in the Informal Sector, Informal Employment, Industry of Economic Activity, Occupation, Employment Status, Wages and Earnings, Type of Tax Payment, Type of Enterprise, Size of Establishment, Legal Organization of the Enterprise, Kind of Work Place, Age Composition, Level of Education, Employment Conditions of Informal Employees, Exclusion of Agriculture, Forestry and Fishing. Chapter 3 Contribution of the Informal Sector to GDP
11 Industry, Administrative Unit and Urbanity, Agriculture and Non-Agriculture Sectors, Labor Productivity. Chapter 4 Characteristics of the Informal Sector Enterprises Household Unincorporated Enterprise Producing Some Marketable Goods (HUEM), Financing and Other Support Structure, Problems and Prospects. Chapter 5 Institutionalizing Informal Employment and Statistics in Official Statistics Significance, Objectives. Chapter 6 Summary and Conclusions Summary of Main Results, Importance of Measurement Informal Employment and Informal Sector, Other Issues. Chapter 7 Recommendations Measuring the Informal Sector in Indonesia 11
12 EMPLOYMENT IN THE INFORMAL ECONOMY 2 This chapter describes the profile of the informal employment utilizing two data sources, namely Sakernas and the phase 1 data of informal sector survey. The questionnaire for phase 1 or ISS-1 is in Appendix 7. The basic individual characteristics of the employed population are from Sakernas, while the nature of employment is mainly based on the results of the ISS-1 data. Because the ISS survey was conducted in only two provinces in Indonesia, this chapter will present the results for Yogyakarta and Banten separately. It should be noted that there are slight discrepancies between the ISS total employment estimates and those from the published Sakernas for Yogyakarta and Banten. For reasons discussed in Section 6.3, there were some inconsistencies in the data of the two surveys, and the information gathered in the ISS 1 were utilized for the purposes of this report. This is primarily for consistency of estimates, especially concerning the nature of employment. Also, estimation of formal and informal employment is chiefly based on the number of jobs and not the number of persons. This is an important distinction since a person may have more than one job, which is a typical situation in Asian countries, Indonesia included. An employed person may be a formal employee, working as a regular bus driver in a company in his main job. But he may also be working as a tricycle driver in his second job using a vehicle he owns, and can be considered as an own account worker. Hence, total employment by job nature will be larger than the total number of workers. More information on the concepts and definitions of terms used in the report are available in Appendix 1, while the detailed estimation methodology and decision matrices in classifying formal and informal employment are presented in Appendix 4. Additional statistical tables, on the other hand, are presented in Appendix 6. Table 2 illustrates the significance of informal employment in the two provinces. In fact, percent of the 2,547,320 total employment in the Yogyakarta was informal, whereas informal employment among the 3,924,663 jobs in Banten was percent. While it is to be expected for informal employment to be prevalent in informal enterprises, data showed that formal enterprises also supply a substantial amount of informal jobs. Estimates showed that percent of employment in formal enterprises in Yogyakarta was informal, and in Banten, percent (of the 1,141,961 jobs in formal enterprises). Table 2. Number of Informal Employment by Province, and Production Unit Province and Production Unit Nature of Employment (Number of jobs) Nature of Employment (%) Informal Formal Total INF FORM Yogyakarta Formal 103, , , Informal 2,164,886 43,120 2,208, Household 2,119-2, Total 2,270, ,673 2,547, Banten Formal 372, ,087 1,141, Informal 2,600, ,845 2,777, Household 5,455-5, Total 2,978, ,931 3,924, Notes: INF Informal; FORM Formal
13 Figure 2. Nature of Employment by Production Unit 0.09 YOGYAKARTA 100% BANTEN % 90% % % 80% 70% 70% 60% % 50% % 40% % % 30% 20% 20% 10% % 0% % INFORMAL FORMAL TOTAL INFORMAL FORMAL TOTAL Formal Enterprise Informal Enterprise Household Formal Enterprise Informal Enterprise Household Figure 2 shows the relevance of the informal sector in providing employment. Informal enterprises engaged percent of the total employment in Yogyakarta; in Banten, the jobs supplied by informal enterprises were relatively lesser, at percent of the total. Informal enterprises generally employed their workers informally, though there were instances that they also provided formal employment. In the same manner, formal enterprises mostly provided more formal than informal jobs. Informal jobs in informal enterprises were percent in Yogyakarta and percent in Banten; whereas formal jobs in formal enterprises in Yogyakarta and Banten were registered at percent and percent, respectively. 2.1 Labor Force Characteristics Figure Labor Force Characteristics by Sex: Agriculture vs Non-Agriculture % Men - Yog Men - Ban Women - Yog Women - Ban Total - Yog Total - Ban Employed in Agriculture Employed in Non-Agriculture Figure Labor Force Characteristics by Sex, Nature of Employment, and Industry % Men (Yog) Men (Ban) Women (Yog) Women (Ban) Total (Yog) Total (Ban) Informal Emp. (Agri) Informal Emp. (Non Agr) in Formal Enterprise Formal Emp. (Non Agr) Informal Emp. (Non Agr) in Informal Enterprise Yogyakarta is more dependent on agriculture than Banten. Figure shows that in Yogyakarta, the proportion of employed persons engaged in agriculture was percent, Measuring the Informal Sector in Indonesia 13
14 while the rest, percent was in the non agriculture sector. In Banten, the percentage of employed persons engaged in agricultural activities was much less than those in Yogyakarta, at percent. (Table 2.1 of Appendix 6 presents statistics in absolute terms). Whereas Figure characterizes labor force by sex and sector, Figure gives a picture of the composition of the labor force by dividing further the composition by formalinformal employment and enterprises. Thus, Figure divides total labor force by sex in each province into five components. Due to the insignificant figures, the composition of formal employment in agriculture in each category does not appear in this figure. They are 0.13 percent, 0.05 percent, 0.09 percent, respectively for Men, Women, and Total in Yogyakarta; whereas the corresponding figures for Banten are 0.41 percent, 0.31 percent, and 0.38 percent. Similar reason applies for non-agriculture informal employment in household. Non-agriculture informal employment was not recorded in the households in Yogyakarta, though in Banten, it registered among the women workforce at a very low percentage of 0.42, which was 0.14 percent of the total. Hence, for both Yogyakarta and Banten, almost all employed persons in the agriculture sector are working under informal arrangements. The percentage of men working informally in agriculture sector was almost the same as the percentage of informal employment among women in both provinces. Meanwhile, the percentage of informal employment in non agriculture sector was quite different from the level in the agriculture sector. From almost a hundred percent in agriculture sector, informal employment in Yogyakarta dropped to 79.2 percent in nonagriculture. The same trend is noted in the non-agriculture sector in Banten where informal employment was posted at percent. Hence, for both provinces, formal employment was more likely to exist in the non agriculture sector, at percent in Yogyakarta and percent in Banten, rather than in agriculture sector. It is interesting that in Yogyakarta, the percentage of men engaged in the nonagriculture informal employment is lower than that of the percentage of women in the same condition, at percent and percent respectively. However, the opposite is observed in Banten wherein percent of the men in the non-agriculture sector were informally employed, higher than the percent of women in informal employment. It is also noteworthy to mention that the share of non-agriculture formal enterprises in providing informal employment in the sector is significantly larger in Banten than in Yogyakarta, at percent and 8.73 percent respectively. This implies that formal enterprises in Banten hire one of every five informal workers in the non-agriculture sector of the province, while formal establishments in Yogyakarta only engage one in every Jobs in the informal sector Table Total Number of Jobs, by Activity and Unit of Production Production Unit Frequency Total Percent Primary Second Primary Second YOGYAKARTA Formal Enterprise 330,822 6, , Informal Enterprise 1,613, ,521 2,208, Household 461 1,658 2, Total 1,944, ,553 2,547, BANTEN

15 Formal Enterprise 1,135,626 6,335 1,141, Informal Enterprise 2,637, ,156 2,777, Household 5,455-5, Total 3,778, ,491 3,924, Note: Second jobs pertains to the jobs other than the main source of income, thus, may be composed of the second, third, and fourth jobs of the employed population. The ISS asked about the second job of employed persons and Table shows that percentage of second jobs to total jobs in Yogyakarta (23.7 percent) was higher than that in Banten (3.7 percent). This implies that having jobs other than the main source of income is more common in Yogyakarta than in Banten. Data in Yogyakarta showed that the household typically cater to the second jobs of workers; of the total jobs supplied by the household, 78.2 percent were second (other) jobs. Meanwhile, of the total jobs in formal and informal enterprises, 1.9 percent and 26.9 percent are second jobs, respectively. This suggests that between the two, the informal enterprise is more of the "go to" establishment when workers would like to have additional jobs over their primary employment. The same trend can be observed in Banten. Of the total jobs in formal enterprises, only 0.6 percent was second jobs, smaller than what was registered in informal enterprises, at 5.0 percent. Given that having second jobs is more ordinary in Yogyakarta than in Banten, it is but natural that employment of second jobs in each type of production unit is higher in this province. The high occurrence of second jobs in this province could be due to less wage or earnings received by the employed persons from their main jobs. Figure 2.2 Employment by Type of Enterprise: Primary and Second Jobs Note: Second jobs pertains to the jobs other than the main source of income, thus, may be composed of the second, third, and fourth jobs of the employed population. Figure 2.2 shows that the jobs of the employed population, whether primary or second, are generally created by informal enterprises. Among the primary jobs, employment in informal enterprises reached 83.0 percent in Yogyakarta and 69.8 percent in Banten., Similarly, among the second jobs, employment in informal enterprises also dominate in Yogyakarta and Banten, at 98.7 percent and 95.7 percent, respectively. Meanwhile, analysis by jobs showed that informal enterprises have a greater presence in the second than the primary jobs. In Yogyakarta, 83.0 percent of the primary jobs are in the informal enterprises, compared to the 98.7 percent of the second jobs. Similarly, in Banten, 69.8 percent of the primary jobs are provided by the informal establishments, much lower than the recorded percentage in the second jobs, at 95.7 percent. Provincial comparison, on the other hand, shows that formal enterprises in Banten have a larger impact in providing jobs than the formal establishments in Yogyakarta. Formal enterprises supply 30.1 percent of the primary jobs in Banten, higher than the 17.0 percent in Measuring the Informal Sector in Indonesia 15
16 Yogyakarta. Likewise, formal enterprises in Banten housed 4.3 percent of the second jobs, also higher than the 1.1 percent registered in Yogyakarta. Table Total Number of Jobs, by Nature of Employment and Activity Nature of Employment YOGYAKARTA Frequency Activity Percent Primary Second Total Primary Second Informal 1,675, ,734 2,270, Formal 268,854 7, , Total 1,944, ,553 2,547, BANTEN Informal 2,835, ,663 2,978, Formal 943,103 2, , Total 3,778, ,491 3,924, Table shows that informal employment is more common in both the primary and second jobs of workers in both provinces. Informal employment among the primary jobs in Yogyakarta was registered at 86.2 percent, while it was 75.0 percent in Banten. Meanwhile, among the second jobs, informal employment was recorded at 98.7 percent and 98.1 percent in Yogyakarta and Banten, respectively. Job composition analysis showed that 26.2 percent of the total informal employment in Yogyakrata was second jobs. This records a large difference to the percentage in Banten which only reached 4.8 percent. This suggests that in Banten, informal arrangements are already a popular case in the primary source of income of workers. Moreover, it is more common among the primary jobs in Banten than in Yogyakarta. With regard to the job composition of total formal employment, 2.8 percent were second jobs in Yogyakarta and a lower 0.3 percent was posted in Banten. In total, percent of total employment in Yogyakarta was classified as second jobs, while only 3.73 percent was registered in Banten. 2.3 Persons employed in the informal sector According to the results presented in Table 2.3.1, majority of the formally employed in Yogyakarta was working as employees percent among males and 93.4 percent among females. The next common employment status was employer, 5.1 percent among male formal workers and 4.0 percent among their female counterpart. The situation in informal employment is quite different from the one described above, such that the employed persons are distributed across the different employment statuses. Among the total employed men, 33.6 percent were employers; 23.3 percent, own account workers; and only 18.5 percent were employees. On the other hand, 35.5 percent of the total female informal workers were classified as unpaid workers, followed by 21.5 percent, employers, and 21.2 percent, own account workers. Less than 3.0 percent of the men and women in informal employment were casual workers in the agriculture sector. Banten showed a similar trend as that of Yogyakarta s in terms of formal employment. The proportions of men and women working as employees were high, at 96.4 and 96.5 percent, respectively. However, Banten has smaller percentages of formal employers at 1.5 percent among men and 0.4 percent among women. Meanwhile, the province exhibited a different pattern compared to Yogyakarta with regard to informal employment. Among the
17 employment statuses employee registered the highest prevalence among the total male and female workers, at 34.1 percent and 29.4 percent, respectively. Among the men, informal own account workers ranked next, at 28.1 percent, followed by employers, at 17.7 percent. Regarding the women informal workers, 29.2 percent was identified to be unpaid family workers and 21.1 percent, own account workers. These comparisons show interesting observations. Given that the two provinces have different economies, to which more discussions are available in Section 2.5, there also seems be a distinction between Yogyakarta and Banten s informal employment. However, none is apparent in the formal employment. One hypothesis on this notion is that the formal employment structure is generally the same regardless of the type of economy where it exists. However, it seems like the same cannot be said concerning informal employment. The results suggest that its structure is not constant and that it is affected by the characteristics of the labor economy to which it is present. Table Percentage of Employed Persons by Employment Status, Nature of Employment and Sex Employment Status Nature of Employment Formal Informal men women Total Men women Total YOGYAKARTA Own account worker Employer w/ temp workers ,5 Employer w/ permanent workers Employee Casual worker in agri Casual worker in non-agri Unpaid family worker Total BANTEN Own account worker Employer w/ temp workers Employer w/ permanent workers Employee Casual worker in agri Casual workerin non-agri Unpaid family worker Total Figure 2.3 Formal and informal employment in informal enterprises, by sex and province % Formal-Yog Formal-Ban Informal-Yog Informal-Ban Total-Yog Total-Ban men w omen Measuring the Informal Sector in Indonesia 17
18 Figure 2.3 shows that there are more men than women working in informal enterprises, regardless whether they are engaged formally or informally. However, provincial comparison shows that in Banten, the number of men engaged in informal employment is 7 percentage points more compared to the situation in Yogyakarta. 2.4 Informal Employment Figure Employment by type of production unit and nature of employment, and sex YOGYAKARTA BANTEN % Men Women ALL Men Women ALL Men Women ALL % Men Women ALL Men Women ALL Men Women ALL Formal Informal Formal +Informal Formal Informal Formal +Informal Formal Enterprise Informal Enterprise Formal Enterprise Informal Enterprise Figure shows that in relative terms, there are more jobs created by formal enterprises in Banten (29 percent) than in Yogyakarta (13 percent). The figure also shows that some of these jobs have informal arrangements. And like the trend with the total jobs, formal enterprises in Banten also created more informal jobs compared to the same kind of establishments in Yogyakarta. In particular, among informal jobs in Banten, 13 percent were created by formal enterprises much higher than the 5 percent in registered in Banten. Figure Informal employment by production unit and province % Yogyakarta Banten formal informal household Figure is the same as Figure 2.4.1, but concentrates on informal employment and the production unit that provides the job. It shows that the percentage of informal jobs in formal enterprises in Banten is three times more than the percentage in Yogyakarta. Figures and may have provided one of the reasons for the different employment structures in the two provinces, as discussed in the previous section. Recall that informal employment in Banten was predominantly composed of employee jobs while that of Yogyakarta was the employer status. If the formal enterprises in Banten have a substantial role in supplying informal employment, then these are most likely the employee jobs. This is so because self-employed workers (own account and employers) typically take the characteristics of the enterprises they owned, thus, if they work in formal enterprises, their employments are also under formal arrangements, and vise-versa. This also explains the large proportion of the self-employed in Yogyakarta s informal employment structure, since most of these informal jobs were provided by informal enterprises.
19 With these observations, it would also be interesting to determine whether the quality of informal employment in Banten will be different from that in Yogyakarta, specifically for employees, because of the difference in informal job providers. Do formal enterprises offer different kind of employment benefits than informal enterprises? This line of analysis is explored in Section Figure Distribution of men and women engaged in informal employment by Employment status YOGYAKARTA own account employer w/ permanent worker employer w/ temp worker men employee casual employee in agri w omen casual employee in non-agri unpaid family worker BANTEN own account employer w/ permanent worker employer w/ temp worker men employee casual employee in agri w omen casual employee in non-agri unpaid family worker Meanwhile, Figure shows that under informal employment, the jobs assumed by men outnumber those carried out by women types of employment statuses, except the unpaid family worker category. However, in Yogyakarta, the distribution of jobs performed by men and women are the same, under the casual employee in agriculture status. 2.5 Industry of Economic Activity Table Comparison of Industry Classification: ISIC Rev. 3 vs. Sakernas ISS ISIC Rev.3 Industry Classification Code(s) 'Industry/sector' in Sakernas Code(s) 1 Agri (1) Agriculture, hunting and forestry , 20 * (2) Fishing * 2 Mining (3) Mining and quarrying , , 120, , Mfg (4) Manufacturing , 160, , , , , 210, , , , , , 269, , 281, 289, , 300, , 319, , , , , 359, 361, 369, Egw (5) Electricity, gas and water supply , Cons (6) Construction Wrt (7) Wholesale and retail trade; repair of motor vehicles, , , 519, , (531- motorcycles and personal and household goods 535, 539, , 549)** 7 Hotels (8) Hotels and restaurants Tcs (9) Transport, storage and communications , , 622, , 639, Financ (10) Financial intermediation , , Educ (13) Education , Healt (14) Health and social work (11) Real estate, renting and business activities , , , 729, , , 749 (12) Public administration and defence; compulsory social Other security (15) Other community, social and personal service , , 919, , 930 activities (16) Private households with employed persons (17) Extra-territorial organizations and bodies No response 0 * '0' in the first digit was truncated ( )** occupations of those who have these industry codes belong to wholesale and retail trading ICSI stands for Industry Classification in Statistics Indonesia Measuring the Informal Sector in Indonesia 19
20 Source: Sakernas Guidance Book of Supervisor The informal sector survey used the Indonesia Standard Industrial Classification (KBLI 2005) in generating the codes for the main industry variable. KBLI 2005 was based on the UN Statistics Division s International Standard Industrial Classification Rev. 3 as used also in Sakernas (Table 2.5.1). Figure shows that Agriculture sector still dominated the total employment in Yogyakarta, followed by trade sector and manufacturing sector. Almost half of the total jobs in the province were engaged in agricultural activities. On the other hand, the manufacturing industry provides the most number of jobs in Banten, followed by trade and agriculture sectors for which 20.4 percent and 17.4 percent of the total employment is sourced from, respectively. Figure The structure of total employment in Yogyakarta and Banten Electricity Health_Social Financial_Int Mining Fishing Public_Adm Real_Estate Education Private_HH Transport Other_Comm Hotels Construction Manufacturing Wholesale Agriculture % Banten Yogyakarta Based from the results provided in Table 2.5.2, the total number jobs in the two provinces are mostly characterized to be with informal arrangements. In Yogyakarta, 89.14% are informal jobs; 75.9 percent in Banten. This is generally true for most of the sectors of economic activities except public administration, education, health/social, and financial sectors wherein percent, percent, percent, percent, respectively are considered as formal jobs. The same can be observed in Banten, most of the jobs in public administration, health/social, finance including the manufacturing sectors, are with formal arrangements. Table Nature of employment by Industry and Province, (%) Industry Yogyakarta Banten Formal Informal Formal Informal Agriculture Fishing Mining Manufacturing
21 Electricity (EGW) Construction Wholesale Hotels Transport Financial_Int Real_Estate Public_Adm Education Health_Social Other_Comm Private_HH Others Total A significant portion of informal employment in Yogyakarta were engaged in agriculture sector; as much as 48.7 percent of the total number of jobs with informal arrangements (2,270,647). This is followed by trade (14.7 percent) and manufacturing (10.6 percent) as seen in Figure In Yogyakarta, there are more formal jobs in mining & quarrying, EGW, and hotels & restaurants assumed by men. Meanwhile, the private household sector fully employed women for its formal jobs. Informal employment in the following sectors, namely wholesale, health/social, and private household in Yogyakarta were still dominated by women workers (Figure 2.5.2). Figure The structure of Formal and Informal employment in Yogyakarta Unlike in Yogyakarta, the informal employment in Banten is predominantly driven by the trade sector, followed by agriculture and manufacturing (Figure 2.5.3). Measuring the Informal Sector in Indonesia 21

22 Figure The structure of Formal and Informal employment in Banten Table The structure of employment (total and informal) by province and sex TOTAL INFORMAL EMPLOYMENT Industry Yogyakarta Banten Yogyakarta Banten Men Women Men Women Men Women Men Women Agriculture Fishing Mining Manufacturing Electricity Construction Wholesale Hotels Transport Financial_Int Real_Estate Public_Adm Education Health_Social Other_Comm Private_HH Others Total In addition, while it s the agriculture sector which provides more informal jobs for men in Banten, more informal jobs for women are sourced from the trade sector as seen in Table In particular, percent of the total number of informal jobs in Banten is created by the trade sector, while percent were sourced from agriculture. 2.6 Occupation Figures and illustrate the stylized fact on skill discrepancy between informal and formal workers. The types of skills are, however, different between the two provinces. Whereas jobs for skilled agricultural workers were most prevalent in informal employment in Yogyakarta, Banten employs more unskilled workers in its informal jobs.
23 Figure Employment by occupation and nature of employment in Yogyakarta % Occupation 1) Total Economy Formal Empoyment Informal Employment ) Occupations: According to the Standard Classification of Occupations of Indonesia (KBJI 2002) 1. Legislators, senior officials and managers 2. Professionals 3. Technicians and associate professionals 4. Clerks 5. Service workers and shop and market sales workers 6. Skilled agricultural and fishery workers 7. Craft and related workers 8. Plant and machine operators and assemblers 9. Elementary occupations 0. Armed forces The skilled agricultural and fishery workers already comprise two-fifths of the total number of jobs in Yogyakarta. Since this province shows a higher incidence of informal than formal employment, it is not surprising to note that 46.2 percent of the informal jobs are that of skilled agricultural and fishery workers ; 18.7 percent are jobs of service workers, shop and market sales workers; 13 percent, are jobs of craft and related workers; and 12.1 percent are jobs assumed by elementary (unskilled) workers. Occupations requiring more technical skills account only for less than one tenth of the total number of informal jobs in the province. Expectedly, skilled agricultural and fishery workers classification is the least source of formal employment in Yogyakarta, at only 1.3 percent. Intuitively, most of them are either (28.7 percent of the total formal jobs), or clerks (19.3 percent) (Figure 2.6.1). On the other hand, almost 40 percent of the total number of jobs in Banten is either elementary occupations or plant & machine operation and assembly. This is because Banten is relatively more industrialized such that its economy depends more on non-agriculture sector, particularly manufacturing, unlike Yogyakarta whose main source of jobs is agriculture (Figure 2.6.2). Most of the occupational jobs in Banten have formal arrangements, except the jobs of service workers, skilled agricultural and fisheries workers, and the unskilled workers. Unlike Yogyakarta where agriculture employment comprises the bulk of informal employment, the informal jobs in Banten are distributed between agriculture and non-agriculture employment. Measuring the Informal Sector in Indonesia 23
24 Figure Employment by occupation and nature of employment in Banten % Occupation 1) Total Economy Formal Empoyment Informal Employment Employment Status In both provinces, fixing employment status, one can observe that there are more jobs assumed by men in either formal or informal employment. This is true except for the unpaid family job in which 68 percent and 74 percent were carried out by women in Yogyakarta and Banten, respectively Figure 2.7 Employment by Employment Statuses, Nature of Employment and Sex YOGYAKARTA Own account Employer w/ Employer w/ Employee Casual worker in Casual workerin Unpaid family worker temp workers permanent agri non-agri worker workers YOGYAKARTA Own account Employer w/ Employer w/ Employee Casual worker in Casual workerin Unpaid family worker temp workers permanent agri non-agri worker workers Formal men Formal women Informal men Informal women BANTEN Own account Employer w/ Employer w/ Employee Casual worker in Casual workerin Unpaid family worker temp workers permanent agri non-agri worker workers Formal men Formal women BANTEN Own account Employer w/ Employer w/ Employee Casual worker in Casual workerin Unpaid family worker temp workers permanent agri non-agri worker workers Informal men Informal women In addition, it is also interesting to note that for every 5 own account jobs under formal arrangements in Banten, 3 are assumed by women. This pattern is unlike the ones manifested by the other own account cases. In fact, all of the formal own account jobs in Yogyakarta were assumed by men, while it was 61 percent among informal ones. In Banten, 73 percent of the informal own account jobs were performed by men. The details are illustrated in Figure 2.7.
25 2.8 Wages and Earnings During data collection, strict skipping pattern has been applied in Sakernas with regard to the wage and earnings variable. In particular, own account workers, casual employees in agriculture, and casual employees in non-agriculture were asked about their incomes, while employees were asked about their wages. On the other hand, workers classified as employers were not directed to answer any income/wage-related items. Hence, the analyses provided in this section are limited to non- employers. In addition, Sakernas only collects data on income or wages with respect to respondents primary jobs. Hence, it should be noted that if no earnings are presented, specifically for the self-employed, this does not suggest that there are no existing workers for that classification or that no income is received. This is just a case of no data were reported. Across provinces, Table shows that workers in formal employment receive significantly higher earnings, twice as much on average, than those in informal employment. Specifically, in Yogyakarta, formal employees' wages are three times what informal employees were earning. In Banten, formal employees received twice as much wages as that of informal employees. The same is observed among the self-employed. Table Average wage and earnings by employment status and nature of employment Class of Workers Formal Informal Ratio ALL Yogyakarta Employees 1,893, , ,220,291 Self employed - 853, ,233 Average earnings 1,893, , ,092,962 Banten Employees 1,710,182 1,158, ,426,725 Self employed 1,491, , ,953 Average earnings 1,704,493 1,080, ,304,547 On the average, male workers are better of than their female counterparts in terms of wage and earnings received (Table 2.8.2) regardless whether one is employed formally or informally but the gap is a little higher in formal employment. The wage differential is highest among formally self-employed persons in Banten while the smallest discrepancy was observed among informally self-employed in Banten, at Rp. 4,072 (Rp. 971,919 for men and Rp. 967,847 for women). Table Average wage and earnings by employment status, nature of employment, and sex Class of Workers Formal Informal Ratio Men Women Men Women Ratio Men Women Ratio Yogyakarta Employees 2,146,251 1,484, , , ,363, , Self employed ,017, , ,017, , Average earnings 2,146,251 1,484, , , ,247, , Banten Employees 1,888,117 1,397, ,267, , ,552,499 1,166, Self employed 2,233,333 1,000, , , , , Average earnings 1,889,737 1,392, ,141, , ,388,190 1,115, Measuring the Informal Sector in Indonesia 25
26 The average earnings of women engaged in formal employment are higher, at Rp. 1,484,579 ($ 161) per month, compare to the earnings received by those in informal employment, whose average monthly earnings is Rp ($ 69). Table also shows that on the average, women in formal employment in Yogyakarta tend to be better paid, than formally employed women in Banten. This advantage fades off when it comes to informal employment. In particular, women engaged in informal employment in Banten earned more than those in Yogyakarta, at an average of Rp. 924,560 or $ 101 and Rp. 637,601 or $69 per month, respectively. The earlier discussions concerning nature of employment only consider the wage differential between male and female groups or workers. In what follows, are the wage differentials between urban and rural areas. As seen in Table 2.8.3, average monthly wages of workers in urban areas are higher than those in rural areas. The largest wage differential was noted among self-employed persons in Banten with the difference of Rp. 1,233,333 between urban and rural wage. Comparison by urbanity showed that formal workers were paid more in urban areas than in rural areas. In Yogyakarta, for example, those working in formal jobs located in the urban earned about Rp. 1,958,624 ($212) on average, whereas their counterparts in the rural only received an average of Rp. 1,674,645 ($182) per month. Similarly, informal workers in urban areas of Yogyakarta earned more than those working in the rural areas, Rp. 841,521 or $91 and Rp. 760,235 or $82, respectively. Also in Banten, those working in urban areas had relatively higher average earnings than those in rural areas Rp. 1,755,292 ($191) compared with Rp. 1,383,600 ($151) in formal employment and Rp. 1,214,258 ($132) compared with Rp. 794,115 ($86) for those with informal jobs. Table Average wage and earnings by employment status, nature of employment and urbanity Class of Workers Formal Informal Ratio Urban Rural Urban Rural Ratio Urban Rural Ratio Yogyakarta Employees 1,958,624 1,674, , , ,275,038 1,091, Self employed , , , , Average earnings 1,958,624 1,674, , , ,175, , Banten Employees 1,753,655 1,397, ,302, , ,544, , Self employed 2,233,333 1,000, ,074, , ,081, , Average earnings 1,755,292 1,383, ,214, , ,439, , Type of Tax Payments (for Employers and Self-Employed) In both provinces, enterprises of own account workers and employers in urban areas are more likely registered in tax agency compared to those in rural areas (Table 2.9.1). For every registered enterprise in the rural area in Yogyakarta, two are registered in the urban area. Banten noted a higher urban-rural registration ratio, at 4:1. A possible reason is that tax agencies in rural areas are less likely to be available than in urban areas, thus, limiting the access of enterprise owners. Another possible explanation could be attributed to the educational background of the owners, that is, they have no enough knowledge of the process and requirements on how to register their enterprise. Moreover, information dissemination on the registration process may also be better in the urban than the rural areas.
27 Table Tax Agency registration of registered production units and tax payments of all production units owned by owned by own account workers and employers by urbanity Employment Status Yogyakarta Registered Enterprises to Tax Agency (%) urban Rural Total no tax payment Enterprises Type of Tax Payment of all Enterprises (%) corporate tax others don't know Own account worker Employer Total Banten Own account worker Employer Total Other means retribution Table shows that in Yogyakarta, among the enterprises of own account workers and employers, 82.1 percent and 86.1, respectively, reported that they do not pay taxes. More or less, Banten noted a similar pattern in terms of tax payment of enterprises of own account workers and employers, that is, majority of them do not pay taxes. However, it is noticeable that the percentage of tax paying enterprises in Banten is higher than in Yogyakarta, at 18.6 percent and 12.3 percent, respectively. This may be due to the greater presence of formal enterprises in Banten, at 29.1 percent, compared to the percentage in Yogyakarta, at 13.2 percent. Hence, for every formal enterprise in Yogyakarta that pays taxes, there are four doing the same in Banten. Meanwhile, there are two tax-paying informal enterprises in Banten for every one in Yogyakarta. Nevertheless, the percentage of own account workers and employers saying that they do not know whether their enterprises pay tax or not are higher in Banten, at 9.0 percent, than in Yogyakarta, at 3.4 percent. Table Tax agency registration and tax payment of enterprises owned by own account workers Registered in tax agency? no tax payment Tax Payment corporate tax others don't know Total Yogyakarta yes no don't know Total Banten yes no don't know Total Table shows that among the enterprises of own account worker which registered in tax agency, 22.0 percent pay corporate taxes in Yogyakarta and in Banten only 11.8 percent. In contrast, those that pay other taxes show a higher percentage in Banten than that in Yogyakarta at 42 percent and at 16 percent, respectively. For the enterprises Total Measuring the Informal Sector in Indonesia 27

28 which do not know whether they pay the tax or not is 3.5 percent in Yogyakarta and 10.7 percent in Banten Type of Enterprise Figures and illustrate that in both provinces, almost half of the total number of jobs in informal establishments is carried out in farm/workshop (48.83 percent in Yogyakarta and percent in Banten). The trend in these two provinces is, however, a little bit different among the jobs identified in formal enterprises. Most of formal enterprises in Yogyakarta are restaurant (21.69 percent) and in hospital/school (21.26 percent), while in Banten the most frequent type of formal enterprise identified by 45.5 percent are the factories/plantations. These results are consistent with the economic situation in Yogyakarta, Yogyakarta city in particular, which is well a known city for tourism and university education destination. Figure Percentage of jobs worked at formal/informal enterprises by type of enterprise in Yogyakarta Many students, especially those in college, from other provinces come to Yogyakarta to study. The famous Borobudur temple in the province also draws numerous domestic and foreign tourists every year. This creates a market even for small restaurants (e.g., small canteens which serve gudeg, a special traditional menu). Meanwhile, since most education establishments are formal, it is not surprising to note that they generate the most number of jobs, among other formal enterprises. On the other hand, Banten is known as an urbanized and industrialized province where a lot of manufacturing establishments (domestic and foreign) are located. Among the total number of jobs worked in factories, it seems that there are more which can be associated to formal enterprises in Banten (Yogyakarta: 23 percent formal; and 77 percent informal; Banten: 68 percent formal; 32 percent informal) as shown in Table In interpreting these results, it should be noted that the term factory is interpreted in Indonesia as a manufacturing production unit regardless of the size (whether big or small), hence, one can assume that the formal factories are the large multinational corporations or even local production but big in scale. On the other hand, the informal factories correspond to those with small-scale productions. Given these explanations, the results are consistent; that is, manufacturing productions in Yogyakarta are small-scale thus, the jobs are generally in informal factories, which is the reverse in Banten in which most of the manufacturing jobs are in formal factories.
 of jobs associated to formal compared to Yogyakarta (13.2 percent).")
29 Figure Percentage of Jobs worked at formal/informal enterprises by type of enterprise in Banten In total, Banten posted a higher proportion (29.1 percent of total number of jobs) of jobs associated to formal compared to Yogyakarta (13.2 percent).. This implies that in relative terms Banten s formal enterprises generated more jobs than formal enterprises in Yogyakarta. This may have stemmed out from the fact that Banten is just driving distance (3 hours) from Jakarta, the country s capital. The limited space in Jakarta has forced many establishments to build new building/office/factory in the nearby places. Moreover, Yogyakarta which is less urbanized province than Banten relied on the informal enterprises which are mostly undertaken at farms. This validates the earlier discussion of this chapter wherein most informal workers in Yogyakarta were engaged in agricultural sector which should be done mostly at farm. Table Percentage of type of enterprise and nature of employment Yogyakarta Banten Type of Enterprise Formal Enterprise Informal Enterprise Household Formal Enterprise Informal Enterprise Household Factory Bank/ insurance Restaurant Construction Hospital/school Engineering firm Farm Others Total Size of Establishment Table reveals that majority of those employed in the informal enterprises in Yogyakarta, around percent, worked in establishments employing less than five persons, but only percent of those employed in the formal enterprises work in Measuring the Informal Sector in Indonesia 29
30 establishments with the same size. Among the persons employed in formal enterprises, those holding informal jobs are more likely to work in smaller establishments while those with formal jobs are likely to work in larger establishments. In proportion to the number of formal jobs generated by formal enterprises in Yogyakarta percent were carried out in enterprises employing less than five persons. In Banten, percent of the informal jobs were from formal enterprises employing less than five persons. Among formal enterprises in Yogyakarta, average-size enterprises employing workers generated the most number of formal jobs while small enterprises (employing 1-4 workers) are the main source of informal jobs. But in Banten, formal enterprises employing workers are the main source of both formal and informal jobs. In particular, around 4.76 percent of informal employment are engaged in formal enterprises with less than 5 workers; 4.88 percent in the formal enterprises with 5 to 9 workers; percent, with workers; percent, with workers; and percent in the formal enterprises with 50 to 99 people engaged. This means that formal enterprises in Banten also significantly supply informal employment in the province. Employees compose more than 90 percent of the informally employed workers in formal enterprises and are generally working in factories and plantations. Meanwhile, formal employment in formal enterprises follows the same pattern observed in Yogyakarta. Table Employment by type of production, nature of employment and employment size of establishment Employment Size Formal Employ-ment Production Unit Formal Enterprise Informal Employment TOTAL Informal Enterprise Households TOTAL Yogyakarta Dont_Know Total Banten Dont_Know Total What can be inferred from Table is that informal employment in rural areas (88.11 percent) was more concentrated in small establishments (less than five workers) than employment in urban areas (75.45 percent). Informal employment both in urban and rural areas in Banten employed more workers than in that in Yogyakarta. In urban areas of Banten, for example, informal jobs tend to be concentrated on larger establishment such as with workers which was registered at percent, while in Yogyakarta the figure was only 2.24 percent.
31 Table Employment by employment size of establishment, nature of employment and urbanity Employment size Yogyakarta Formal Employment Informal Employment Urban Rural Total Urban Rural Total Dont_Know Total Banten Dont_Know Total Legal Organization of the Enterprise In both provinces, informal employment was more likely engaged in single proprietorship. About 90.6 percent of the total number of jobs was engaged in entrepreneurial activities of single proprietors in Yogyakarta, 72.1 percent in Banten (Figure 2.12). Intuitively, corporations in Banten generated the highest number of formal jobs. In particular, corporation absorbed more or less 64 percent of the total formal jobs in the province. Table 2.12 Employment by legal organization, nature of employment and sex Legal Organization Yogyakarta Formal Informal Men Women Total Men Women Total single proprietorship partnership corporation cooperative others don't know Total Banten single proprietorship partnership corporation cooperative Measuring the Informal Sector in Indonesia 31


32 others don't know Total % Figure Employment by legal organization, nature of employment and sex % Formal Men Informal Men Formal Women 90 Informal Women Formal Total 80 Informal Total single prop. partnership corporation cooperative others don't know single prop. partnership corporation cooperative others don't know Yogyakarta Yogyakarta % % Formal Men Formal Women Formal Total Informal Men Informal Women Informal Total single prop. partnership corporation cooperative others don't know single prop. partnership corporation cooperative others don't know Banten Banten 2.13 Work Place Survey results presented in Table , which describes the place of work, may provide useful hints in inferring the nature of employment. Although there are uniformly more informal jobs across different places of work, the propensity to have formal jobs are higher when one is working on fixed location (away from home) or construction site, characteristics which are associated to formal entrepreneurial activities. Similarly, in Yogyakarta, those working at home, in farms, markets, streets, employer's homes and their vehicles are more likely to engage in informal jobs. Intuitively, those who reported to be working in farms usually have informal jobs. In Yogyakarta, percent of the total number of jobs undertaken in farms are informal; percent in Banten. In other words, those working in farms are generally engaged in informal employment. Since farm as a workplace is associated with agriculture, this confirms that in agriculture, informal employment is more prevalent.
33 Yogyakarta Table Employment by place of work and nature of employment Place of Work Formal Employment Row Percent Informal Employment Formal Employment Column Percent Informal Employment home w/ no work space home w/ work space fixed location away from home farm workplace of client construction site market street employer's home others vehicle no fixed location/mobile Total Banten home w/ no work space home w/ work space fixed location away from home farm workplace of client construction site market street employer's home others vehicle no fixed location/mobile Total In Yogyakarta, the most common workplace among the formal workers was fixed location away from home (55.72 percent). This type of workplace was also the most common one in which percent of employed person worked in such workplace, in Banten. Table Informal employment by place of work (excluding farm and agricultural plots) and urbanity Yogyakarta Place of Work Row Percent Informal Employment Column Percent Urban Rural Urban Rural home w/ no work space home w/ work space fixed location away from home workplace of client Total Measuring the Informal Sector in Indonesia 33
34 construction site market street employer's home others vehicle no fixed location/mobile Total Banten home w/ no work space home w/ work space fixed location away from home workplace of client construction site market street employer's home others vehicle no fixed location/mobile Total The construction site was the second most common workplace among formal workers in Banten. In addition, among the total jobs with this kind of workplace (594,537 see Table in Appendix 6), percent was formal and percent was informal. In fact, this is the only type of workplace in Banten wherein formal employment exceeded informal employment. Table describes the place of work of those engaged in informal employment. Excluding the jobs in agriculture and farm as a workplace, fixed location away from home is the most popular location for informal employment in both Yogyakarta and Banten. More than half of informal employment in rural areas in Yogyakarta and percent in urban areas in Banten were working in fixed location away from home. Meanwhile, about percent of those working in fixed location away from home in Yogyakarta were in rural areas, large compared to only 32.5 percent posted in Banten. In urban areas in Yogyakarta, percent informal employment worked in fixed location away from home. Similarly, in urban areas in Banten, workers with informal jobs were also more likely to work in fixed location away from home (30.79 percent). Such a workplace was also the most prevalent in rural areas in Banten at percent. To summarize, in Yogyakarta and Banten, employed persons who lived in both urban and rural areas preferred to work at home but without work space. The place of work which has the lowest informal employment in Yogyakarta was in workplace of client (urban areas) and street (rural areas) at2.51 percent and 2.23 percent, respectively. Unlike in Yogyakarta, the lowest percentage of workplace that workers are generally engaged in informal employment in Banten was in workplace of client registered at 0.67 percent in urban areas and in employer s home registered at 2.64 percent.
35 2.14 Age Composition The composition of employment in Yogyakarta and Banten for all age groups show different trends. In Yogyakarta, the proportion of jobs assumed by more senior workers, aged 55 and over, was higher than that of jobs assumed by younger persons, aged year old, at percent vs 8.59 percent, respectively. In contrast, in Banten, percent of employment with ages years was higher than that of the older 55 and over ages (10.52 percent). Jobs assumed by middle-aged workers comprise the bulk of the total number of jobs.. This is true for both the rural and urban areas in the provinces. Age Group Table Employment by urbanity and age groups Yogyakarta Banten Urban Rural Total Urban Rural Total Total In Yogyakarta, the proportion of formal jobs assumed by younger workers, aged years is twice of than in informal employment (Table ). Banten has similar pattern with Yogyakarta, though at a lesser degree in which percent of formal jobs is assumed by those aged compared to percent of informal jobs. This suggests that in relative terms, formal employment provide more jobs for younger workers than informal employment does. Age Group Table Employment by nature of employment and age groups Yogyakarta Banten Formal Informal Total Formal Informal Total Total Figure 2.14 shows that across any age group, there are more informal jobs. At young age (15-24 years old), percent jobs done by young workers were informal, and the remaining job at percent were formal in Yogyakarta; while the corresponding figures in Banten are percent and percent, respectively. In the case of jobs assumed by middle aged workers (25-54 years old), 87.8 percent were informal in Yogyakarta; 75.9 percent in Banten. The incidence of informal jobs was most likely among senior workers (55 years and above). Figure 2.14 Employment by nature of employment and age groups 100% 90% 80% 70% 60% 50% 40% 30% 20% 10% 0% YOGYAKARTA BANTEN Formal Informal Measuring the Informal Sector in Indonesia 35
36 Table Informal employment by unit of production and age groups Age Group Yogyakarta Banten Formal Informal Household Formal Informal Household Total Level of Education Table shows that in Yogyakarta, percent of those engaged in employee jobs reached college or university levels, higher than the percentage registered among the self-employed (8.20 pecent), employers (5.1 percent) and 3 unpaid family workers (3.0 percent). Meanwhile, the percentage of employers with no education was recorded at 28.5 percent, slightly more than the percentages recorded among the unpaid family workers, at 26.0 percent, and own account workers, at 24.5 percent. The least proportion was reported among employees, at 11.0 percent. Table Employment by level of education and employment status Educational level Employees Self_employed Employer Unpaid_fw Yogyakarta No educ 11,00 24,47 28,50 26,04 Primary 16,49 22,97 30,85 28,54 JHS 33,33 41,70 42,57 42,54 SHS 20,51 14,79 12,51 16,51 College 4,92 3,86 1,76 1,42 Univ 7,34 4,34 3,32 1,62 Banten No educ 13,68 25,81 39,93 32,90 Primary 23,53 31,00 28,28 31,12 JHS 18,67 18,31 11,20 18,26 SHS 28,04 22,85 16,88 15,41 College 5,58 1,26 1,40 0,96 Univ 10,50 0,77 2,32 1,34 Note: see Table in Appendix 6 for absolute figures (frequency counts) The table also gives evidence that employees in Banten were more educated than those in Yogyakarta. More jobs in Banten employed workers as employees with high educational background, such as college or university graduates at percent slightly higher than percent registered in Yogyakarta. On the other hand, as happened in Yogyakarta despite with less percentage, jobs for self-employed, employer, and unpaid family workers required less people with high level of education at 2.03 percent (1.26 percent for college and 0.77 percent for university), 3.72 percent, 2.30 percent, respectively. Moreover, no educated people were concentrated on the jobs as employer, and unpaid family workers at percent and percent, respectively. Despite not the most, selfemployed still showed a high percentage at percent. Those with no education are likely to be employers and/or unpaid family workers in Yogyakarta and employers and/or own-account workers in Banten. Meanwhile, those with higher education, college degrees and the like, are likely to be employees in both provinces.
37 This suggests that people tend to work for themselves if their educational background is low, while jobs in someone else's enterprise are the general path of those with higher education. This may be because the marketability of people with low levels of education is much less than those with high levels and that they are generally not among the first to be hired. Thus, they resort to self-employment jobs. Meanwhile, the reported high percentage of unpaid family workers with no schooling in Yogyakarta reflects the agricultural characteristic of its economy. These unpaid family workers mostly work in farms and provide their services to their family-owned enterprise. It is clearly shown in Table that percent of unpaid family workers with no education are concentrated on agriculture. Table Unpaid family workers with no education by industry Industry Yogyakarta Banten Frequency Percentage Frequency Percentage Agriculture 58, , Manufacturing 2, Wholesale , Hotels Transport Real Estate - - 3, Total 61, , Table shows that of the total jobs assumed by women, percent were carried out by those with no education. It can also be observed that of the total female unpaid family workers, the percentage of those with no education was 17.7 percent, quite high compared with the figure recorded by their male counterparts, at 2.1 percent. This implies that women who have very limited formal education are mostly likely to end up working as unpaid family members than their male equivalent. Education Level Yogyakarta Table Employment by level of education, employment status, and sex Employment Status Own account Unpaid Family TOTAL Employees Employer worker Worker M F M F M F M F M F No_Education 0,1 1,71 2,69 10,48 9,72 13,5 2,07 17,7 4,26 11,34 Pre-Primary 5,88 6,36 19,95 16,79 18,26 14,32 9,48 15,02 13,89 13,05 Primary 10,32 11,71 20,91 26,12 28,62 33,88 26,88 29,31 21,05 25,19 Junior_HS 13,7 9,33 18,04 19,93 11,77 12,34 15,94 13,1 14,31 13,37 Vocational JHS 1,08 0,51 0,74 0,46 0,53 1,05 0,86 0,99 0,78 0,77 Senior_HS 23,25 13,9 14,32 13,85 12,88 9,16 19,24 13,87 17,1 12,89 Vocational SHS 23,67 23,52 13,98 5,83 11,72 10,67 21,24 7,56 16,98 11,87 College 6,41 14,64 3,7 4,1 1,99 2 2,42 0,95 3,79 5,25 University 15,6 18,34 5,66 2,45 4,5 3,09 1,87 1,51 7,84 6,26 Total Banten No_Education 1,04 0,53 3,66 5,24 7,01 11,54 2,15 7,78 2,68 3,97 Pre-Primary 7,8 6,06 19,92 25,62 31,31 31,51 12,46 31,41 14,7 17,54 Primary 15,59 17,71 33,59 25,1 30,9 17,04 27,03 32,52 22,95 22,43 Junior_HS 16,06 18,5 15,17 16,81 11,25 4,85 30,02 11,29 15,69 15,38 Measuring the Informal Sector in Indonesia 37
38 Vocational JHS 1,29 0,41 2,2 3,39 0,76 3,68 3,89 1,59 1,55 1,48 Senior_HS 23 19,56 17,64 11,64 7,7 13,96 5,42 7,21 18,5 14,81 Vocational SHS 17,34 14,41 5,83 9,46 6,7 12,59 13,99 6,82 12,67 11,61 College 4,81 10,49 1,51 0,57 0,72 4,82 1,16 0,89 3,19 6,03 University 13,07 12,34 0,48 2,17 3,66 0 3,88 0,47 8,08 6,75 Total Notes: - See Table in Appendix 6 for absolute figures (frequency counts) - M male or men; F female or women; Junior_HS (Junior High School) is a level of schooling that act as a sort of bridge between primary school and high school which include grade 7 through 9; Vocational JHS (Vocational Junior High School) is the same level of schooling as junior high school in which students are taught the skill needed to perform a particular job or job-specific skills; Senior HS (Senior High School) which is known locally as Sekolah Menengah Atas and in other terms, Sekolah Menengah Umum which abbreviated as SMA and SMU is a level of schooling after junior high school which include grade 10 through 12; Vocational SHS (Vocational Senior High School) is one educational institution similar to and the same level as SMA, but they were focusing on one specific career major which is known as Sekolah Menengah Kejuruan or SMK. The survey results for the two provinces also validate the general notion that the higher the educational level the workers have, the more are their chances to be absorbed in formal jobs. In fact, In Yogyakarta, junior high school is the lowest level of education recorded among the own account wokers and employers under formal employment, at percent and percent, respectively. Meanwhile, more than half of the informal own account workers and employers did not even reach the junior high school level. In Banten, percent of formal own account workers at least completed primary school. Twenty six percent of the informally employed own account workers, on the other hand, did not reach primary school, while only 31.0 percent completed it. Hence, better education background seems to be more common among the formal than the informal self-employed (Table ). Table Employment by level of education, employment status, and nature of employment Education Level Yogyakarta Employees Own account worker Employment status Employer Unpaid family worker Total INF Formal INF Formal INF Formal INF INF Formal No_Education 1,16-5,72-11,11-12,77 8,23 - Pre-Primary 9,84 0,16 18,75-17,39-13,27 15,29 0,15 Primary 16,49 2,02 22,97-30,85-28,54 25,55 1,92 Junior_HS 16,84 4,53 18,73 48,34 11,72 23, ,01 5,58 Vocational JHS 0,54 1,36 0,63-0,70-0,95 0,71 1,29 Senior_HS 19,97 19,27 14,16-11,81 7,82 15,56 14,87 18,66 Vocational SHS 22,88 24,75 10,83-11,34 14,27 11,88 13,58 24,16 College 4,92 16,73 3,86-1,76 13,70 1,42 2,82 16,53 University 7,34 31,17 4,34 51,66 3,32 41,03 1,62 3,95 31,71 Total Banten No_Education 1,69-4,13-8,19-6,34 4,25 - Pre-Primary 11,99 2,13 21,68-31,74 14,09 26,56 20,53 2,25 Primary 23,53 8, ,15 28,28 8,72 31,12 27,73 8,96 Junior_HS 17,84 15,83 15,76-10,06-16,08 15,60 15,54
39 Vocational JHS 0,83 1,18 2,55-1,14 12,80 2,18 1,60 1,30 Senior_HS 15,84 28,27 15,96 18,98 8,70 26,13 6,75 13,26 28,18 Vocational SHS 12,20 20,82 6,89-8,18-8,66 9,38 20,44 College 5,58 7,88 1,26-1,40 11,42 0,96 2,86 7,86 University 10,50 15,31 0,77 20,87 2,32 26,85 1,34 4,79 15, Total The higher the educational level of workers, the lower the percentage to be an unpaid worker, in both provinces. For example, the proportion of jobs assumed by workers with very low educational background (no education and pre-primary) were percent in Yogyakarta and percent in Banten. On the other hand, workers with college/university level were less than 4.0 percent in both provinces, i.e percent and 2.3 percent in Yogyakarta and Banten, respectively. As a whole, workers who were informally employed tend to have lower educational background than those with formal jobs. Among the total number of formal jobs in Yogyakarta, percent are assumed by persons who completed their education at university, at college, whereas no worker formally employed had no education, 0.15 percent had incomplete primary school, and only 1.92 percent had complete primary education. In contrast, among those engaged in informal employment, only 3.95 percent had education at university and 2.82 percent at college. A bigger share is shown among the lower levels of education, namely 8.23 percent, with no education; percent, with incomplete primary; and percent of those informally employed completed primary education. Similarly, Banten showed the same pattern such that a higher percentage of formal jobs were assumed by workers with high educational background. Moreover, more informal jobs in Banten also employed workers with low educational attainment. For example, percent of informal employment engaged workers with incomplete primary education, and percent with complete primary level. In addition, people with no education, at 4.25 percent, were still able to work through informal employment Employment Conditions of Informal Employees It can be observed from Figure 2.16 that the proportion of informal wage workers 2 receiving benefits in Banten is higher than those in Yogyakarta. Furthermore, the figure also illustrates the advantage of formal employment over those who are informally employed in terms of the benefits received. The number of formal wage workers receiving benefits is generally more than twice that of the informal workers, in all kind of benefits analyzed. The most common benefit received by wage workers is the sick leave, regardless of whether they are formally or informally employed. For instance, 66.5 percent of formal wage workers in Yogyakarta received sick leaves, followed by the maternity leaves, at 66.3 percent, and the compensations upon termination of employment (severance pay), at 60.1 percent. Similarly, among the informally employed, 18.8 percent received the sick leaves, 15.1 percent, maternity leaves, and 11.8 percent received the paid leaves. In the case of Banten, 61.1 percent of those engaged in formal employment received sick leaves, next is the severance pay, at 51.7 percent, and the paid leaves, at 51.1 percent. On the other hand, 2 Composed of employees, casual employees in agriculture, and casual employees in non-agriculture in either the primary or other jobs. Measuring the Informal Sector in Indonesia 39
40 25.0 [percent of the informal wage workers received sick leaves, followed by maternity and paid leaves, at 21.0 percent and 19.7 percent, respectively. Figure Percentage of wage workers who receive benefits by nature of employment: Yogyakarta and Banten, 2009 a. Yogyakarta b. Banten % Formal Notes: ML = maternity/paternity leave; PL = paid leave; SL = sick leave; TC = termination compensation (severance pay). Table and Table present the number and percentage 3 of wage workers who received benefits. As mentioned earlier, the percentages of wage workers who received benefits are generally higher in Banten than in Yogyakarta. This is true, not only for informal workers, but for formal ones as well. Table Number of wage workers who receive benefits by nature of employment and sex Nature of Employment Yogyakarta Pension Fund Paid Leave (PL) Sick Leave (SL) Maternity/Paternity Leave (ML) Compensation Upon Termination Men Women Men Women Men Women Men Women Men Women Formal 72,689 39,050 93,261 54, ,879 62, ,613 60, ,338 54,849 Informal 14,554 8,874 36,778 35,835 61,607 53,459 43,705 49,109 35,282 27,638 Total 87,243 47, ,039 89, , , , , ,620 82,487 Banten Formal 181,146 99, , , , , , , , ,103 Informal 80,174 31, ,735 53, , , , , ,537 59,285 Total 261, , , , , , , , , ,388 Table Percentage wage workers who receive benefits by nature of employment and sex Compensation Upon Nature of Pension Fund Paid Leave (PL) Sick Leave (SL) Maternity/Paternity Leave (ML) Termination/ severance pay Employment Men Women Men Women Men Women Men Women Men Women Yogyakarta Formal Informal Total Banten Informal 60.1 Pension PL SL ML TC 10.3 Formal Informal Total % Formal Informal 51.7 Pension PL SL ML TC Percentage to total wage workers.
41 It is interesting to note that among those engaged in formal employment the number of men who received benefits is generally higher than that of the women s. This is the case in both provinces. On the other hand, the opposite is observed among the informal wage workers. The percentage of female informal workers 4 who received benefits is usually higher than the percentage of male informal workers 5 (Table ). Analysis of benefits received by sex showed that, in Yogyakarata, the men s top three benefits received are sick leaves (30.3%), maternity/paternity leaves (25.9%) and severance pays (24.0%). On the other hand, male wage workers in Banten generally received sick leaves, at 38.3%, paid leaves, at 33.8%, and severance pays, at 29.7%. The least common benefit received in the pension fund for both provinces. In terms of benefits received by women, the usual ones provided to workers in Yogyakarta are sick and maternity leaves, at 38.3% and 36.4%, respectively. The same trend is observed in Banten, when 42.8% of women wage workers received the sick leaves and 41.4% received maternity leaves Exclusion of Agriculture, Forestry and Fishing Informal employment analysis in the non-agricultural sector showed that in both provinces, formal enterprises generally provide informal employee jobs. This is true, whether the jobs are assumed by men or by women. In Yogyakarta, around 95 percent of informal jobs in formal enterprises were for employees, while in Banten, around 98 percent. On the other hand, informal self-employment is the general trend in informal enterprises, though these types of jobs were assumed more by men than by women. In Yogyakarta, 67.1 percent of the total male informal employment worked as either an employer or an own account worker, much higher than 46.1 percent posted by female informal employment (Table ). Banten exhibited the same pattern, with 59.2 percent and 35.7 percent of male and female employment, respectively. Table Informal employment by employment status, production unit and sex (excluding agriculture) Class of Workers Yogyakarta Production Unit Formal Enterprise Informal Enterprise Households Men Women Men Women Men Women Employees Own account worker Employer Unpaid_fw Total Banten Employees Own account worker Employer Unpaid_fw Total Data also showed that at least a third of the women in informal enterprises are unpaid family workers, specifically, 38 percent in Yogyakarta and 33.7 percent in Banten. These are 4 Percentage to total female informal workers. 5 Percentage to total male informal workers. Measuring the Informal Sector in Indonesia 41
42 greatly more than the 13.5 percent and 6.5 percent recorded among their male counterparts in Yogyakarta and Banten, respectively. In addition, while informal jobs assumed by men at the household production unit were still observed in Yogyakarta, they did not exist in Banten. These informal jobs are all for the self-employed. By excluding agriculture, forestry and fishing, the number of informal jobs in informal enterprises decreased from 2,208,006 to 1,995,333 in Yogyakarta and from 2,777,248 to 2,385,765 in Banten. This decline also brought a slight drop in the share of informal enterprises in providing informal jobs, from percent to percent in Yogyakarta, and from percent to percent in Banten. Table Informal employment by employment status and production unit (excluding agriculture) Class of Workers Yogyakarta TOTAL Percentage Formal Informal Household Formal Informal Household Employees 295, , Self_employed ,615 2, Employer 13, , Unpaid_fw 1, , Total 311,105 1,995,333 2, Banten Employees 1,093, , Self_employed 6, ,771 5, Employer 10, , Unpaid_fw 2, , Total 1,113,290 2,385,765 5, Employers registered the highest prevalence in informal enterprises in Yogyakarta, at percent, followed by the self employed (25.44 percent), unpaid family workers (24.21 percent), and employees (17.76 percent). A different trend was observed in Banten; informal enterprises in the province provided the most jobs to employees, at 33.0 percent, then the self-employed (32.0 percent), employers (18.9 percent) and unpaid family workers (13.2 percent). Based on Table , it can be observed that even for the non-agriculture sector the structure of job provision remains unchanged; that is, the number of jobs supplied by informal enterprises is higher than those provided by formal enterprises. Meanwhile, in terms of informal employment structure by employment status, the jobs in informal enterprises are relatively more distributed compared to the condition in formal enterprises.
43 CONTRIBUTION OF THE INFORMAL SECTOR TO GDP 3 Emerging views of the informal economy suggests that it has been consistently expanding with modern and industrial growth, providing goods and services to lower-income groups in most developing countries (Chen, 2007). It has continuously served as an important source of employment for over 50 percent of the global non-agricultural employment (ICMISIE), primarily attributed to high intensity labor production that informal sector is usually associated with. In DI Yogyakarta and Banten alone, as noted from the previous chapter, informal sector provides approximately 5 million jobs. Direct estimation of the contribution of informal sector has gained attention in recent years. ILO s Manual on Surveys of Informal Employment and Informal Sector argues that existing approaches on indirect estimation of the informal sector is limited by the fact that most of these procedures rely heavily on hypothetical assumptions. In addition, computing informal sector s contribution at disaggregated levels posts difficulty due to limited availability of detailed information on the production boundaries in the informal economy 6. Direct estimation, on the other hand, offers a good alternative tool towards adopting a sustainable approach for exhaustive compilation of national accounts. Its importance corresponds to the need for evidence-based reorientation of economic policies that will be more sensitive to the informal sector. This chapter discusses the estimated contribution of the informal sector to gross regional domestic product of the two pilot provinces using results from the informal sector survey. In addition, the section briefly describes the value added and labor productivity in the informal economy. 3.1 Industry The two provinces are fast growing economies in Indonesia. As of 2009, DI Yogyakarta is home to 3,501,900 residents while Banten s population is around 9,782,800. While the country s total output is growing at 4.93% on the average, Yogyakarta and Banten posted growth of 4.39% and 4.69%, respectively. Estimates for 2009 show that the per capita (total) gross valued added in Yogyakarta is Rp million while in Banten, it is estimated at Rp million. In particular, more than half of Yogyakarta's economy is driven by its four largest sectors: agriculture, hunting, forestry and fishery (15%), public administration and defense (14%), manufacturing (13%) and hotels and restaurants (12%). DI Yogyakarta is also known as the city of education due to the volume of educational institutions housed in the province. As the cultural center of Java, the province also draws 45,883 tourists who arrive at Adi Sucipto Airport, Yogyakarta every year. In addition, its economy is also supported by strong agriculture development and export-oriented production. On the other hand, Banten formerly a part of West Java, has been considered as a separate province in 2000 by virtue of Act No. 23. Banten's proximity to Jakarta has served as a strategic location for manufacturing and trade to flourish. The province houses the Merak port, one of the ports in Java island with the highest export volume in Indonesia. The manufacturing industry accounts for as much as 43% of its total gross value added, followed by wholesale retail trade's 17% in In general, Banten s factories and industrial sectors, accompanied by infrastructure, have continuously contributed to accelerating its economic growth. Recently, Banten has also started promoting eco-tourism spots such as the natural reserve, water tourism and Stone tourism situated in the province. 6 In this chapter, the GVA of formal** sector is computed as the residual of the total GVA less informal sector s GVA. Hence, the term formal** may span both the formal and household (whose production is only for own final consumption) sectors. Measuring the Informal Sector in Indonesia 43
44 Overall, preliminary survey estimates suggest that informal sector accounts for 37.3% and 26.6% of the total gross regional domestic product of Yogyakarta and Banten, respectively. Figures 3.1 and 3.2 depict the respective contribution of informal sector by industry for the two provinces. Figure 3.1 Formal** and informal contributions to GDP DI Yogyakarta Banten Informal % Informal % Formal** % Formal** % Figure 3.2 Contribution to GDP by sector and industry DI Yogyakarta Agriculture and Fishery Manufacturing Trade Other services Real Estate, other business Mining and quarrying Hotels and restaurants Transport, storage and comm Education and Health Construction Finance Electricity,gas and water Public Administration Banten Agriculture & Fishery Other Services Trade Hotels and Restaurants Real estate, other business Education and Health Construction Transport, storage and comm Manufacturing Finance Electricity, gas and water Public administation Mining and quarrying Formal** Informal Formal** Informal At a glance, Yogyakarta's informal enterprises are major players in the sectors of agriculture, forestry and fishery (AFF), manufacturing, and wholesale retail trade & repairs, accounting for more than half of its respective gross value added. In particular, these sectors already account for Rp trillion or percent of Yogyakarta s total informal sector s GVA. Noted to be relatively more industrialized than Yogyakarta, the bulk of gross value added among informal enterprises in Banten comes from trade, AFF, and hotels and restaurants, contributing Rp trillion or percent of Banten s total informal sector s GVA. Again, service-oriented sectors like electricity, gas and water, public administration, defense and social security, transport, communication & storage are comprised of mostly
45 formal enterprises in both provinces. Other capital-intensive sectors 7 like finance provide limited opportunities for entrepreneurial activity among informal enterprises, as these sectors require a larger pool of human and financial capital, a characteristic which informal Box discussion 3.1. A Snapshot on the Informal Economy in DI Yogyakarta and Banten Like other agriculture-driven economies, it is typical to see people in Yogyakarta working in rice fields, growing sugarcanes, tending their sheep or breeding buffalos. Traditionally, these activities are associated with households; but, as these units raise their production, it allows them to market their goods beyond own final consumption. Small scale (mostly informal) manufacturing enterprises transform the agricultural products into different commodities. A popular example is the batik which basically starts from an agricultural product (textile) and transformed into a beautiful piece of art. Famous around the world and even accorded as the Masterpiece of Oral and Intangible Heritage of Humanity in 2009 by UNESCO, the Indonesian batik is a cloth that uses manual wax-dyeing technique, sporting designs related to Javanese conceptualization of the universe or patterns that depict everyday life. In addition, Yogyakarta is also known to be the education and cultural center of Java, which in turn creates need for more affordable room rental, small cafeterias, laundry and other services for students; and souvenir shops (don t forget the batiks at Malioboro Street) for tourists. On the other hand, being strategically located near Jakarta, Banten attracts capital-intensive manufacturing industries that choose to construct their plants in the province for expected cost-savings. The list of typical manufacturing activities in the province includes manufacturing of basic iron and metal, chemicals and chemical wrapping. Hence, it is not surprising to note that informal economy in this sector is very small. However, the presence of these manufacturing plants which employ laborers and other elementary workers create a market for informal economy in food and other services and trade to flourish in Banten. 3.2 Agriculture and non-agriculture sectors In Yogyakarta, informal sector in agriculture contributed Rp 5.65 trillion or percent of its total gross value added, while informal sector in non-agriculture generated Rp 9.80 trillion or percent of GDP of non-agriculture. The fact that Yogyakarta s economy is based on agriculture is one of the reasons for high contribution of informal sector in agriculture. Yogyakarta s landscape, climate condition, and its reputation as one of the major food suppliers to the country are key factors that allowed agriculture to flourish as the dominant sector in this province. In Banten, informal sector in agriculture contributed Rp 9.8 trillion or percent of its total gross value added, while non-agriculture contributed Rp trillion or 21 percent of GDP of non-agriculture. It seems that, in Banten, informal sector engaged in non-agriculture production contributed more than those engaged in agriculture. Banten s economy is well known as buffer-zone for metropolitan area for Jakarta. In particular, although a number of large multinational companies headquarters are in the capital city of Jakarta, most of its factories are situated in Banten. Hence, it is not surprising that manufacturing industries exceed the contribution of agricultural sector in the province. Figure 3.3 Informal sector production in agriculture and non-agriculture sectors DI Yogyakarta Agriculture Non-agriculture Banten Agriculture Non-agriculture Formal** Informal 7 Construction industry in Yogyakarta has noted a relatively low contribution of informal sector (0.83 percent of its total gross value added). This may be due to the confusion in the HUEM-screening question, "do you sell goods or services," where a number of survey respondents engaged in the construction sector did not consider themselves to be selling their services. Measuring the Informal Sector in Indonesia 45
46 3.3 Labor Productivity This section investigates how productively labor is used to generate economic output among informal enterprises in Yogyakarta and Banten. Productivity measures reflect the joint influence of changes in capital, intermediate inputs, technical efficiency, economies of scale and capacity utilisation of enterprises (OECD Manual on Measuring Productivity). Productivity can be measured with respect to a variety of measures. For example, gross output based labor productivity measures labor requirements per unit of output while value added based labor productivity serves as an alternative measure which can be directly linked with existing income-based measures of living standards. For detailed comparison of these statistical measures, readers are referred to OECD Manual on Measuring Productivity. This section uses value added-based measure of labor productivity. Whereas total labor productivity is usually computed per worker, it is more straightforward to compute labor productivity in the informal sector by job. This is because a person may have multiple jobs; his first job is in the formal sector while the second is in informal. Consequently, it is operationally difficult whether to classify this person in the formal or in the informal sector. For comparability, all labor productivities provided in this section are expressed on a per job basis. Based from the 2009 survey results, total labor productivity (TLP), measured by the ratio of gross regional domestic product to total employment (i.e., total number of jobs), is Rp million per in Yogyakarta. In Banten, it is estimated at Rp million, more than two times Yogyakarta's. Although the concept of formal** sector in this chapter also accounts for the subsistence household production, it is not surprising to note that the labor productivity in the formal** sector exceeds that of informal sector by several fold. On the average, a job in Yogyakarta's formal** sector contributes Rp million value added in comparison to its informal sector counterpart's Rp 7.00 million. On the other hand, labor productivity in Banten's informal economy is Rp million per worker s job, about six times less than what an average job in the formal** sector contributed in 2009, amounting to Rp million. Labor productivity for informal sector in real estate, renting and business activities in Yogyakarta show the highest figure of Rp million; indicating the flourishing opportunities for informal players in tapping the market created by the city s famous landmark: education institution. The lowest labor productivity is in finance which recorded a figure of Rp 0.07 million, probably suggesting the steep competition posted by the existing players in this capital-intensive industry. Informal sector industry with the highest labor productivity in Banten was real estate and other business activities. Labor productivity in real estate recorded Rp million; it indicates that in Banten informal sector workers engaged in this industry are more productive compared with others industries. The lowest labor productivity occurred in finance with Rp 1.7 million.
47 Figure 3.4 Labor Productivity by Industry DI Yogyakarta's Labor Productivity by Industry Banten's Labor Productivity by Industry Agriculture, hunting and forestry Construction Educ and health Financial intermediation Hotels and restaurants Manufacturing Mining and quarrying Other services Real estate, renting, and business activities Transport, storage, and communications Agriculture, hunting and forestry Construction Educ and health Financial intermediation Hotels and restaurants Manufacturing Mining and quarrying Other services Real estate, renting, and business activities Transport, storage, and communications Wholesale and retail trade, repairs, etc. Wholesale and retail trade, repairs, etc Formal** Informal Formal** Informal Overall, the estimates provided in this chapter support the notion that informal sector accounts for a significant portion of the economy. After estimating the contribution of informal sector to its respective regional economy, the next chapter examines the characteristics of these informal enterprises. Measuring the Informal Sector in Indonesia 47
48 CHARACTERISTICS OF INFORMAL SECTOR ENTERPRISES 4 The estimates provided in the previous chapter support the notion that informal sector accounts for a significant portion of the economy. To understand the production behaviour of the informal sector better, this chapter examines the different aspects of the production behaviour of these enterprises. In particular, we will probe for answers on questions such as (i) between Yogyakarta and Banten, are there difference when it comes to what motivates people to engage in informal activities, (ii) where do they usually get financial resources from, (iii) what are the typical problems do these enterprises confront, among others. 4.1 Household Unincorporated Enterprise Producing Some Marketable Goods (HUEM) 8 Interestingly, it seems that HUEM operators tend to carry out business activities in the informal economy not necessarily because they want to maximize income, but because this is the only activity that they are more familiar of. This is consistent with the findings of Brooks et al (2010), such that those at the bottom part of the labor population are forced to make suboptimal choices to reduce income risks. Informal enterprises, most of which are associated to low-scale production and thus, more vulnerable to income, are less attracted by riskier entrepreneurial activities even though it promises higher future returns. Brooks et al. (2010) concluded that when the vulnerable part of the population discount the future, this can have a negative impact for the economy in the long run because investment decision at the household level are suboptimal. Such observation should guide policymakers in outlining programs that are more sensitive to the needs of the informal sector. For example, programs should be geared to improve the skills of these people and capacitate them to engage in more productive entrepreneurial activities. Details are provided in Figure 4.1 and Table 4.1. Figure 4.1. Reasons for establishment of HUEMs % Family tradition Profession Better income know n Yogyakarta Stable returns Banten Others The creation of HUEMs or engagements in these types of business activities are generally not motivated by the possible increase in income or the potential for having stable income sources. They the motivated by social norms, such as the family traditions and continuation of family practices, the reason most business owners in Yogyakarta cited; and the types of skills known by the owners, which is the more popular justification of HUEM owners in Banten What does this imply? This can mean that if the establishment of HUEMs will be supported, programs should concentrate on developing the skills of the workers, especially in Banten, since most of the HUEM owners say that they are in the activity because that is the only profession they know. Either programs can improve the skills of people in the existing 8 In the case of Indonesia, all HUEMs are considered as informal enterprises.
49 profession or widen the range of skills of workers so that they can venture to other lines of work. On the other hand, a different approach should be done for Yogyakarta since most of the HUEM owners established the HUEMs or are working in the activity due to family tradition. Table 4.1 Distribution of Reasons for establishment of HUEMs, by province Industry Family tradition Profession known Better income Stable returns Others Total YOGYAKARTA Agriculture Construction Education Finance Health Hotels Manufacturing Mining Other services TCS WRT Total BANTEN Agriculture Construction Education Finance Health Hotels Manufacturing Other services TCS WRT Total While family tradition seems to be the popular reason for setting up HUEMs in Yogyakarta, by industry analysis showed that it is actually only widely chosen in two industries, namely in agriculture (69.2 percent) and manufacturing (30.8 percent). The choice profession known was the most common answer of HUEMs in four industries: TCS, 66.3 percent; mining, 42.4 percent; other services, 42.1 percent; and hotels, 26.9 percent. Meanwhile, the following industries registered others as the most prevalent reason for the establishment of HUEMs: education, finance, health, and WRT. All of the HUEMs identified under construction cited better income as the driving force behind the business. The situation in Banten is clearly different from that in Yogyakarta. The HUEMs in all of the industries recorded profession known to be the most popular motivation among the owners, except for the finance industry in which 40.8 percent of HUEMs registered the reason family tradition. This suggests that HUEM owners in Banten are more skill oriented, thus, engage in businesses based on their expertise. Measuring the Informal Sector in Indonesia 49
50 On the other hand, the HUEM in agriculture, hunting and forestry industry in Yogyakarta posted the minimum revenue, of Rp million, and also the maximum, of Rp 1.1 trillion. However, it should also be noted that this is also the industry where a large portion of the production is allocated for the household food consumption; thus the revenue reported in the survey does not necessarily reflect the production output of the HUEM. Thus, generalization using the revenue data of HUEMs should be done with caution, especially concerning the agriculture sector. In Banten, the least revenue was recorded by a HUEM in others industry, which only reached Rp 29 million. Meanwhile, a HUEM in manufacturing reported the highest revenue, of Rp 2.05 trillion. The industry with the least intermediate costs in Yogyakarta was the other community, social and personal services, with a HUEM that reported a cost of Rp 2 million. In Banten, the HUEM in the others industry posted the lowest cost, of Rp 7 million. On the other hand, wholesale and retail trade, repairs, etc industry in Yogyakarta and manufacturing industry in Banten registered the highest intermediate costs incurred by HUEMs, of Rp 686 billion and Rp 1.68 trillion, respectively (Appendix Table 4.1). 4.2 Financing and other support structures It is generally accepted that the existence of an efficient financial sector contributes positively to poverty reduction by expanding the access of poor and vulnerable segments of the population to credit (Brooks et al. 2010). Indirectly, doing so allows the poor to contribute to economic growth. Based from the survey results, HUEM s utility of credit schemes are limited primarily because its accessibility is limited as well. In particular, majority of the HUEMs did not apply for a bank loan; percent in Yogyakarta and percent in Banten. Geographically, in the urban areas, percent of the total number of HUEMs did not apply for a bank loan in Yogyakarta; percent in rural areas. In Banten s urban areas, percent did not apply for bank loan, percent in rural areas. For HUEMs in Yogyakarta, the main reason cited for not getting a loan is not interested 9, at (24.6 percent), while in Banten, the complicated procedures associated in getting loans hinder 35.1 percent of HUEM owners in applying for one. Table Access to credit FINANCE Yogyakarta Banten Applied for a bank loan Yes No Successful in getting loan from the bank? Yes No Why never applied for a loan? Complicated procedure High interest rate Too much collateral The reasons why these HUEMs in Yogyakarta are not interested to avail of bank loans is open for further investigations. For instance, it may be just a reflection of the lack of financial institutions that offer loans with minimal interest rates.
51 Loan does not correspond to needs Not interested Not needed Others Other than bank services, do you know any microfinance services? Yes No Applied for a loan not from banks Yes No Successful in getting loan? Yes No Other source of credit beside bank loan is microfinance services. There were 49.5 percent of HUEMs in Yogyakarta and 25.9 percent in Banten who were aware of (the existence) microfinance services. On urban-rural perspective, 59.1 percent of HUEMs in urban areas of Yogyakarta knew of microfinance services; while in rural areas the level was 42.5 percent. In Banten, only 24.6 percent were aware in urban areas, and 27.7 percent in rural areas. Of those who were aware of microfinance, 78.9 percent reported to have known it through word-of-mouth in Yogyakarta; and 62.2 percent in Banten. These results already present a number of possible public and private sector interventions to assist HUEMs or other small businesses acquire financial sources. One avenue that can be pursued is the discovery of the reason why HUEM owners in Yogyakarta are more aware of the micro-finance services available to them, than the ones in Banten. This situation is true regardless whether the area is urban or rural; the same condition is observed. On the other hand, information on other financial sources has spread among the target audience through the word of mouth or recommendation of peers. It is apparent that the traditional personal passing of news among people is the most effective approach to inform them. Thus, while further studies still need to be conducted, strategies can also be formulated around this type of information dissemination for a better reception of the target participants. Table Distribution of HUEMs by reason of not applying for loan; by reason for loan rejection (%) For sources other than banks Why not apply for a loan? Yogyakarta Banten Loan amount insufficient Complicated procedures High interest rate Short maturity Too much collateral Not needed Do not believe in paying interests Others Measuring the Informal Sector in Indonesia 51
52 Reason for loan rejection? Incomplete documents Complete but not convincing documents Insufficient collateral Insufficient initial capital - - Activity/enterprise was deemed not viable - - Others On the other hand, the survey results also provide snapshot on the perceived impact of loans on business activities. In particular, it is interesting to note that among those who obtained loan from any other source, it seems that more HUEM operators from Yogyakarta experienced positive impacts of loans on their respective business activities. For example in Yogyakarta, around 62.6 percent reported an increase in the volume of production with the help of loans, only 12.2 percent said so in Banten. The following table summarizes the results. Table Distribution of HUEMs by impact of loan on their business activities (%) Impact of loan on business DI Yogyakarta Banten 1. Increase in the volume of production Diversification of production Increase of the volume of sales Improvement of competitiveness / profitability Recruitment of additional staff Working less time Utilisation of less staff Financial difficulties Other Problems and prospects HUEMs face diverse problems and difficulties in operating their business which are summarized in Table 4.5. The chief problems of HUEMs are related to capital, inputs to production, and marketing of products. HUEMs in Yogyakarta reported their main concerns to be: advertising of new products and services (37.3 percent), financial difficulties such as getting loans (31.0 percent), and the lack of space and the supply of raw materials which were cited by 25.7 percent and 23.2 percent of HUEM owners, respectively. On the other hand, HUEMs in Banten were faced chiefly with financial difficulties (54.9 percent), product sales problems like too much competition, (46.3 percent), and the concerns over the lack of customers (45.0 percent). Table Distribution of HUEMs by type of encountered problems (%) Problems DI Yogyakarta Banten 1. Supply of raw materials (quantity or quality) Sales of products - lack of customers Sales of products - too much competition Financial difficulties (e.g., difficult to get loan) Lack of space, adapted premises lack of machines or equipment Organization, management difficulty
53 8. Too much control, taxes Advertising of new products, services Others The HUEM owners in Banten recorded more yes answers to the queries on the type of assistance they would like to receive than those in Yogyakarta Figure 4.2. Different interpretations can be devised from these results and such assumptions can be used in designing assistance programs extended by both private and government agencies. It is significant for these plans to include how to approach the intended beneficiaries hence, their behaviors should also be taken into consideration. Figure 4.2 Type of Assistance Needed by HUEMs Notes: 1 - Technical training; 2 - Training in organizational and financial management; 3 - Assistance in obtaining supplies;4 - Access to modern machines; 5 - Access to loans; 6 - Access to information on the market; 7 - Access to large business orders; 8 - Registration of business; 9 - Advertising of new products/services; 10 - Others The primary types of assistance identified by the HUEM owners in both provinces are consistent with most of the main problems cited, which are capital and production related issues. The top three items chosen by the respondents are the same in both provinces, though with difference in priorities. The ones located in Yogyakarta named the following as their main concerns -- assistance in obtaining supplies (30.1 percent), access to loans (22.9 percent), and access to information on the market (19.1 percent). On the other hand, the chief assistance identified by the 57.0 percent of owners in Banten was the access to loans, followed by assistance in obtaining supplies (35.9 percent), and access to information on the market (32.2 percent). Meanwhile, it is interesting that while advertising of new products and services was the most common problem in Yogyakarta, the assistance on advertising was chosen by only a minimal 3.4 percent of the respondents. Furthermore, these results show that registration of their businesses is the least of the concerns of HUEM owners in Yogyakarta and Banten. It is interesting to note that while less HUEMs in Banten reported to have experienced positive impacts of loans on their business activities compared to Yogyakarta, a significant number of them reported to have been helped by the professional organization from which they belong to, in different difficulties. Measuring the Informal Sector in Indonesia 53
54 Table Distribution of HUEMs by type of difficulties for which the organization has helped (%) Difficulties DI Yogyakarta Banten 1. Technical training Training in organizational and financial management Assistance in obtaining supplies Access to modern machines Access to loans Access to information on the market Access to large business orders Problems / linkages with government Litigation with the competitors Security problems Interactions with employees Other 16.51
55 5 INSTITUTIONALIZING INFORMAL EMPLOYMENT AND INFORMAL SECTOR STATISTICS This chapter presents the recommendations for institutionalizing the generation of the statistics on informal employment and informal sector. It discusses the relevance of informal employment and informal sector to Indonesia, and consequently the significance of producing the related statistics. It also explains the process by which the data can be regularly collected and the planned integration of the informal employment and informal sector among the official statistics released by the BPS Statistics Indonesia. Results of the pilot ISS in Yogyakarta and Banten confirmed the significance of informal employment and informal sector in the economies of the two provinces. Even if the Yogyakarta and Banten exhibit different levels of economic development, informal employment is still prevalent in both of their labor markets. Meanwhile, the informal sector is vital in agriculture of Yogyakarta and in the trade industry of Banten. If these results may be representative of the Indonesian economy, as one of the developing countries, Indonesia, therefore, may also be characterized by sizable informal employment and industry specific high economic contribution of the informal sector. Competition among the labor force to engage in formal employment is very high. Thus, only those highly skilled are expected to be able to engage in formal employment and reap the benefits provided by it. On the other hand, those with low skills and especially with low educational background are likely to be employed informally hence, are receiving relatively lower incomes and fewer benefits. However, while formal employment presents better opportunities to the employed population, informal employment provides the needed income to most of them. Therefore, the informal sector plays an important role in running the Indonesian economy, and its existence increases the chance of the poor in the labor market. It creates an alternative employment for production and income generation. Due to a high rate of population growth or urbanization in Indonesia, the huge labor force, especially in urban areas, can be absorbed in the labor market through informal employment. On the other hand, in order to survive, the poor tend to be involved in any kind of activity even if a job is characterized by a very low wage, irregular working time, uncertainty in job tenure and the like conditions. Hence, with the linkages between informal sector and the poor, it is important to learn more about the different aspects of the sector like its production processes, the social, economic, and demographic characteristics of its employment population, and the enterprises that compose it. Given these, policy makers should take the informal employment and informal sector conditions into account especially with regard to regulations and policies that aim to improve the working conditions and legal and social protection of persons employed in the informal economy; to increase the productivity of informal economic activities and the like. With the results of the ISS and the corresponding estimates based on the data, the policy makers would have sufficient knowledge on the size and characteristics of informal employment and the informal sector in the country for an informed decision-making. With a high poverty rate, the government of Indonesia, especially those who formulate the pro-poor policies should also support the informal sector by providing the informal enterprises the needed access to credit, labor skill development, among others. Based on the key role of the informal employment and informal sector in supporting the macro-economy of the country as a whole, the need for statistics has become more important in order to asses the contributions of all workers, women in particular or those with Measuring the Informal Sector in Indonesia 55
56 low level of education, to the economy. These statistics, however, are not regularly provided due to limited information supplied by the regular labor force survey (Sakernas). The Sakernas questionnaire, since it is designed primarily to collect and estimate the employed and unemployed population, does not contain many questions that can classify workers as being engaged in formal or informal work. In fact, based on the combination of employment status and occupation variables, BPS-Statistics Indonesia could identify informal employment. Hence, these are the set of statistics on the informal sector that are published by BPS-Statistics Indonesia. Because of the sparseness of statistics on informal employment, Indonesia s informal sector has not benefited from well-informed policies that will eventually mainstream the informal workers into the formal sector, provide social protection, and enhance their productivity. Thus, in order to generate the needed statistics and for BPS-Statistics Indonesia to have a regular-officially published statistics on informal sector, the Sakernas can be administered together with the ISS Form 1. With this, BPS-Statistics Indonesia may provide better statistics on informal employment and informal sector on a regular basis for both the policy-makers in the government of Indonesia and the decision-makers in the private sector of the economy. In addition to the employment statistics, the ISS also provides information on the economic contribution of the informal sector to the GDP through the ISS Form 2 or the HUEM survey. While informal employment is more notable than the share of the informal sector production to the whole economy, the sector s significance is magnified in the individual provincial economies. The informal sector s economic production, in fact, is more significant in less industrial and the more predominantly agriculture areas. Institutionalizing the collection of informal statistics, through the more frequent and regular conduct of an ISS, would generate the needed labor and economic statistics. Hence, instead of modifying the LFS and integrating in it the queries in ISS1, BPS-Statistics Indonesia plans to adopt the complete ISS conducted in Yogyakarta and Banten. This means that not only will the ISS Form 1 be administered, but the ISS Form 2 will also be carried out. Moreover, the agency intends to extend the coverage of the survey by enlarging the number of census block sample. The idea is to continue the survey design administered during the pilot ISS, that is, with the Sakernas and the ISS being separate surveys are linked together, while the pilot ISS was funded by Asian Development Bank (ADB) under RETA 6430 project, the first national ISS, which will also be simultaneously administered with the Sakernas will be carried out in August 2011 and will be funded by the government. This survey will cover more or less 25,000 households in census blocks across the country and will cover all 33 provinces in Indonesia. This plan aims to provide statistics on the informal employment and informal sector in the national level. BPS-Statistics Indonesia is in full support of the ISS endeavor and originally would like to implement the national ISS in 2010; however, the 2010 Population Census forces BPS-Statistics Indonesia to delay the survey until Thus, the ISS Form 1 questionnaire, as used in the pilot ISS in Yogyakarta and Banten, will be administered with the 2011 Sakernas. The BPS-Statistics Indonesia plans to change the design of Sakernas, from two rounds in 2010 to a quarterly survey in However, the national ISS may not be administered as frequent as the 2011 Sakernas and will only be carried out in August Thus, the 2011 ISS census blocks will be subsample of the 2011 Sakernas third quarter. Once this survey is realized, the official statistics published by BPS-Statistics Indonesia will now also include the statistics on the informal employment and informal sector. Through this survey, BPS-Statistics Indonesia will also be able to estimate the contribution of the informal sector to GDP more accurately and determine who among the employed population are informally employed. If in the future, the ISS Form 2 or the HUEM survey will
57 able to be implemented continuously, the contribution of the informal sector to GDP will be easily estimated. But if the regular conduct of the HUEM survey is not possible, the BPS- Statistics Indonesia will use the estimates from the 2011 August Sakernas as the benchmark data and continue the measurement of the GVA of the informal sector using small scale enterprise data and the labor productivity statistics and other characteristics of the informal employment in the estimation process. Table 5.1 Summary of Recommendations Modification Justification Relevance 1. More intensive training of the enumerators who will conduct the ISS, through better and more clear explanations of the concepts, especially in relation to the customs and norms in Indonesia. 2. Incorporation of ISS Form 1 questions in Sakernas for the expanded (LFS) Sakernas or an annual ISS Form 1 survey administered with the Sakernas 3. Periodic conduct of ISS Form 2 or HUEM survey 4. Involvement of the national accounts personnel Experience from the Pilot ISS showed that due to misinterpretation of questions, some of the data collected were inconsistent (see Appendix 4). Particularly, more explanation on the type of enterprise (question 17) query must be provided since the question is a newly introduced concept. Also, the observed confusion that may have occurred in interpreting the questions on 1) selling of products and services (question 27) and 2) type of contract (question 7), suggests that training of enumerators must be improved. It has been seen that generating informal employment statistics is significant for Indonesia. Modifying the Sakernas questionnaire to incorporate the informal employment-related queries will ensure that the necessary data to produce these statistics will be available. Less cost will be incurred if the ISS Form 1 questions will be integrated with the Sakernas questionnaire forming the expanded LFS. The additional questions will only extend the interview time for a few minutes. If the incorporation of the ISS questions in the Sakernas questionnaire is not possible, the annual ISS Form 1 and Sakernas survey operations can be carried-out simultaneously. ISS Form 2 or the HUEM survey is expensive to carry-out annually. Hence, a three-year or a five-year interval between the HUEM surveys can lessen the costs and ensure the continuity of reliable statistics on the contribution of the informal sector to the whole economy of Indonesia. During the years without the HUEM survey, the results of the expanded Sakernas or the annual ISS Form 1 can be used to estimate the growth of the sector. This can be done through a methodology that establishes the links between informal employment and the output of the informal sector. Experience from the pilot ISS in Yogyakarta and Banten showed that Better understanding of the enumerators of the concepts, especially of the key questions, will avoid confusion of the respondent in answering the queries. This will lessen the inconsistencies in the data collected. If the informal employment queries are added in the Sakernas questionnaire or the ISS Form 1 be administered with the Sakernas annually, regular estimates of informal employment may be produced. Moreover, the annual statistics in informal employment can be used to estimate the growth in informal sector production, which can then be applied to the 2011 benchmark estimate of the contribution of the informal sector to GDP. A regular conduct of the ISS Form 2 or HUEM survey will guarantee an updated set of data that will determine the economic contribution of the informal sector. Through updated statistics, the changes in the sector can be captured and the effects of the policies and regulations on the production of the sector can be monitored. These statistics will present the evidence on whether the policies have improved the economic performance of the sector and the workers which rely on it. Better set of data can be collected if national accounts staff will be Measuring the Informal Sector in Indonesia 57
58 in the enumeration process of ISS Form 2 or HUEM survey while ISS Form 1 can be administered by the regular enumerators, the ISS Form 2 needs a specialist with knowledge on national accounts in the enumeration process. ISS Form 2 is primarily used in the estimation of the national accounts, hence, the data collected should be the kind that will be useful in the estimation. However, computing for the economic output is a complicated process and enumerators who will administer the questionnaire would need some knowledge regarding this process. The presence of the national accounts personnel during the survey can help in improving the quality of the data collected. He/she can guide the enumerators in the correct manner by which to ask the questions and help them understand the useful data that need to be gathered from the survey. present in the enumeration process of the ISS Form 2. The benefits of the participation of a national accounts personnel are: 1) correct classification of HUEMs to their industries in the context of national accounts estimation; 2) better levels of sales, inventories, costs can be gathered since the questions will be correctly asked from the HUEM owners; and the like.
59 SUMMARY AND CONCLUSIONS Summary of Main Results The results of the 2009 informal sector survey in Yogyakarta and Banten show that informal employment for these two provinces are 81.9 percent and 75.9 percent, respectively. Yogyakarta, which is less industrialized between the two, presented a larger dependence on informal employment than Banten. This implies that jobs in less developed areas are more informal. Still, the predominance of informal employment, measured by the number of jobs, despite the difference in their levels of economic development is apparent and supports the conclusion that the labor market in these two provinces is dominated by informal employment. These are also indications that considering the similarity of Banten and Yogyakarta to other provinces in Indonesia, informal employment is prevalent in most of Indonesia. Results also showed that formal enterprises, and not only informal enterprises, create informal employment. In Yogyakarta, for example, there are 103,642 (30.7 percent) out of 337,196 jobs under informal employment. The same is observed in Banten wherein as much as 32.7 percent of the jobs in formal enterprises are informal. Meanwhile, data from both provinces showed that all jobs in the households are informal. As a whole, persons who are informally employed tend to have a lower education level than those with formal jobs. The lower the level of education the workers have, the bigger the opportunity to be absorbed in informal jobs. Workers in formal employment receive significantly better wages than those in informal employment and male workers are better of than their female counterparts who are more likely to involve in informal jobs. In terms of Gross Regional Domestic Product (GRDP), estimates present the share of the informal sector in the economic output of Yogyakarta to be percent. On the other hand, the contribution of informal sector in the production in Banten is smaller, at percent. As mentioned earlier, Banten is more industrialized between the two provinces and is the seat of many large scale enterprises, both domestic and foreign. Hence, the larger extent of the manufacturing production and provision of services are from formal enterprises. The informal sector showed a higher percentage share in the output of urban than in rural areas. Out of the total Rp trillion Yogyakarta's GRDP, the informal sector GVA or urban areas reached Rp trillion or percent. Meanwhile, percent of the output in Banten was produced by the informal sector located in urban areas. In terms of non-agricultural production, the share of the informal sector is percent of nonagriculture GRDP in Yogyakarta, lower than the registered share in Banten, at 20.9 percent. The informal sector posted a percent share in the agricultural production of Yogyakarta, greater than its contribution in the non-agriculture sector. By contrast, the informal sector is more significant in non-agriculture than agriculture in Banten. While the non-agriculture informal sector contributes 20.9 percent of the production, percent of the agricultural production is from the informal sector. These results show that in terms of economic production, as measured by the GRDP, the share of the informal sector is much less that that of the formal sector. However, with regard to jobs, informal employment is a vital source of income to the employed population. Measuring the Informal Sector in Indonesia 59
60 6.2 Importance of Measurement Informal Employment and Informal Sector This study has provided concrete evidence that the informal sector contributes substantially to the nation s outputs and that informal employment is an integral part of the labor market. The analysis in the report provides policy makers and the development community a clearer picture of the state of the labor market, the access of workers to various social protection instruments and the conditions of informal enterprises. If this data collection approach can be further refined and periodically conducted across all the provinces of Indonesia, then existing policies on the labor market and enterprises can be regularly reviewed and adjusted if necessary, to promote decent jobs for all and consequently, inclusive growth. 6.3 Other Issues The informal sector survey under RETA 6430 project only covered two out of 33 provinces in Indonesia. The results of the survey, therefore, are only capable of describing the situation of the informal sector and informal employment in the provinces of Yogyakarta and Banten. While the estimates generated for the two provinces provided a glimpse of the situation for the whole of Indonesia, a more concrete national data would be a better set to represent the situation for the whole country. While the informal sector survey proved to be generally successful in the two pilot provinces, there are still many enhancements that can be done in future surveys. As to be expected from a pilot survey, there were many data inconsistencies in the ISS which were observed from various phases of survey design and operations from the design of the questionnaires, to field operations to data encoding and processing. Some of the questions in the ISS Forms 1 and 2 were not formulated in accordance to the customs and norms in Indonesia which caused confusion during the survey interview process. Having a written contract, for example, is not commonly used by the civil servants or armies as they will automatically receive an official letter from the beginning they enter the jobs and will last until they retire, and they never call it as contract. Also, some of the critical items in the questionnaires may not have been properly explained by the enumerators, thus, the misinterpretation of the respondents of the queries. Moreover, data inconsistencies also resulted because of the different data processing procedures of the informal sector survey and the Sakernas. The Sakernas data were encoded in the regional offices, while the informal sector questionnaires were sent to the headquarters office to be encoded. Thus, the place to entry data is different. Consequently, during the linkage process between the Sakernas and the ISS if there was something wrong in either of the questionnaires, it was difficult to correct either Sakernas form or ISS form in order to make them consistent. In addition, the informal sector survey is the first survey from the social statistics point of view that uses the concepts of the national accounts, like the Gross Value Added (GVA), inventory, intermediate input and so forth. Thus, it was very difficult for the enumerators to ask several questions related to the national accounts, thereby affecting the quality of data collected from the ISS Form 2 or the HUEM survey questionnaire. It would have been better if ISS Form 2 was administered by enumerators trained in conducting establishment/enterprise surveys.
61 RECOMMENDATIONS 7 Reliable and timely data on critical issues strongly support evidenced-based policy making. A good example of this is the informal sector survey in the two pilot provinces. The general perception that informal employment is prevalent is validated by reliable statistics. More importantly, in addition to being able to quantify the size of the informal economy, the survey data also enable researchers to undertake more in-depth studies on the determinants and constraints in the informal economy. Policy makers and concerned government agencies as well as the general public will have more data and information regarding the informal sector and informal employment. It is therefore imperative that the informal sector survey be institutionalized in the Statistics Indonesia s system of household surveys. The cost-effective data collection strategy that was implemented in the two provinces calls for the first phase of the survey to be undertaken as a rider to the Sakernas. In the long term, it will be more efficient if this first phase be fully integrated in Sakernas so that data processing issues as described in the previous chapter of this report will be eliminated. The second phase of the informal sector survey which deals with informal sector production units, can be undertaken every two to three years, depending on the availability of the budget. In the intervening years of the second phase, estimates on the contribution of the informal sector to GDP can be derived using results on the first phase or the expanded Sakernas. The institutionalization process of the informal sector survey will begin in August 2011 which covers all 33 provinces in Indonesia. It will be the first official informal sector survey done by BPS-Statistics Indonesia. Before August 2011, Statistics Indonesia should review the questionnaires that were used in the two pilot provinces and revise them accordingly. The views of all those who were involved in the pilot survey should be consolidated to improve the questionnaires and also, the field operations and data processing. For example, based on the result of the pilot informal sector survey done in Yogyakarta and Banten, several questions on the questionnaire should be revised because they were misunderstood by the enumerators. The phase 2 questionnaire (HUEM Survey), must be reviewed to make it more userfriendly and to ensure that concepts and definitions needed to derive the contribution of the informal sector to GDP are used properly. For example, rice is classified under the agriculture sector in the phase 2 questionnaire but in national account concept rice is a product of food manufacturing industry. National accountants in Statistics Indonesia should lead the review process but this activity should be done by a multi-disciplinary team that includes experts in questionnaire design, sampling design, survey operations and labor and employment statistics. The sampling design when adopted for national coverage should also be reviewed to ensure that all economic activities are adequately represented in the sample and that the design effects at the national accounts sector level do not go beyond the acceptable limit. Some of the data inconsistencies that occurred in the pilot survey can be attributed to the lack of knowledge of enumerators in the concepts and definitions that were in the phase 2 questionnaire, which is very similar to a standard establishment survey. Hence, decision on whether to use enumerators who are already familiar with establishment surveys for the phase 2 of the informal sector survey or to offer more intensive training to the enumerators of Sakernas to improve their performance will have to be undertaken by Statistics Indonesia s management. Measuring the Informal Sector in Indonesia 61
62 Another source of data inconsistencies was the different data processing centers used for the informal sector survey and Sakernas. Since phase 1 of the informal sector survey is recommended to be fully integrated in Sakernas, data processing for phase 1 should be done by the same entity that processes Sakernas to reduce data inconsistencies, whether it be the Statistics Indonesia s provincial office or the central office. Data validation rules should be established with the help of labor statisticians for phase 1 and national accountants for the phase 2 of the informal sector survey. A data dissemination plan should be developed in order to convey these very important set of statistics to the public on a timely basis. The survey data should be shared with researchers to support evidenced-based policy making.
63 APPENDIX 1. CONCEPT AND DEFINITIONS Concepts and Definitions used in Sakernas to identify labor characteristics according to the field enumerator guidance of the 2009 Sakernas are as follows: 1. Working: an activity done by a person who worked for pay or assisted others in obtaining pay or profit for the duration at least one hour during the survey week. Include an unpaid worker who helps an economically activity/ business. 2. Educational attainment: the highest educational level completed by a person, verified with the receipt of a diploma or a letter of completion/certificate. 3. Industry: refers to the activity of the place of work/company/office in which a person is employed, classified according to the Indonesian Standard Industrial Classification (KBLI) Occupation: refer to the type of work carried out by a particular respondent, classified according to the KBJI 2002 which referred to ISCO Employment status is the status of a person at the place where he/she works. There are seven different categories: a. Own-account worker is a person who works at her/his own risk without assisted by paid per mount worker or unpaid worker include technical job or skill job. b. Employer assisted by temporary workers/unpaid worker, a person who works at her/his own risk and assisted by temporary worker/unpaid worker. c. Employer assisted by permanent workers/paid workers, is a person who his /her business at her/his own risks at least one assisted by paid permanent worker. d. Employee, is a person who work permanently for other people or institution/office/company and gains some money/cash or goods as wage/salary. Labor who have no permanent employer is not categorized as a laborer/worker/employee but casual worker. A laborer, in general is considered to have a permanent employer if he has the same employer during the past month, particularly for building construction sector is 3 months. If the employer is an institution, more than 1 (one) is allowed. e. Casual employee in agriculture is a person who does not work permanently for other people/employer/ institution (more than 1 employer during the last 1 month) in agricultural sector either home industry or not home industry based on remuneration paid with money or goods, and based on daily or contact payment system. Agricultural industry covers food-based agricultural, plantation, forestry, livestock, fishery, hunting, including agricultural services. Employer is a person who gives a job with an agreement payment. f. Casual employee not in agriculture, is a person who does not work permanently for other people/employer/ institution (more than 1 employer during then past 1 month) in non agricultural and gets money or goods as wage/salary either based on daily or contract payment system. Those sectors include non agricultural sector: mining, manufactures, electricity, gas and water; construction, trade; transportation, storage, and communication; financing; insurance, real estate, and business services; community, social, and personal services. g. Unpaid worker is a person who works for other people without pay in cash or goods. Those unpaid workers could be: 1. Family member who works for another person in their family i.e.: wife or child who helps their husband or father works in field. 2. Not a family member who works for another person but still having family relations, such as those who help their family relatives to sell in a minimarket. Measuring the Informal Sector in Indonesia 63
64 3. Other persons outside of family members nor family relatives who work for another person, such as a person who weaves hats for their neighbors home industry. Concepts and Definitions for Informal Employment (Discussions were lifted from the ADB Handbook ) For an internationally comparable definition of informal employment in Indonesia, classification of the employed population was primarily based on the Fifteenth (15 th ) and Seventeenth (17 th ) International Conference of Labor Statisticians (ICLS) guidelines. The 15 th ICLS conceptualized the informal sector as: (1) The informal sector may be broadly characterized as consisting of units engaged in the production of goods or services with the primary objective of generating employment and incomes to the persons concerned. These units typically operate at a low level of organization, with little or no division between labor and capital as factors of production and on a small scale. Labor relations - where they exist - are based mostly on casual employment, kinship or personal and social relations rather than contractual arrangements with formal guarantees. (2) Production units of the informal sector have the characteristic features of household enterprises. The fixed and other assets used do not belong to the production units as such but to their owners. The units as such cannot engage in transactions or enter into contracts with other units, nor incur liabilities, on their own behalf. The owners have to raise the necessary finance at their own risk and are personally liable, without limit, for any debts or obligations incurred in the production process. Expenditure for production is often indistinguishable from household expenditure. Similarly, capital goods such as buildings or vehicles may be used indistinguishably for business and household purposes. (3) Activities performed by production units of the informal sector are not necessarily performed with the deliberate intention of evading the payment of taxes or social security contributions, or infringing labour or other legislations or administrative provisions. Accordingly, the concept of informal sector activities should be distinguished from the concept of activities of the hidden or underground economy. According to the 17 th ICLS final report, "since the adoption of the resolution concerning statistics of employment in the informal sector by the 15th ICLS in 1993, and the inclusion in the System of National Accounts, 1993, of the 15th ICLS informal sector definition, it had been recommended by the Expert Group on Informal Sector Statistics (Delhi Group) and others that the definition and measurement of employment in the informal sector should be complemented with a definition and measurement of informal employment". Hence, the conceptual framework on informal employment developed by the International Labour Organization (ILO) linked the enterprise-based concept of employment in the informal sector with a broader, job-based concept of informal employment (Appendix Figure 1). As a result, clear delineations among 1) employment in the informal economy; 2) informal employment; 3) employment in the informal sector; and informal employment outside the informal sector were established. While the concept of informal sector refers to production units as observation units, the concept of informal employment refers to jobs as observation units. The framework above also applied the, for the purpose of statistics on informal employment, 15th ICLS resolution that excludes households employing paid domestic workers from informal sector enterprises, and to treat them separately as part of a category named households. On the other hand, informal employment comprises the total number of informal jobs whether carried out in formal sector enterprises, informal sector enterprises, or households, during a given reference period. Appendix Figure th ICLS Conceptual Framework on Informal Employment
 own-account workers and employers employed in their own informal sector enterprises (cell 3 and 4) - The employment situation")
65 Sources: 17 th ICLS Final Report and Hussmann, R. 2004a. Hence, given the conceptual framework, informal employment includes: (i) own-account workers and employers employed in their own informal sector enterprises (cell 3 and 4) - The employment situation of own-account workers and employers can hardly be separated from the type of enterprise, which they own. The informal nature of their jobs follows thus directly from the characteristics of the enterprise. (ii) contributing family workers, irrespective of whether they work in formal or informal sector enterprises (cells 1 and 5) - The informal nature of their jobs is due to the fact that contributing family workers usually do not have explicit, written contracts of employment, and that usually their employment is not subject to labour legislation, social security regulations, collective agreements, etc. (iii) members of informal producers cooperatives (cell 8) - The informal nature of their jobs follows directly from the characteristics of the cooperative of which they are members. (v) employees holding informal jobs in formal sector enterprises, informal sector enterprises, or as paid domestic workers employed by households (cells 2, 6 and 10) - Employees are considered to have informal jobs if their employment relationship is, in law or in practice, not subject to national labour legislation, income taxation, social protection or entitlement to certain employment benefits (advance notice of dismissal, severance pay, paid annual or sick leave, etc.) for reasons such as: no declaration of the jobs or the employees; casual jobs or jobs of a limited short duration; jobs with hours of work or wages below a specified threshold (e.g. for social security contributions); employment by unincorporated enterprises or by persons in households; jobs where the employee s place of work is outside the premises of the employer s enterprise (e.g. outworkers without employment contract); or jobs, for which labour regulations are not applied, not enforced, or not complied with for any other reason. (vi) own-account workers engaged in the production of goods exclusively for own final use by their household (cell 9). The framework also presents the important information of informal employment outside the informal sector which is comprised by the following types of jobs: (i) employees holding informal jobs (as defined in paragraph 3(5) above) in formal sector enterprises (cell 2) or as paid domestic workers employed by households (cell 10); Measuring the Informal Sector in Indonesia 65
66 (ii) contributing family workers working in formal sector enterprises (cell 1); and (iii) own-account workers engaged in the production of goods exclusively for own final use by their household (cell 9), if considered employed according to the resolution concerning statistics of the economically active population, employment, unemployment and underemployment adopted by the 13th ICLS. One significant idea to consider in analyzing the nature of employment is whether informality pertains to persons or jobs. According to the 15th and 17 th ICLS, employment in the informal sector is defined as comprising all jobs in informal sector enterprises, or all persons who, during a given reference period, were employed in at least one informal sector enterprise, irrespective of their status in employment and whether it was their main or a secondary job. A person can simultaneously have two or more formal and/or informal jobs. Due to the existence of such multiple jobholding, jobs rather than employed persons were taken as the observation units for employment informal employment as comprising the total number of informal jobs, whether carried out in formal sector enterprises, informal sector enterprises, or households, during a given reference period (Hussmann 2004a and 2004b). Additional concepts have also been introduced by organizations dedicated to endeavors pertaining to the informal economy and informal employment, such as the Women in Informal Employment: Globalizing and Organizing (WIEGO). According to one of the known affiliates of WIEGO, Martha Chen, in her paper entitled "Rethinking the Informal Economy: Linkages with the Formal Economy and the Formal Regulatory Environment," while the informal economy consists of a range of informal enterprises and informal jobs, it can still be segmented into the following: 1. Self-employment in informal enterprises: workers in small unregistered or unincorporated enterprises, including: o employers o own account operators: both heads of family enterprises and single person operators o unpaid family workers 2. Wage employment in informal jobs: workers without worker benefits or social protection who work for formal or informal firms, for households or with no fixed employer, including: o employees of informal enterprises o other informal wage workers such as: casual or day laborers domestic workers unregistered or undeclared workers some temporary or part-time workers o industrial outworkers (also called home workers) Research also showed distinct characteristics of the informal economy in terms of income earnings and sex of workers. Chen (2007) depicted this in an "iceberg" segmentation of the informal economy which illustrates the significant gaps in earnings within the informal economy and general trends in men-women employment ratios, as shown in Appendix Figure 2. Given that the figure represents increasing earnings towards the top, it shows that employers have the highest earnings; followed by their employees and other more regular informal wage workers; own account operators; casual informal wage workers; and industrial outworkers. Meanwhile, it also demonstrates that, in general, men are likely to be over-represented in the top segment while women tend to be over-represented in the bottom segments. However, the shares of men and women in the intermediate segments vary across sectors. These concepts ultimately point to the significant gender disparity in earnings within the informal economy, with men having the advantage over women.
67 Appendix Figure 2. Segmentation of the Informal Economy Source: Chen, Martha A The concepts and ideas presented are the chief considerations applied in the estimation and analysis of informal employment in Indonesia using the 2009 Pilot Informal Sector Survey conducted in the provinces of Yogyakarta and Banten. APPENDIX 2: COST EFFECTIVE SAMPLING DESIGN FOR THE INFORMAL SECTOR The Mixed Survey: Overview (Discussions are lifted verbatim from Maligalig, D., 2010) On the basis of the definitions of the informal sector that were agreed at the 15 th International Conference of Labor Statistician (ICLS), there are two types of informal sector production units: informal own account enterprises and enterprises of informal employers. Both these types of informal production units are owned by households and since the operations of these enterprises are not easily distinguishable from those of the households that own them, a household survey has an advantage in identifying these production units. How can this be done? Respondent households have to be screened for these enterprises following the dichotomy presented in Appendix Figure 3. Those household enterprises that are producing at least some goods and services for the market and belonging either in the agricultural or non-agricultural informal sectors will be the target sampling units. These are called household unincorporated enterprises with some market production or HUEMs. Appendix Figure 3. Dichotomy of Household enterprises Household Enterprises Producing at least some goods & services for market Producing goods & services for own final use Non-agricultural Agricultural Goods Services Formal sector Informal sector Formal sector Informal sector Agriculture, forestry, fishing Paid domestic services Other activities Owner occupied dwelling services Household Unincorporated Enterprises with some Market Production (HUEMs) The mixed survey approach utilizes a household survey in the first phase to identify the HUEMs, some of which will be sampled for the second phase survey or the HUEM survey. Since the labor force survey's (LFS) ultimate sampling units are the adults in Measuring the Informal Sector in Indonesia 67


68 sampled households and its questions are mostly on labor and employment, LFS is the most appropriate household survey to use for the first phase. Also, LFS is the most frequently conducted household survey and hence, informal employment statistics will be up to date. LFS is expanded by adding questions to identify HUEMs, informal enterprises, informal employment, benefits received and working conditions of workers. Appendix Figure 4. Mixed Survey Approach Appendix Figure 4 shows the graphical description of the mixed survey approach. Phase 1 or expanded labor force survey contains additional questions that can be classified into three categories namely: 1) informal employment module; 2) informal sector enterprise module; and 3) HUEM identification module. The informal employment module will determine the extent of informal employment by distinguishing the informal from the formal workers. The data to be collected will be used to analyze the characteristics of the informal workers, available social protection mechanisms and working conditions. This module, when combined with the informal enterprise module, will further enrich the examination by determining informal employment in the informal sector. The informal sector enterprise module will determine if the enterprise/establishment of a respondent worker is informal or not. This is significant since the concept of informal employment also covers the people working in the formal sector who are informally employed. The HUEM identification module determines the existence of a probable HUEM in the household and identifies the respondent in the phase 2 of the survey. Meanwhile, the phase 2 concentrates on the enterprise and its production, providing relevant information on the informal sector s contribution to the country s economic output or the gross domestic product. The HUEMs that were identified in the second phase will be used as the sampling frame for the phase 2 survey. Hence, the cost of listing operations, which could be very large because small production units are difficult to identify will not be incurred, and the second phase the HUEM survey -- will still maintain a probability sample design. Sampling Design of Phase 2 in the 1-2 (Mixed) Survey The mixed survey is a variant of double phase sampling in which the second phase survey is usually a subset of the first phase sample and hence, both phases have the same ultimate sampling units. In the case of the mixed survey, however, the sampling units differ with households/individuals in LFS or phase 1 and HUEMs in the second phase. LFS is usually designed such that all the relevant geographical areas and household social/income classes are well represented. However, there is no mechanism that has been incorporated in the LFS design that ensures that all sectors of national accounts will be well represented in phase 2. Some sectors may be over-represented and some, with very few HUEMs. Hence, the strategy might result in less-efficient estimates than those from independent informal sector surveys in which the sampling frame of HUEMs is the result of listing operations
69 conducted solely for that purpose. It is therefore, important that the phase 2 sample be carefully designed to address this issue. Another issue that has to be considered in designing the second phase survey is the high turnover of HUEMs. To control for unit non-response (e.g. cannot be located, closed) in the second-phase HUEM survey, the interval between the two phases should be kept short. In fact, survey operations can be designed such that the two phases can be done almost simultaneously. This would not only reduce the ineligible HUEMs and those that cannot be located but would also save some travel costs for the enumerators and the supervisors. This, of course, is straightforward if all the HUEMs that are identified in the LFS will also be enumerated in the HUEM survey. Otherwise, reliable auxiliary information from previous survey is needed. For example, if the sample primary sampling units (PSUs) in LFS are the same or very similar in previous surveys, the distribution of own accounts and selfemployed individuals in the survey can be a good auxiliary variable that can be used as measure of size or stratification variable in sub-sampling PSUs. To implement the simultaneous field operations, there are several options in designing the second phase: (i) a sub-sample of the PSUs of the household sample survey can be taken, in which all the informal sector units will be enumerated; (ii) a sub-sample of the HUEMs that were identified will be interviewed for the second phase survey; and (iii) all HUEMs that have been identified will be interviewed. Decision on which is the most appropriate variation depends on the following conditions: (i) availability of auxiliary information from previous survey results; (ii) budget limitations; and (iii) skill level of enumerators and field supervisors. A sub-sample of PSUs may be drawn prior to the survey if there is relevant auxiliary information that is available. For example, if the distribution of own-account or self employed individuals by sector (of national accounts) are available for each domain, then PSUs can be selected accordingly. Sub-sampling HUEMs for the second phase would usually require another field operation because to sub-sample, a list frame is needed and hence results of the first phase must first be processed. Furthermore, since the HUEMs are likely not distributed evenly across geographical areas, balancing the work load of field operation staff will be more challenging. Sub-sampling HUEMs in simultaneous phase 1 and 2 operations can only be implemented only if the enumerators and field supervisors are adept in screening the HUEMs and are able to apply the correct sampling fractions. The third option is the easiest to implement but would require a large budget since the sample size is not controlled at the onset. It could turn out that the sample size will be very large and may require longer enumeration period and more human resources to complete. Also, the number of questionnaires that have to be printed will be quite large. And there is no mechanism for making the work load among enumerators equitable. In Indonesia, option 1, sub-sample of PSUs, was deemed the most viable due to budget limitations. Good auxiliary data are needed for sub-sampling PSUs. Moreover, since the primary purpose of phase 2 is to estimate the contribution of the informal sector to GDP, the sectors of national accounts must be well represented in the phase 2 sample. Hence, the PSUs must be stratified according to the sectors of national accounts. This would be straightforward if the HUEMs in the PSUs are homogeneous but oftentimes, HUEMs in a PSU could come from different sectors of the industry -- some which are quite prevalent or wide spread in many PSUs (e.g. agriculture; trade; transport, communications, and storage) and others that are hard to find, which we will term as sparse sector. As a solution, the following rule can be applied in stratifying the HUEMs: If a PSU contains any sparse sector, classify it under the sector that has the least HUEM count. Otherwise, classify it under the sector with the most HUEM count. The first part of the rule is to ensure that sparse sectors will be represented in phase 2. The second part of the rule Measuring the Informal Sector in Indonesia 69
70 which identifies dominant sector allows us to develop a sub-sampling strategy for the PSUs that contains the dominant sector. More explanation about the application of this rule is in Appendix 2. Only PSUs in the dominant sectors will be sub-sampled and all those in the sparse sectors will be included in the phase 2 survey. Appendix Table 1. PSU Distribution for LFS and phase 2 of the Informal Sector Survey: Indonesia Banten Yogyakarta Sector Strata Subsample for Subsample Sakernas Sakernas Phase 2 Phase 2 Agriculture Construction Electricity Gas, Water 2 2 Education Finance Health Hotels Manufacturing Mining Others Transport Communication and Storage Wholesale Retail Trade Total This stratification rule requires that the sector of the possible HUEMs in sample PSUs in LFS must be known or can be inferred or estimated. Possible HUEMs are those selfemployed or own account workers. The industry and classification of worker can only be gathered from previous LFS in which the same PSUs and households were selected. The sample design of Indonesia's LFS fulfills this requirement. In Indonesia, the same set of PSUs are surveyed, half of which will have the same households as respondents. Hence, PSUs can be stratified according to the dominant/sparse sector rule. As mentioned, because of budget limitations, the informal sector survey was piloted in two provinces Banten and Yogyakarta. These two provinces were chosen because all the sectors of national accounts were well represented in the distribution of their possible HUEMs from the 2008 February round Sakernas. Agriculture and wholesale retail trade (WRT) were considered the only dominant sectors where sub-sampling was done. The survey weight for the phase 2 survey is the product of the survey weights in phase 1 and the inverse of the selection probability of the sampled PSU. The survey weights of respondents in phase 1 are well known since phase 1 is the expanded LFS. In the case of Indonesia, if a HUEM is in a PSU that is classified under the sectors other than agriculture and wholesale retail trade, its phase 2 survey weight is equal to the phase 1 survey weight. However, the survey weight for a HUEM in a PSU that has been classified under agriculture, say in Banten, will be the phase 1 survey weight of the household that owns it times 29/10 or 2.91; and for those HUEMs in PSUs under WRT, times 36/12 or 3.0. Note that the initial survey weight of all HUEMs in a specific PSU will be uniform regardless of the current sectors of the HUEMs. Hence, if a HUEM is in Transport sector in a PSU that has been classified under agriculture in Banten Indonesia, then that HUEM will have 29/10 or 2.91 as survey weight for phase 2. Evaluation of the Phase 2 Sampling Design for
71 Since most of the estimates in the phase 2 survey will be derived at the sector level and this sector may be different from the sector to which the PSUs were classified, it is expected from the discussion in the previous section that survey weights in phase 2 will vary widely. Wide variation in survey weights may cause a substantial increase in the variance of the estimate and hence, the estimate of the sampling error. It is therefore, prudent to validate to what extent is the increase in the variance of the estimate at the sector level due to the variation of the survey weights. A rough approximation of contribution of the increase 2 in the variation of weights to the variance of the estimate (Kish, 1992) is: 1 + L = 1 + cv( w), where cv(w) is the coefficient of variation of weights. Appendix Table 2. Summary statistics of survey weights by Phase 2 sector, by province: Indonesia Industry No. of HUEMs Min Mean Max Standard Deviation 1+CV 2 Banten Agriculture Construction Education Finance Health Hotels Manufacturing Mining Other Services Transport, Communications, Storage Wholesale Retail Trade Yogyakarta Agriculture Construction Education Finance Health Hotels Manufacturing Other Services Transport, Communications, Storage Wholesale Retail Trade The contribution of the informal sector to GDP will be computed at the provincial level in Indonesia and hence, the province was set as the domain for the phase 2 survey. Phase 1 survey is Sakernas, Indonesia's Labor Force Survey, and the Informal Sector Survey (ISS) Form 1 that has all the additional questions that screen for HUEMs, classify informal/formal employment and ask about social protection issues and household consumption expenditure. Contrary to what was expected, Form 1 was only administered to phase 2 PSUs while Sakernas was administered to the full sample. Hence, the survey weights for both ISS Form 1 and phase 2 surveys will be uniform. The HUEM distributions by sector Measuring the Informal Sector in Indonesia 71
72 from Form 1 and phase 2 survey will be the same. If weights need to be trimmed, however, weighting adjustments to compensate for non-coverage is not possible. As shown in Appendix Table 2, the contribution of the survey weights to the variance of an estimate for both Form 1 and phase 2 surveys, however, is not substantial for all industry in the two pilot provinces. Hence, trimming of weights is not required. For Indonesia, the percentage of HUEMs that were correctly classified under the dominant/sparse sector stratification rule do not differ significantly as presented in Appendix Table 3. The multipliers for HUEMs in PSUs classified under agriculture and WRT strata in the phase 2 survey weights for Banten and Yogyakarta, Indonesia are not large and only range from 2.9 to 3.1, respectively. Hence, despite the non-homogeneity of these PSUs, the survey weights did not vary widely. It is therefore imperative that the phase 1 survey should cover all the PSUs and subsampling be done in phase 2 so that trimming and weighting adjustment could be applied when the wide variation of survey weights could cause substantial increase in the variance of an estimate. Survey Weight The original sampling design called for the adoption of the Sakernas sampling design for phase 1 of the survey and sub-sampling of the PSUs in the phase 2 of the survey. If this design was followed, the final survey weight for phase 1 respondents will be the same as that of the Sakernas, while for phase 2 HUEM respondents, the base weight will be the final survey weight of phase 1 respondent (owner of the HUEM) x the inverse of the PSU selection probability. When the field operations was conducted, the phase 1 of the survey was administered only in the PSUs that were subsampled for phase 2. Hence the final survey weight of phase 1 respondents became the Sarkenas final survey weight x the inverse of the selection probability of PSU of the respondent. The base weight for the phase 2 HUEM respondents is the same Sakernas final survey weight x the inverse of the selection probability of PSU of the HUEM respondent. However, adjustments for non-response and non-coverage were introduced. Data validation showed that there some HUEMs were not interviewed by enumerators for various reasons, some that should have been HUEMs were considered not HUEMs and those that should not be HUEMs were interviewed. Appendix Table 3 presents the summary of these misclassifications and non-response. Appendix Table 3. Classification of HUEMs in ISS Forms 1 & 2 Industry # identified HUEMs in ISS 1 # interviewed HUEMs in ISS 2 # correctly classified HUEMs Agriculture, Hunting and Forestry Construction Education Finance Health Hotels and Restaurant Manufacturing Mining Other Services Transport, Communication and Storage
73 Wholesale, Retail and Trade Note: Subsequent analysis revealed that the question, does the enterprise you own / where you work sell or barter some of its good and / or services? was misunderstood by some respondents in Form 1 to refer only to tangible products. Consequently, post-cell weighting adjustments were also carried out to account for some service-oriented enterprises which should have been classified as HUEMs but were not due to misinterpretation of this question. A cell weighting adjustment was introduced to compensate for these non-coverage and non-response occurrences. In the cell weighting procedure that was implemented, the adjustment cells that were formed were based on the sector of national accounts (first three digits of ISIC). The adjustment ratio is the total weighted final count of HUEMs based on phase 1 questionnaire to the total weighted final count of HUEMs based on the phase 2 questionnaire. The final survey weight for a HUEM in phase 2 is its base weight x the adjustment ratio. These are available upon request. Informal Sector Survey Forms Given that the ISS has two phases, the survey questionnaires are also separated into two forms. Below are brief descriptions of each form: ISS Form 1 Informal Sector Survey (Phase 1) Questionnaire ISS Form 2 HUEM Survey (Phase 2) Questionnaire This is the Form 1 questionnaire used to interview and record information about the household members who are employed. This questionnaire gathers information on the following: Employment Status; Nature of Employment; Terms of Employment; Social Security Contribution; Paid Leave; Maternity/paternity Leave; Termination of Employment; Place of Work; Industry of Enterprise; Legal Organization; Employment Size; Registration; Bookkeeping & Accounting Practices; and Production. This form also incorporates a one-page add on worksheet that inquires about the household expenditure. This records information about the food and non-food consumption of the household. This questionnaire records information about HUEMs such as: Identification & General Information; Organization & Status of Business; Employment & Compensation; Production & Sale; Expenditures on Raw Material & Stocks; Capital Expenditure; and Credit Information. The respondents for this form are either own account workers who are owners of the HUEM. The objectives of the ISS Form 1 (Phase 1) Questionnaire are: (1) To identify and construct a sampling frame of household unincorporated enterprises engaged at least partially in market production (HUEMs) among the enterprises in which employed persons work; (2) To provide data for estimating employment in informal sector enterprises; and (3) To provide data for estimating informal employment. In this document, the questionnaire items relating to each of these objectives are grouped into three modules a module on informal employment, a module on the registration and employment size criterion for identifying informal sector enterprises, and a module to identify HUEMs. Meanwhile, research has shown a clear link between poverty and employment in the informal sector; however, due to lack of data the following issues have not yet been determined in many countries: (i) the number of working poor, (ii) the number employed in the informal sector, and (iii) the prevalence of poor in the informal sector compared with the Measuring the Informal Sector in Indonesia 73
74 formal sector. To address this need for information, the ISS in Indonesia included a onepage household expenditure worksheet in the ISS Form 1. This was incorporated in the questionnaire design chiefly to determine poverty status of workers, so that employment poverty analysis can be performed. Using the data that will be collected and the existing poverty lines in Indonesia, poverty rates, the number of poor, and other poverty indicators will be estimated. With the potential poverty statistics to be generated, it would be possible to determine how many of those working in the informal sector and those engaged in informal employment are poor. Information in Section IV of the ISS Form 1, the Household Expenditure worksheet, are based on the consumption items available in the SUSENAS questionnaire. They are divided into two main groups, the food and non-food expenditures. The reference period for the food expenditure is the previous week, while its total is the sum of all items 1 to 14. On the other hand, non-food items are divided into two groups, one pertaining to expenditures during the last month, while the other has the last 12 months as reference period. These are items 16 to 24. On the other hand, the primary purpose of the ISS Form 2 (HUEM) Questionnaire is to generate data that can be a direct measure of informal production activities. The results of the HUEM Survey will provide the basis for estimating the benchmark gross value added (GVA) for the informal sector, and thus, measure its contribution to the gross domestic product (GDP) of the country. The HUEM Survey is meant to provide the data specifically for the IS. The ISS Form 2 has seven (7) sections namely: A. Organization of Business B. Employment and Compensation C. Production, Inventory and Sale D. Expenditures on Raw Materials and Stock E. Capital Expenditures F. Banks, Micro-Finance Services & Other Support Structure G. Problems and Prospects Since the data that will be collected from the ISS Form 2 or the HUEM survey will be the benchmark of the IS GVA, it is imperative that all the items in the questionnaire be filledup completely and carefully. The sections significant for the GVA estimation are Sections B to E. Meanwhile, Sections F and G are added to collect information in aid of policy-making. Screening of HUEM survey respondents The mixed survey approach administered in Indonesia utilized the ISS Form 1 in the first phase to screen the respondents for the second phase or the HUEM survey. The following questionnaire items from the ISS Form 1 were used to identify the potential HUEMs, whose owners were interviewed in the next phase: 1) employment status, 2) legal status, 3) marketed production, and 4) business records or accounts. Meanwhile, the following conditions were applied to determine whether the enterprise is a potential HUEM:
75 Employment Status Own account worker Employer & Appendix Table 3 HUEM decision matrix Legal Status Single proprietorship/ individual business or farm Others Do not know & Marketed Production Yes & Business Records or Accounts No written accounts Informal records for personal use Simplified accounting format required for tax payment Those respondents that satisfy the conditions presented above were evaluated to own or work in a potential HUEM, and therefore were interviewed for the HUEM survey. This assessment was conducted for all the respondents and job numbers. It was necessary that all jobs, whether primary or secondary and regardless if it is the same respondent or not, was screened for the HUEM survey. An employed person may be a formal employee, working as a regular bus driver in a company as his main job, but may also be working as a tricycle driver in his second job. Thus, he can be considered as an own account worker in this other job. If he receives payment for the transportation services he provides, and the legal status of his business is single proprietorship with no business records or accounts, then his business is a potential HUEM. These considerations were applied in the HUEM surveys conducted; thus, a person with the described characteristics was a respondent in this phase. It should be noted that, as a rule, the respondent interviewed for the HUEM survey was the owner of the enterprise. This is a strict condition implemented because the respondent must have extensive knowledge of the revenues and expenditures, as well as the production process of the enterprise to be able to answer the questions in the HUEM. Distribution of Jobs by Industrial Sector APPENDIX 3. SAMPLING ERRORS Province Industry Proportion Yogyakarta Banten Linearized Std. Err 95% Confidence Interval Agriculture, Hunting, Forestry and Fishery Mining and Quarrying Manufacturing Electricity, Gas and Water Construction Wholesale, Retail Trade Hotels and Restaurants Transportation, Communications and Storage Finance Education Health Other services Agriculture, Hunting, Forestry and Fishery Mining and Quarrying Manufacturing Electricity, Gas and Water Construction Measuring the Informal Sector in Indonesia 75
76 Wholesale, Retail Trade Hotels and Restaurants Transportation, Communications and Storage Finance Education Health Other services Number of Jobs by Industrial Sector Province Industry Proportion Linearized Std. Err 95% Confidence Interval Agriculture, Hunting, Forestry and Fishery Mining and Quarrying Manufacturing Electricity, Gas and Water Construction Wholesale, Retail Trade Yogyakarta Hotels and Restaurants Transportation, Communications and Storage Finance Education Health Other services Agriculture, Hunting, Forestry and Fishery Mining and Quarrying Manufacturing Electricity, Gas and Water Construction Wholesale, Retail Trade Banten Hotels and Restaurants Transportation, Communications and Storage Finance Education Health Other services
77 Distribution of Jobs by Employment Status Province Employment Status Proportion Yogyakarta Banten Linearized Std. Err 95% Confidence Interval own account worker employer w/ temporary worker employer w/ permanent worker employee casual employee in agriculture casual employee in non-agriculture unpaid worker own account worker employer w/ temporary worker employer w/ permanent worker employee casual employee in agriculture casual employee in non-agriculture unpaid worker Number of Jobs by Employment Status Province Employment Status Total Yogyakarta Banten Linearized Std. Err 95% Confidence Interval own account worker employer w/ temporary worker employer w/ permanent worker employee casual employee in agriculture casual employee in non-agriculture unpaid worker own account worker employer w/ temporary worker employer w/ permanent worker employee casual employee in agriculture casual employee in non-agriculture unpaid worker Informal Employment Jobs, by Province Province Proportion Linearized Std. Err 95% Confidence Interval Yogyakarta Banten Magnitude of Formal Employment Jobs, by Province Province Total Linearized Std. Err 95% Confidence Interval Yogyakarta Banten Magnitude of Formal Employment Jobs, by Industry Measuring the Informal Sector in Indonesia 77
78 Province Industry Total Linearized Std. Err 95% Confidence Interval Agriculture, Hunting, Forestry and Fishery Mining and Quarrying Yogyakarta Banten Manufacturing Electricity, Gas and Water Construction Wholesale, Retail Trade Hotels and Restaurants Transportation, Communications and Storage Finance Education Health Other services Agriculture, Hunting, Forestry and Fishery Mining and Quarrying Manufacturing Electricity, Gas and Water Construction Wholesale, Retail Trade Hotels and Restaurants Transportation, Communications and Storage Finance Education Health Other services Magnitude of Informal Employment Jobs, by Province Province Total Linearized Std. Err 95% Confidence Interval Yogyakarta Banten Magnitude of Informal Employment Jobs, by Industry Province Industry Total Yogyakarta Linearized Std. Err 95% Confidence Interval Agriculture, Hunting, Forestry and Fishery Mining and Quarrying Manufacturing Electricity, Gas and Water Construction Wholesale, Retail Trade Hotels and Restaurants Transportation, Communications and Storage Finance
79 Education Health Other services Agriculture, Hunting, Forestry and Fishery Mining and Quarrying Manufacturing Electricity, Gas and Water Construction Banten Wholesale, Retail Trade Hotels and Restaurants Transportation, Communications and Storage Finance Education Health Other services Social Protection for Employee Jobs Province Benefits Proportion Yogyakarta Banten Linearized Std. Err 95% Confidence Interval Employers pay contribution to the pension fund Receiving paid leave Receiving paid sick leave Receiving paid maternity / paternity leave Post termination benefits Employers pay contribution to the pension fund Receiving paid leave Receiving paid sick leave Receiving paid maternity / paternity leave Post termination benefits Measuring the Informal Sector in Indonesia 79
80 APPENDIX 4. MEASURING INFORMAL EMPLOYMENT AND INFORMAL ENTERPRISES (Discussion lifted from PART 2 of the ADB Handbook on Using the Mixed Survey on Measuring Informal Employment and the Informal Sector) Informal Employment Classifying informal employment using the ISS data entailed determining the characteristics of the dataset itself and then applying the ICLS concepts and definitions in consideration of these characteristics. The significance of this type of dataset analysis was acquired from Maligalig et al's (2008) results in identifying informal employment in Bangladesh using the Labor Force Survey (LFS). The methodology developed, that is, cross tabulating variables to determine the properties of the dataset as well as identify the relationships among them, is also an appropriate process to apply in the ISS of Indonesia. Through the series of cross tabulations, the survey questions were examined, the responses validated, and reliable variables to apply in the informal employment decision matrix were identified. Appendix Table 4 shows the combination of questions used for the cross tabulation analysis. Appendix Table 4. Combination of questions from the 2009 Indonesia ISS used for the cross tabulation analysis Question Description Question Description Q.05 Employment status versus Q.17 Type of enterprise Q.05 Employment status versus Q.16 Legal Status of enterprise Q.05 Employment status versus Q.28 Bookkeeping practice Q.05 Employment status versus Q.07 Type of contract Q.05 Employment status versus Q.29 Type of payslip Q.05 Employment status versus Q.27 Market enterprise (sell goods or services) Q.07 Type of contract versus Q.29 Type of payslip Q.14 Place of work versus Q.17 Type of enterprise Q.14 Place of work versus Q.16 Legal status of enterprise Q.28 Bookkeeping practice versus Q Registration of enterprise Q.28 Bookkeeping practice versus Q.16 Legal Status of enterprise Q.16 Legal Status of enterprise versus Q Registration of enterprise Q.16 Legal Status of enterprise versus Q.29 Type of payslip Q.29 Type of payslip versus Q.18 Employment size The cross-tabulations described the type of dataset and the potential variables to consider for the informal employment decision matrix. To illustrate, the own-account workers are self-employed workers with no employees, hence, to have a type of enterprise like a factory/plantation or restaurant/commercial/service chain or hospital/school, seems questionable. To further examine this line of reasoning, the type of enterprise was cross tabulated with the place of work. However, this also resulted to inconsistencies such as: 1. factory or plantation at home with no work space; home with workspace; construction site; market; street; vehicle; mobile 2. bank or insurance company at home with no work space and at construction site 3. restaurant or commercial or service chain at home with or without workspace and at construction site; 4. hospital or school at home with or without workspace; construction site; or with no fixed location/mobile. There are also instances when combinations of three or four variables were cross tabulated to further validate the inconsistencies and understand their source. For example, to confirm whether the hypothesis that the enumerators, as well as the respondents misinterpreted the type of enterprise question, the employment and legal statuses of those working at home with no work space (place of work) and with a factory/plantation (type of
81 enterprise) were tabulated. This is in response to the observations on the employment status versus type of enterprise and place of work versus type of enterprise cross tabulations. This investigation showed a number of self-employed (own account and employers) respondents who single proprietors that worked at home in a factory or plantation type of enterprise. These results provide contradictory conclusions. First, a self-employed person cannot have a plantation or factory type of enterprise since he is a single worker in the business. And second, it is difficult to imagine a factory or plantation and the home as a workplace of the same business. Similar inconsistencies were also observed in other multi-variable crosstabulations which may have stemmed from the unfamiliarity of enumerators and respondents to some introduced concepts and misinterpretations of the questions. These are to be expected since the ISS is a new survey, hence, additional care and attention must be applied in analyzing the dataset. Appendix Figure 5a. Decision matrix for determining formal and informal employment: Employees and unpaid family workers Criteria Employment status Contract 4 Employee 2 Verbal contract Informal employment 5 Casual employee in agriculture Casual employee not 6 in agriculture 7 Unpaid workers & 3 No contract 4 Employee Formal employment 5 Casual employee in agriculture & 1 Written contract 6 Casual employee not in agriculture Appendix Figure 5b. Decision matrix for determining formal and informal employment: Ownaccount workers and employers Criteria Employment status Records of Accounts Informal Employment 1 Own account worker 2 Employer assisted by temporary workers/unpaid worker & 1 No Written Accounts 2 3 Informal records for personal use Simplified accounting format for tax purposes 3 Employer assisted by permanent workers 5 Others 1 Own account worker Formal Employment 2 Employer assisted by temporary workers/unpaid worker & 4 With detailed formal accounts 3 Employer assisted by permanent workers The whole process of determining the properties of the dataset has led to the assessment that the reliable variables to use in classifying the informality of employment for Measuring the Informal Sector in Indonesia 81
82 own account and employers are the employment status and bookkeeping practice of the enterprise with the priority on the following answer choices: 1) no written accounts, 2) informal records, and 3) simplified accounting practices. On the other hand, for employees, the employment status and type of contract variables are the significant conditions to apply. Informal Enterprises Classification of enterprises requires the application of the ICLS conceptual framework which identified three types of production units, namely, formal enterprises, informal enterprises, and households. Determining the workers that are employed in households poses a difficulty since no single variable or answer choice from the questionnaire may be used. Typically, this variable is available in the employment status query, like in the Philippines through the answer choice of "Worked in private households". On the other hand, Armenia can identify the households using the legal status variable answer choice "Private household employing domestic staff". One of the variables deemed critical in identifying the households in Indonesia is the query "Does the enterprise you own sell its goods or services?" since households are defined in the framework to be producing exclusively for its own consumption. However, cross tabulations suggested caution in using the variable. Results implied that there may be respondents that did not fully understand the question in relation to their type of work. For example the respondents who work in corporations and receive detailed payslips may be employed in a construction company, which, in the view of the employee, does not sell any tangible product. Technically, the company "sells" its services to the agency/people/other companies that hire them. But, to an ordinary employee, this concept may not easily be grasped. Hence, when asked if the enterprise sells any of its products or services, the respondent may have answered "no". The same reasoning is hypothesized to those ownaccount workers and employers who answered "No" to the query but exhibit qualities of owning market-producing enterprises, such as, 1) the self-employed worker posting income during the reference period, and/or 2) the enterprise engaging paid employees for the production during the reference period. The enterprise may have been providing services, which is typically not associated with "selling" of products. Thus, given the results of the cross tabulations, the dataset was revalidated to determine the consistency of the answers to selling query with the other variables that make up the characteristics of each observation. Individual analysis and evaluation of the observations (which answered NO to the selling question) were conducted and records were revised based on the examination. After each cycle of revisions, the variables are again evaluated. The process is reiterated until no inconsistency is observed when the variables are cross tabulated. With this methodology, the decision matrices for informal enterprises are formulated as: Appendix Table 6a. Decision matrix for determining formal and informal market enterprises: Own- account workers and employers PRODUCTION UNIT Employment Status Bookkeeping Sell good or service 1 Own account worker Employer w/ temp workers FORMAL ENTERPRISE INFORMAL ENTERPRISE Employer w/ perm workers Unpaid workers Own account worker & 4 With detailed formal accts & 1 Yes & 1 No Written Accts & 1 Yes
83 2 Informal records for personal use 2 Employer w/ temp workers 3 Simplified acct'g format for tax purposes 3 Employer w/ perm workers 5 Others 1 No Written Accts 7 Unpaid workers & 2 3 Informal records for personal use Simplified acct'g format for tax purposes 5 Others 1 No Written Accts Households 1 Own account worker & 2 3 Informal records for personal use Simplified acct'g format for tax purposes & 1 No 5 Others Appendix Table 6b. Decision matrix for determining formal and informal market enterprises and households: Employees (regular and casual) PRODUCTION UNIT Employment Status Place of Work Payslip Sell good or service 4 Employee FORMAL ENTERPRISE 5 6 Casual employee in agri Casual employee not in agri & 1 Yes, w/ complete information INFORMAL ENTERPRISE HOUSEHOLDS 4 Employee Casual 5 employee in agri Casual 6 employee not in agri 4 Employee 6 Casual employee not in agri & 9 Employer's home & & 2 Yes, w/ simple payslip 3 NO 2 Yes, w/ simple payslip 3 NO & 2 No Measuring the Informal Sector in Indonesia 83
84 APPENDIX 5. ESTIMATING THE CONTIBUTION OF INFORMAL SECTOR TO GDP (Discussion lifted from PART 3 of the ADB Handbook on Using the Mixed Survey on Measuring Informal Employment and the Informal Sector) Assessment of data quality of ISS Form2 or the HUEM Survey o Completeness of coverage and response There are 11 observations that have no response Some industry have not been covered or maybe it is because ISS-2 is household-based survey; for example electricity, gas, and water supply Too much coverage on agriculture, I suspected this is the reason why informal sector agriculture in Yogyakarta was exceeding its GRDP by 170 percent. o Consistency of response Many inconsistencies found among variables; for example number of paid employee does not correspond to salaries wages There are many accounting rules that have been violated; I suspected this is due to enumerator s lack of economic-background. For economic-based survey such as ISS-2 a good sense of economicbackground is a must, because in many occasion respondents tend to over estimate their cost and under estimated their revenue. Estimation methodology Measuring the contribution of the informal sector to the total economy is best achieved by estimating its GVA and its share to the total GDP of the country. GDP measures the total GVA of all resident institutional units (establishments or enterprises) in the country. As cited earlier, only the production and income approaches can be applied to the estimation of GVA for the informal sector. The expenditures approach measures only total final expenditures by type which cannot be disaggregated into formal and informal. Production Approach Output at producers' prices Equation 1 Output = Total value of products sold after transformation + Total value of products sold without transformation + Own-account consumption + Own-account capital formation - Cost of products sold for resale (trade) + Value of services offered + Changes in inventories (output) Intermediate inputs at purchaser's prices Equation 2 Intermediate inputs = Value of raw materials used + Fuel, gasoline and lubricants + Water + Electricity + Rental payments + Transport services + Communication expenses + Non-industrial (production) services
85 + Repair and maintenance of facilities and equipment + Other industrial (production) services + Insurance + Packaging + Other costs GVA at producers' prices Equation 3 GVA = Output (producers' prices) - Intermediate inputs (purchaser's prices) Income Approach GVA = Compensation of employees (CE) Equation 4 + Taxes on production - Subsidies on production + Operating surplus/mixed income OS = GVA (Production Approach) Equation 5 - Compensation of employees - Taxes on production + Subsidies on production Output Section C of the HUEM survey, Production, Inventory and Sales, provides the basic data to compute for the informal sector HUEM output (Equation 1). It is assumed that prior to estimation, the dataset has already been assessed and edited for item and unit nonresponse, sum of parts not equal to total, etc. Therefore, the totals for items C.2., C.3., C.4., C.5., C.6, and C.7., are assumed to be reliable numbers to work on. Following the SNA coverage of output, the following HUEM survey items will be utilized to estimate output: Value of products sold after transformation (Final Goods) C.2 Value of products sold without transformation C.3 Value of services offered C.4 Purchases of goods for resale D.2.2 Value of products for own-consumption C.7 Value of own-produced capital assets E. Change in inventories C.5, C.6 Based on the above data items, output for the informal sector HUEMs is operationalized as follows: Output at producers' price Equation 6 = Total sales of products C.2+C.3+ C.4 + Changes in inventories of finished C5 goods and work-in-progress - Purchases of goods for resale D Changes in inventory of goods for resale C.6 + Value of own-consumption C.7 Measuring the Informal Sector in Indonesia 85
86 + Value of own-produced capital assets E 10 Intermediate inputs Items concerning the intermediate inputs are available in Section D., Expenditures on Raw Materials and Stock, of the HUEM survey questionnaire. Not all items under Section D can be considered as intermediate inputs. Thus, the intermediate inputs have to be drawn individually from D.3. For value of raw materials used, the data given for D.1 is assumed to be the value of raw materials used (D.1) for manufacturing, electricity, gas and water, agriculture, mining and construction. On the other hand, D.2 is assumed to be the value of purchases of goods for resale during the period. Intermediate inputs at purchasers' prices Equation 7 = Value of raw materials used + Fuel, gasoline and lubricants + Water + Electricity + Rental payments + Transport services + Communication expenses + Non-industrial services + Repair and maintenance of facilities and equipment + Other industrial services + Insurance + Packaging + Other costs The cost of products sold is shown as a deduction from output. Gross Value Added Gross value added at producers' prices GVA = Output - Intermediate inputs Equation 8 Under the Income Approach, the following data items are considered: Salaries and wages, social insurance, bonuses and allowances Taxes on products GVA B.3.1, D D.3.16 Production Approach Thus, GVA = Compensation + Taxes on production + OS Equation 9 OS = GVA Production Compensation Taxes on production Compensation is the sum of salaries and wages, social insurance contributions and bonuses and allowances. GVA is obtained from the production approach. Documentation of Guidelines on Computing Contribution of Informal Sector in Total Economy 10 Values of own-produced capital assets as recorded in Section E. will be added to output after obtaining annual of estimates of output.
87 1. The ISS 2 survey weights were recomputed to account for the misunderstanding in the ISS 1 question "do you sell goods / services" and include the enterprises that should have been classified as HUEMs but were not because they answered "No" in this question. Also, in computing for non/under coverage, ISS 2 survey weight adjustments are now computed using weighted number of HUEMs by 3 digit subsector in ISS 1 as control totals. 2. To ensure the quality of survey data, different strategies designed to identify questionable entries should be explored. These approaches include eyeballing the data, computation of descriptive statistics and generation of distributional plots by neighborhood, to identify usual data discrepancies (e.g., missing values, data values falling outside expected range, total is not equal to sum of parts and outliers). 3. As noted from the workshop, it is possible to misclassify a HUEM's activity under an incorrect ISIC. This can be identified by carefully examining the reported ISIC code and the kind of products sold with and without transformation. During the workshop, cleaning of survey data was done specially in agriculture, when upon verification of the ISIC codes and description it was noted that most of the items under products sold with transformation are under the manufacturing sector. However, kindly note that we should not remove the entire variable from one sector and simply transfer it to another sector (e.g., taking out products sold after transformation and transferring from agriculture, hunting, forestry, fishery to manufacturing) without detailed investigations. Rather, this should be done on a case-to-case basis. Further, utmost care should be taken when transferring the GVA to the appropriate sector considering that agriculture and non-agricultural activities have different reference periods. 4. In the case of the HUEM survey, it is possible to encounter cases where there was hardly any business activity during the reference period. This may be due to the seasonality of production like in agriculture (e.g., planting, harvesting, etc.). Similarly, it may be the case wherein outputs are generally works-in-progress like growing of crops, timber, livestock reared for food which are treated as continuous process of production. Conceptually, work-in-progress consists of inventories of goods, held by the HUEM in this case, which have been produced as output but require further processing. Consequently, during a particular reference period, these may not be in the form which can be sold. In particular, when we observe zero or missing output and/or intermediate inputs, we should carefully examine the entire production process of the underlying HUEMs. In particular, when we observe unreasonably small aggregated total output and intermediate input for a particular ISIC group, we need to check if this might have been caused by unaccounted work-in-progress goods. In turn, we may consider availing for the usual imputation procedures using information from neighboring ISIC groups. 5. The issues on possible "misclassification" of economic activities under incorrect industries especially on agriculture may be linked with the concept of work-inprogress. In particular, there was a concern raised on the possibility that a respondent whose main activity is agriculture (hence, this is what is reflected from the reported ISIC code) but during the reference period the agricultural goods are currently works-in-progress. If during this period, the respondent diverted his attention to other economic activities outside agriculture, we will probably observe incoherent results such that the reported goods sold are not what one would expect given the reported ISIC. This can be confirmed through careful examination of the entire production process of the HUEMs under consideration. 6. To account for imputed rent and FISIM, the formula of output involves these two concepts. Imputed rent is derived from the reported response on the question, A.3.1 if Measuring the Informal Sector in Indonesia 87
88 you were to rent an office space for your business, how much do you think will be your rental cost while FISIM is computed from reported values of interest received and interest paid under Section D.3. In converting these components to annual values, we may examine whether it is reasonable to assume that the imputed rent is constant throughout the year, depending on the industry under consideration. 7. The reported own-produced capital assets should be carefully examined. Depending on the industry or sub-sector under consideration, some reported own-produced capital assets should be excluded like jewelry, residential buildings, residential / inherited land among other types of assets which are not entirely used for production activities of an enterprise, in the case of land it is a non-produced asset. Again, this should be done on a case-to-case basis instead of simply dropping an entire variable for a particular ISIC group. During the workshop, there were warehouses that were misclassified under buildings instead of other structures. Since in one of the exercises, we excluded all buildings for agriculture, these warehouses were also unreasonably excluded in the computation of the own-produced capital assets. But in fact, these should have been included because they are used in the production activities. 8. Some respondents may have reported the entire market value of a particular asset instead of imputing only for the value of that portion of the asset which was actually used for the production process (e.g., a respondent may report the entire value of the house although only a small area of the house is used to carry out the enterprise's production activities). In such cases, we can look for other supplementary indicators to impute for the replacement cost of the portion of the asset actually used for production. 9. For a particular HUEM, it is possible to observe negative GVAs. Although this is the case, we should still watch out for data inconsistencies that might have caused this. Hence, it is ideal to examine each component of output and intermediate inputs first before accepting negative GVAs. In particular, look for missing values and confirm whether it should be zero or indeed missing. In addition, watch out for encoding errors. In either case, imputations may be carried out. If even after imputations, aggregated total GVA for a particular ISIC group is still negative, the use of income approach may be explored. Kindly note that an independent computation of the GVA through the income approach would require a certain value of operating surplus or mixed income. A simplifying approach for this case is to work on the assumption that this group of HUEMs is earning at most negligible profits. Consequently, for this group of HUEMs with negative GVA production, we may assume zero mixed income / operating surplus. There is also the possibility of understated or overstated GRDP. 10. When converting estimates of GVA components to annual figures, it may be reasonable to assume that the value of own consumption reported for the survey's reference period is constant throughout the year. 11. There were observations which have missing data on business fluctuation. These should be imputed using the neighborhood approach to be able to compute for annualized GVAs. 12. The seemingly low contribution of informal sector in the construction sector might have been caused by the misunderstanding in the question, "do you sell goods or services." Although the survey weights were adjusted to account for this under coverage, it is possible that we only captured construction HUEMs with low outputs in ISS2. A suggestion was made on improving the questionnaire for the next survey round. This is considered a limitation of data operations. In the case of Agriculture,
89 Hunting, Forestry and Fishery, further investigations need to be carried out to identify the cause of very low contribution of informal sector especially in Banten. Measuring the Informal Sector in Indonesia 89
90 APPENDIX 6. LIST OF TABLES Table 2. Number of Informal Employment by Employment Status, Province, and Production Unit Province Employment Status and Nature of Employment and Production Own Account Workers Employer w/ temp worker Employer w/ permanent Unit Informal Formal Total Informal Formal Total Informal Formal Total Yogyakarta Formal Informal Household Total Banten Formal Informal Household Total Province Employment Status and Nature of Employment and Production Employee Casual in agriculture Casual in non agriculture Unit Informal Formal Total Informal Formal Total Informal Formal Total Yogyakarta Formal Informal Household Total Banten Formal Informal Household Total Province Emp. Status & Nature of Emp. and Production Unpaid family worker TOTAL Unit Informal Formal Total Informal Formal Total Yogyakarta Formal Informal Household Total Banten Formal Informal Household Total Table 2.1 Population and Labor Force Characteristics by Sex
91 Frequency Percentage Men Women Total Men Women YOGYAKARTA Employed in Agriculture Formal Employment Informal Employment Employed in Non-Agriculture Formal Employment Informal Employment Formal Enterprise Informal Enterprise Household Total BANTEN Employed in Agriculture Formal Employment Informal Employment Employed in Non-Agriculture Formal Employment Informal Employment Formal Enterprise Informal Enterprise Household Total Table Total number of Jobs, by activity and unit of production Frequency Percent Production Unit Primary Secondary Total Primary Secondary YOGYAKARTA Formal Enterprise Informal Enterprise Household Total BANTEN Formal Enterprise Informal Enterprise Household Total Table Total Number of Jobs, by Nature of Employment and Production Unit Nature of employment Frequency Percent Production Unit Informal Formal Total Informal Formal YOGYAKARTA Formal Enterprise Informal Enterprise Household Measuring the Informal Sector in Indonesia 91
92 Total BANTEN Formal Enterprise Informal Enterprise Household Total Table Employment by Type of Production Units and Employment Employment Status YOGYAKARTA Formal Production Unit Frequency Percent Household Informal Total Formal Informal Household Own account worker Employer w/ temp workers Employer w/ permanent workers Employee Casual worker in agri Casual worker in non-agri Unpaid family worker Total BANTEN Own account worker Employer w/ temp workers Employer w/ permanent workers Employee Casual worker in agri Casual worker in non-agri Unpaid family worker Total Table Employment by type of production unit and nature of employment, and sex Production Unit YOGYAKARTA Formal Nature of Employment Informal Formal +Informal Men Women Total Men Women Total Men Women Total Formal Enterprise Informal Enterprise Household Total BANTEN Formal Enterprise Informal Enterprise Household Total Table Nature of employment by type of production unit
93 Nature of Employment YOGYAKARTA Frequency Production Unit Formal Informal Household Total Formal Informal Total BANTEN Formal Informal Total Table 2.5 Frequency Distribution of Employed Persons by Nature of Employment, Industry and Sex Industry Yogyakarta Nature of employment Formal Informal Men Women Men Women Formal TOTAL Informal Agriculture Fishing Mining Manufacturing Electricity Construction Wholesale Hotels Transport Financial_Int Real_Estate Public_Adm Education Health_Social Other_Comm Private_HH Others Total Banten Agriculture Fishing Mining Manufacturing Electricity Construction Wholesale Hotels Transport Financial_Int Measuring the Informal Sector in Indonesia 93
94 Real_Estate Public_Adm Education Health_Social Other_Comm Private_HH Others Total Table Employment by occupation and nature of employment Nature of employment Occupation Frequency Formal Informal Total Yogyakarta Legislator, senior officials and managers Professionals Technicians and associate professionals Clerks Service workers and shop and market sales workers Skill agricultural and fishery workers Craft and related workers Plant and machine operators and assemblers Elementary occupations Armed force Total Banten Legislator, senior officials and managers Professionals Technicians and associate professionals Clerks Service workers and shop and market sales workers Skill agricultural and fishery workers Craft and related workers Plant and machine operators and assemblers Elementary occupations Armed force Total Table Employment by occupation and unit of production Unit of Production Occupation Frequency Formal Informal Household Total Yogyakarta Legislator, senior officials and managers Professionals Technicians and associate professionals
95 Clerks Service workers and shop and market sales workers Skill agricultural and fishery workers Craft and related workers Plant and machine operators and assemblers Elementary occupations Armed force Total Banten Legislator, senior officials and managers Professionals Technicians and associate professionals Clerks Service workers and shop and market sales workers Skill agricultural and fishery workers Craft and related workers Plant and machine operators and assemblers Elementary occupations Armed force Total Table Informal employment by occupation and unit of production Unit of Production Occupation Frequency Formal Informal Household Total Yogyakarta Legislator, senior officials and managers Professionals Technicians and associate professionals Clerks Service workers and shop and market sales workers Skill agricultural and fishery workers Craft and related workers Plant and machine operators and assemblers Elementary occupations Armed force Total Banten Legislator, senior officials and managers Professionals Technicians and associate professionals Clerks Service workers and shop and market sales workers Skill agricultural and fishery workers Craft and related workers Plant and machine operators and assemblers Elementary occupations Measuring the Informal Sector in Indonesia 95
96 Armed force Total Table Employment by Employment Status, Nature of Employment and Sex YOGYAKARTA Employment Status Formal Nature of Employment Informal men women Total men women Total Own account worker Employer w/ temp workers Employer w/ permanent workers Employee Casual worker in agri Casual worker in non-agri Unpaid family worker Total BANTEN Own account worker Employer w/ temp workers Employer w/ permanent workers Employee Casual worker in agri Casual worker in non-agri Unpaid family worker Total Table 2.9 Tax Agency registration of registered production units and tax payments of all production units owned by own account workers and employers, by urbanity Employment Status Tax Agency urban Rural Total no tax payment Enterprises corporate tax Payment others don't know Yogyakarta Own account worker Employer w/ temp workers Employer w/ permanent workers Total Banten Own account worker Employer w/ temp workers Employer w/ permanent workers Total Total Table 2.10 Employment by type of enterprise, nature of employment and unit of production
97 Production Unit Type of Enterprise Formal Enterprise Formal Informal TOTAL Informal Enterprise Households TOTAL Yogyakarta factory bank restaurant/commercial construction hospital/school engineering farm/workshop Others Total Banten factory bank restaurant/commercial construction hospital/school engineering farm/workshop Others Total Table Employment by Type of production, nature of employment and employment size of establishment Employment Size Formal Employment Formal Enterprise Informal Employment Production Unit TOTAL Informal Enterprise Households TOTAL Yogyakarta Dont_Know Total Banten Measuring the Informal Sector in Indonesia 97
98 Dont_Know Total Table Employment by Employment Size of establishment, nature of employment and urbanity Employment size Yogyakarta Formal Employment Informal Employment Urban Rural Total Urban Rural Total Don t_know Total Banten Don t_know Total Table 2.12 Employment by legal organization, nature of employment and sex Legal Organization Yogyakarta Formal Nature of Employment Informal Men Women Total Men Women Total single proprietorship partnership corporation cooperative others don't know Total Banten single proprietorship partnership corporation cooperative others don't know Total Table Employment by place of work and nature of employment
99 Yogyakarta Place of Work Nature of Employment Frequency Col Percent TOTAL Formal Informal Formal Informal home w/ no work space home w/ work space fixed location away from home farm workplace of client construction site market street employer's home others vehicle no fixed location/mobile Total Banten home w/ no work space home w/ work space fixed location away from home farm workplace of client construction site market street employer's home others vehicle no fixed location/mobile Total Table Employment by urbanity and age groups Age Group Frequency Percent Frequency Percent Urban Rural TOTAL Urban Rural Urban Rural TOTAL Urban Rural Yogyakarta Banten Measuring the Informal Sector in Indonesia 99
100 60- over Total Table Employment by nature of employment and age groups Age Group Frequency Percent Frequency Percent Formal Informal Total Formal Informal Formal Informal Total Formal Informal Yogyakarta Banten over Total Table Informal employment by unit of production and age groups Age Group Yogyakarta Unit of Production Percentage TOTAL Formal Informal Household Formal Informal Household over Total Banten over
101 Total Table Employment by level of education, employment status, and sex Education Level Yogyakarta Employment Status Employees Self-Employed Employer Unpaid Family Worker TOTAL Men Women Men Women Men Women Men Women Men Women No_Education Pre-Primary Primary Junior_HS Vocational JHS Senior_HS Vocational SHS College University Total Banten No_Education Pre-Primary Primary Junior_HS Vocational JHS Senior_HS Vocational SHS College University Total Table Employment by level of education, employment status, and sex Education Level Yogyakarta Employment Status Employees Self-Employed Employer Unpaid Family Worker TOTAL Informal Formal Informal Formal Informal Formal Informal Formal Informal Formal No_Education Pre-Primary Primary Junior_HS Vocational JHS Senior_HS Vocational SHS College University Total Measuring the Informal Sector in Indonesia 101
102 Banten No_Education Pre-Primary Primary Junior_HS Vocational JHS Senior_HS Vocational SHS College University Total Table Employment by level of education, employment status, and nature of employment Informal Employment Education Level Frequency Employees Self_employed Employer Unpaid_fw Total Yogyakarta No_Education Pre-Primary Primary Junior_HS Vocational JHS Senior_HS Vocational SHS College University Total Banten No_Education Pre-Primary Primary Junior_HS Vocational JHS Senior_HS Vocational SHS College University Total Table 2.17 Informal employment by employment status, production unit and sex (excluding agriculture) Class of Workers Production Unit
103 Yogyakarta Formal Enterprise Informal Enterprise Households Men Women Men Women Men Women Employees Self_employed Employer Unpaid_fw Total Banten Employees Self_employed Employer Unpaid_fw Total Table 3.1 Gross Value Added in Formal and Informal Sectors by Industry DI YOGYAKARTA Industry Agriculture, hunting and forestry Fishing Million Rp. Gross Value Added Percent Formal Informal Formal Informal , ,72 11,05 88,95 Mining and quarrying , ,69 55,14 44,86 Manufacturing , ,77 31, Electricity, gas and water supply ,10 0,00 100,00 0,00 Construction , ,30 99,17 0,83 Wholesale and retail trade, repairs, etc , ,06 46,89 53,11 Hotels and restaurants , ,21 68,30 31,70 Transport, storage, and communications , ,46 87,02 12,98 Financial intermediation ,26 313,03 99,97 0,03 Real estate, renting, and business activities , ,38 54,54 45,46 Public administration and defense, social security ,22 0,00 100,00 0,00 Education , Health and social work 4.684,72 96,97 3,04 Other community, social and personal services ,23 Private households with employed persons ,45 52,55 Others TOTAL , ,08 62,70 37,30 BANTEN Agriculture, hunting and forestry Fishing , ,52 12,57 87,43 Mining and quarrying ,63 0,00 100,00 0,00 Manufacturing , ,72 95,74 4,26 Electricity, gas and water supply ,94 0,00 100,00 0,00 Construction , ,24 86,26 13,74 Wholesale and retail trade, repairs, etc , ,89 35,46 64,54 Hotels and restaurants , ,67 44,98 55,02 Transport, storage, and communications , ,48 87,92 12,08 Financial intermediation , ,85 98, Real estate, renting, and business activities , ,33 60,57 39,43 Measuring the Informal Sector in Indonesia 103
104 Industry Million Rp. Gross Value Added Percent Formal Informal Formal Informal Public administration and defense, social security ,90 0,00 100,00 0,00 Education ,64 Health and social work ,96 Other community, social and personal services 0,00 Private households with employed persons ,41 19,59 27,84 72,16 Others TOTAL , ,77 73,40 26,60 Table 3.2 Formal and Informal Sectors contribution to GDP, by agriculture and nonagriculture sector segregation Sector Million Rp. Percent Formal** Informal Formal** Informal DI YOGYAKARTA Agriculture 0, ,05 88,95 Non- Agriculture ,05 27,95 BANTEN Agriculture ,57 87,43 Non- Agriculture ,00 21,00 Table 3.3 Labor Productivity DI YOGYAKARTA Industry Gross Value Added Million Rp. Formal** Informal Formal** Informal Agriculture, hunting and forestry 39,02 5,10 47,40 13,85 Fishing Mining and quarrying 141,32 8,97 26,66 0,00 Manufacturing 32,56 16,72 98,40 8,95 Electricity, gas and water supply 120,58 0, ,53 0,00 Construction 435,11 0,28 194,25 4,28 Wholesale and retail trade, repairs, etc. 40,14 5,67 135,47 19,98 Hotels and restaurants 340,63 12,14 82,22 17,48 Transport, storage, and communications 184,12 7,59 118,88 6,08 Financial intermediation 59,67 0,07 38,36 1,66 Real estate, renting, and business activities 257,68 68,46 56,94 23,70 Public administration and defense, social security 116,35 0,00 30,29 0,00 Education Health and social work Other community, social and personal services Private households with employed persons 11,56 1,15 10,17 2,51 48,96 4,45 31,73 7,07
105 Others Table 4.1 Descriptive statistics of an informal enterprise production by industry Industry Informal Enterprise Production Revenue Intermediate Costs Capital Expenditure Min Ave Max Min Ave Max Min Ave Max DIY Agriculture, hunting and forestry 0 9,337 1,109, , , ,620 Fishing 30 15,781 91, ,935 31, Mining and quarrying 678 6,363 29, , Manufacturing 74 34, , , , Electricity, gas and water supply Construction 7,157 7,157 7,157 2,147 2,147 2, Wholesale and retail trade, repairs, etc ,829 1,019, , , Hotels and restaurants , , , , Transport, storage, and communications , , ,223 46, Financial intermediation Real estate, renting, and business activities ,072 32, , , Public administration and defense, social security Education 370 6,423 20, ,151 4, Health and social work 820 2,491 4, Other community, social and personal services 138 3,205 20, , Private households with employed persons 185 5,892 13, ,570 4, Others 84 10,450 80, ,004 38, ,205 Total 0 14,924 1,109, , , ,620 BANTEN Agriculture, hunting and forestry , , ,450 62, Fishing 1,792 13,056 28, ,587 6, Mining and quarrying Manufacturing ,127 2,053, ,422 Electricity, gas and water supply 971,17 Construction 5, ,936,935 1, ,436 Wholesale and retail 1,684, ,299, trade, repairs, etc ,829 1,019, , , ,17 Hotels and restaurants 2, ,722,326 1,410 85, , Transport, storage, and communications , , , , Financial intermediation 3,441 23,068 42,695 1,319 8,159 14, Real estate, renting, and business activities 3,351 48, , , , Public administration and defense, social security Education 5,463 11,754 18, ,145 3, Health and social work 13,519 41, , , Measuring the Informal Sector in Indonesia 105
106 Other community, social and personal services Private households with employed persons 63 18,893 58, ,453 32, Others 29 57,072 1,159, , , Total ,70 9 2,053, ,593 1,684, Table Reasons of an Informal Enterprise owner for NOT applying for a bank loan, by administrative unit Prov/ Area Procedures too complicated High interest rate Reasons NOT apply for a financial loan High collateral Available loans don t correspond to needs Not interested Do not need loans Others DIY 12,88% 10,76% 9,99% 1,27% 24,61% 21,02% 19,47% BANTEN 35,08% 18,94% 8,96% 1,45% 14,29% 7,63% 13,64% Table Knowledge of microfinance services, by administrative unit Knowledge of microfinance services Province Through word of mouth Through professional environment Through associations Through visit to institution Through advertisements Others DIY 78,88% 4,78% 8,41% 0,33% 5,61% 1,99% BANTEN 62,2% 16,63 7,1% 2,25% 9,23% 2,59% 4.3 Type of Assistance Needed by HUEMs Type of Assistance Yogyakarta Banten No No answer Yes No answer Yes No 1 Technical training 0 134,195 1,020,051 1, , ,437 2 Training in organizational and financial management 0 105,221 1,049,026 3, , ,579 3 Assistance in obtaining supplies 0 347, ,005 3, , ,752 4 Access to modern machines 0 118,716 1,035,531 3, , ,833 5 Access to loans 0 264, ,163 2, , ,260 6 Access to information on the market 0 220, ,740 3, , ,415 7 Access to large business orders 0 114,433 1,039,814 3, , ,934 8 Registration of business 0 15,101 1,139,145 3,811 26,302 1,166,616 9 Advertising of new products/ services 0 39,690 1,114,556 3,811 58,679 1,134, Others 0 138,878 1,015,369 4,729 61,892 1,130,109
107 Appendix 7. Informal Sector Survey Form 1 Questionnaire: English Version Measuring the Informal Sector in Indonesia 107
108
109 Measuring the Informal Sector in Indonesia 109
110

111 Measuring the Informal Sector in Indonesia 111
112 Appendix 8. Informal Sector Survey Form 1 Questionnaire: Bahasa Version
113 Measuring the Informal Sector in Indonesia 113
114
115 Measuring the Informal Sector in Indonesia 115
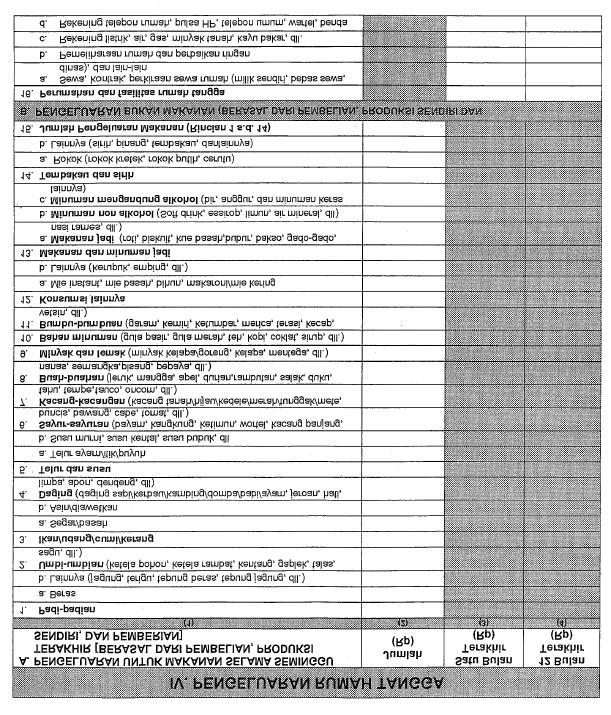
116

117 Measuring the Informal Sector in Indonesia 117

118 Appendix 9. Informal Sector Survey Form 2 Questionnaire: English Version
119 Measuring the Informal Sector in Indonesia 119
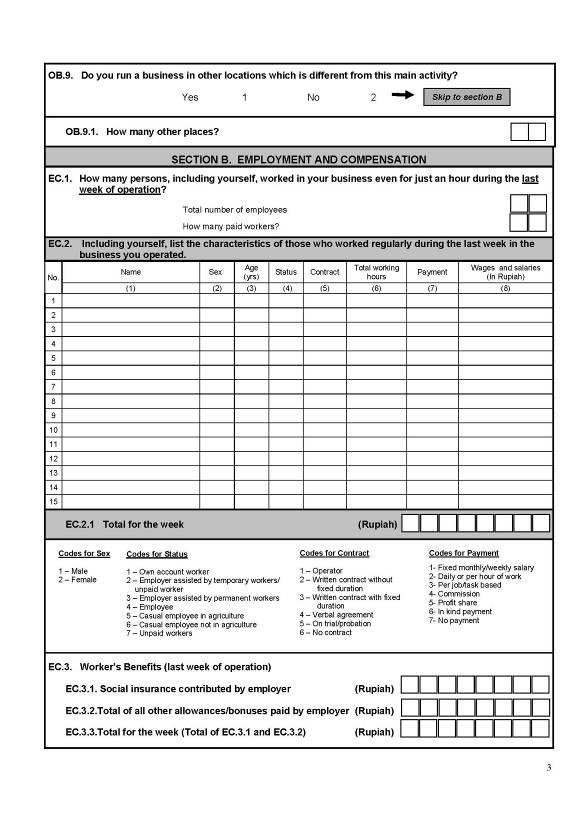
120

121 Measuring the Informal Sector in Indonesia 121
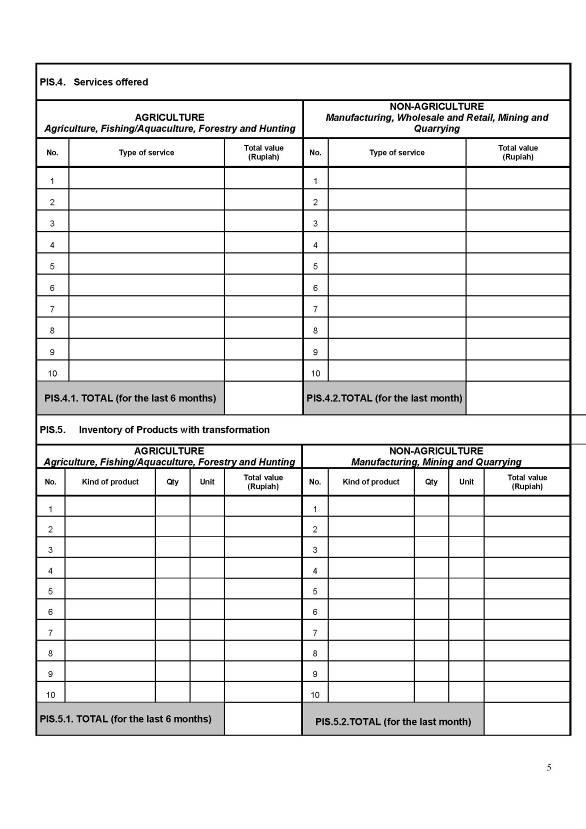
122

123 Measuring the Informal Sector in Indonesia 123
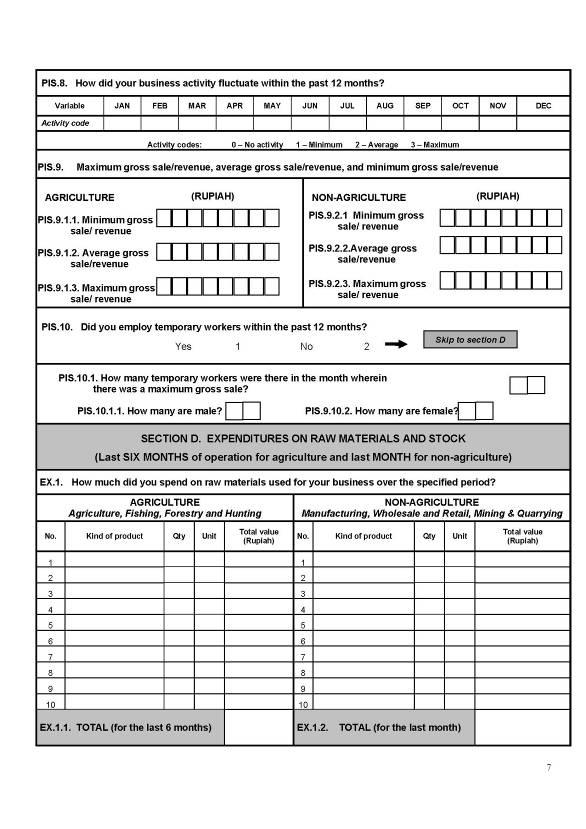
124

125 Measuring the Informal Sector in Indonesia 125
126
127 Measuring the Informal Sector in Indonesia 127
128
129 Measuring the Informal Sector in Indonesia 129
130
131 Appendix 10. Informal Sector Survey Form 2 Questionnaire: Bahasa Version Measuring the Informal Sector in Indonesia 131
132

133 Measuring the Informal Sector in Indonesia 133
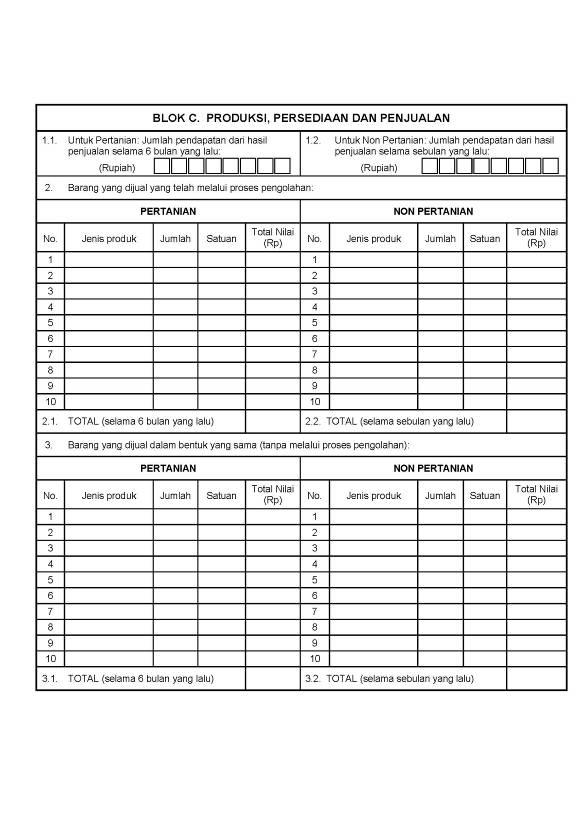
134
135 Measuring the Informal Sector in Indonesia 135
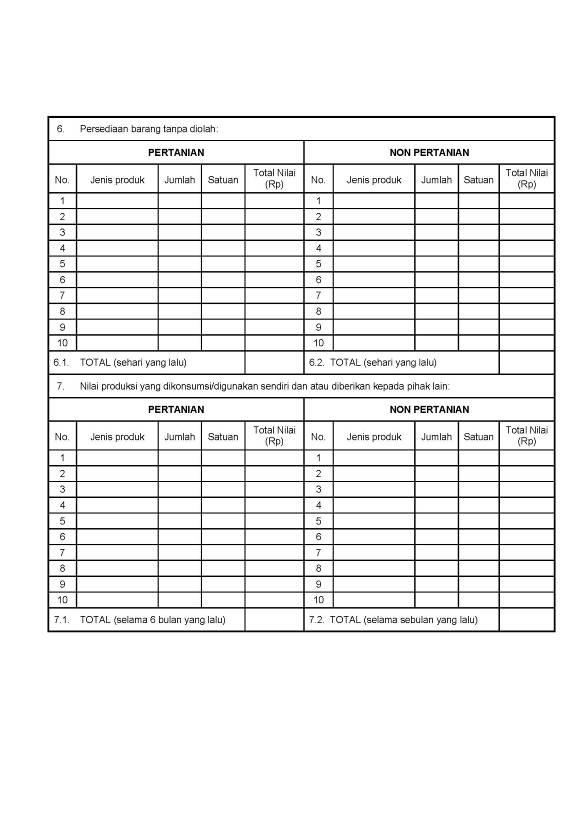
136

137 Measuring the Informal Sector in Indonesia 137
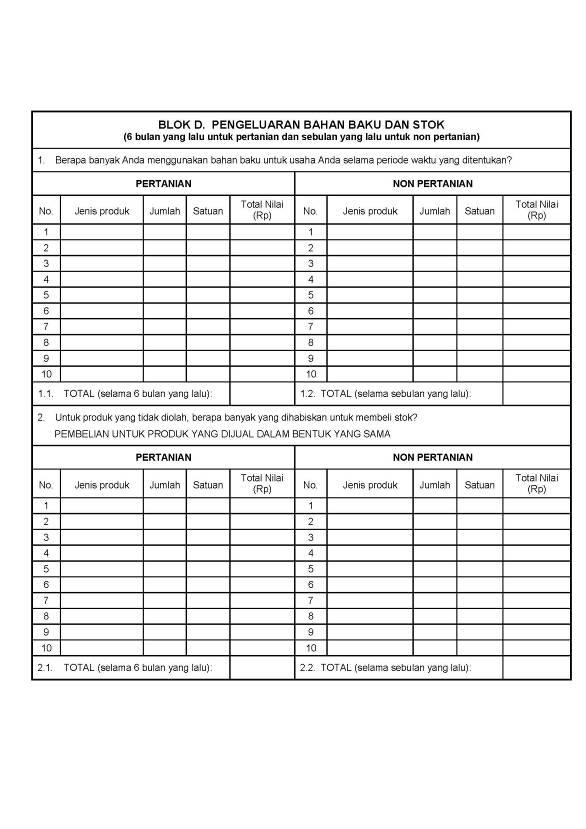
138
139 Measuring the Informal Sector in Indonesia 139
140

141 Measuring the Informal Sector in Indonesia 141
STRENGTHENING SOCIAL PROTECTION
 STRENGTHENING SOCIAL PROTECTION Comments on Enhancing Employment Opportunities and Employability Background : The Target Group Informal sector workers in remote infrastructure poor areas Children of these
 2012 . أ -2006-2006 392 359 403 438 403 457 365 315 378 137.8 37.8 (100=2006) 10.7 %110.7 - )2.0( ب %0.5.2.5.2 %020.5 2..2 %0.2.2.2.2 %000.1 0.. 00.1 0.5.2.. %0.2.. %000.2 %... ج د 0 1 2006 130.6 110.2
National Employment Returns (NER) 2016
 2016") National Employment Returns (NER) 2016 National Economic Outlook Conference (NEOC) 2018-2019 November 2017 1 1 2 3 To update the profile of the Malaysian workforce To provide information on all categories
National Employment Returns (NER) 2016 National Economic Outlook Conference (NEOC) 2018-2019 November 2017 1 1 2 3 To update the profile of the Malaysian workforce To provide information on all categories
E-TRAINING ON COMPILATION OF SUT
 E-TRAINING ON COMPILATION OF SUT IN AFRICA ACS/ESNA 2017 Session 9- Informal sector Outline of the presentation Informal economy Operational guidelines for identifying informal sector and Informal employment
Unified Data Collection on the Informal Sector
 Unified Data Collection on the Informal Sector Workshop on Economic Statistics & the Informal Sector Tehran, 10-13 November 2007 Margarita F Guerrero UN ESCAP 1 Flow of Discussion Background A unifying
Engendering Statistics: Informal Employment
 Engendering Statistics: Informal Employment Margarita F Guerrero, Ph D Regional Advisor on Statistics guerrero@un.org Statistics Division United Nations Economic & Social Commission for Asia and the Pacific
WOMEN IN THE INFORMAL ECONOMY MDB GENDER AND EMPLOYMENT WORKSHOP 24 TH APRIL, 2012
 WOMEN IN THE INFORMAL ECONOMY MDB GENDER AND EMPLOYMENT WORKSHOP 24 TH APRIL, 2012 Official Statistical Definitions Informal Sector = employment and production that takes place in small, unincorporated
Country paper: Bangladesh
 UN Workshop on International Economic and Social Classifications 24-27 November, 2008 Bangkok, Thailand. Country paper: Bangladesh Md. Nurul Islam, Director Bangladesh Bureau of Statistics (BBS): Bangladesh
PHILIPPINES. Sectoral Activities Department. Agriculture & Fishing. Fig. 1: Employment by Major Economic Activity ('000s),
,") PHILIPPINES 35,000 30,000 25,000 20,000 15,000 10,000 Fig. 1: Employment by Major Economic Activity ('000s), 2001-2008 Agriculture, Hunting and Fishing Mining and Quarrying Electricity, Gas and Water Supply
PHILIPPINES 35,000 30,000 25,000 20,000 15,000 10,000 Fig. 1: Employment by Major Economic Activity ('000s), 2001-2008 Agriculture, Hunting and Fishing Mining and Quarrying Electricity, Gas and Water Supply
Gross Domestic Product of Georgia in 2010
 Gross Domestic Product of Georgia in 2010 The real growth of Gross Domestic Product (GDP) of Georgia in 2010 amounted to 6.4 percent and deflator grew by 8.7 percent year-on-year. In the same period the
Workshop Report. Title: Workshop on Interregional Cooperation on the Measurement of Informal Sector and Informal Employment, 3-4 December 2009
 Workshop Report Title: Workshop on Interregional Cooperation on the Measurement of Informal Sector and Informal Employment, 3-4 December 2009 Venue: United Nations Conference Centre - Bangkok, Thailand
Agriculture Introduction
 Module 11 Agriculture 11.1 Introduction There are many issues and topics on which gender statistics are relevant and needed. In this chapter, we will look at a selection of topics in which a gender perspective
Labour Market Performance and the Challenges of Creating Employment in India
 Labour Market Performance and the Challenges of Creating Employment in India Presentation at the Expert Group Meeting on The Challenges of Building Employment for a Sustainable Recovery International Labour
การจ ดประเภทมาตรฐานอ ตสาหกรรมประเทศไทย ป 2552
 Thailand Standard Industrial Classification : TSIC-2009 การจ ดประเภทมาตรฐานอ ตสาหกรรมประเทศไทย ป 2552 Employment Promotion Division Department of Employment Ministry of Labour MAY 22, 2014 International
GENDER EQUITY INSIGHTS 2018 INSIDE AUSTRALIA S GENDER PAY GAP
 GENDER EQUITY INSIGHTS 2018 INSIDE AUSTRALIA S GENDER PAY GAP BCEC WGEA Gender Equity Series CONTENTS FOREWORD WGEA 4 FOREWORD BCEC 5 Executive Summary 6 Key Findings 6 Introduction 8 THE BIG PICTURE
19 th ICLS Resolution on Statistics of Work, employment and labour underutilization Implications for ICATUS
 19 th ICLS Resolution on Statistics of Work, employment and labour underutilization Implications for ICATUS David Hunter, ILO Meeting of the UN Expert Group on Time Use Statistics New York, 28-30 June
Source: ONS - PROV - Sic07 Industry (2) SIC2007 Table 4.7a Annual pay - Gross 2013
 SIC2007 Table 4.7a Annual pay - Gross 2013") Annual average income - Gross ( ) - For all employee jobs: United Kingdom, 2013 FINANCIAL AND INSURANCE ACTIVITIES MINING AND QUARRYING ELECTRICITY, GAS, STEAM AND AIR CONDITIONING SUPPLY INFORMATION AND
Annual average income - Gross ( ) - For all employee jobs: United Kingdom, 2013 FINANCIAL AND INSURANCE ACTIVITIES MINING AND QUARRYING ELECTRICITY, GAS, STEAM AND AIR CONDITIONING SUPPLY INFORMATION AND
Measurement of Employment in the Informal Economy
 Measurement of Employment in the Informal Economy Monica D. Castillo Chief, Decent Work Data Production Unit ILO Department of Statistics Geneva castillom@ilo.org National Labour Market Information Training
Small Businesses a Way Out of Poverty
 The advantage of economic growth is not that wealth increases happiness, but that it increases the range of human choice. These words were written in 1955 by Arthur Lewis, a Caribbean scholar and Nobel
Informality and Informal Employment in Malaysia
 Informality and Informal Employment in Malaysia National Economic Outlook Conference 2018-2019 21 November 2017 Hotel Continental, Kuala Lumpur The Objectives... Informality and Informal Employment in
MONGOLIA EMPLOYMENT AND ENVIRONMENTAL SUSTAINABILITY FACT SHEETS 2017
 MONGOLIA EMPLOYMENT AND ENVIRONMENTAL SUSTAINABILITY FACT SHEETS 17 The Employment and Environmental Sustainability Fact Sheets series provides key features of employment and environmental sustainability
Employment and gender differences in the informal economy
 Employment and gender differences in the informal economy 1 Valentina Stoevska (stoevska@ilo.org) Department of Statistics International Labour Office- Geneva International Labour Organisation, Department
CHILE. Sectoral Activities Department. Community, Social & Personal Services. Fig. 1: Employment by Major Economic Activity ('000s),
,") CHILE 7,000 6,000 5,000 Fig. 1: Employment by Major Economic Activity ('000s), 2000-2008 Agriculture, Hunting, Forestry and Fishing Mining and Quarrying Community, Social & The community, social and personal
CHILE 7,000 6,000 5,000 Fig. 1: Employment by Major Economic Activity ('000s), 2000-2008 Agriculture, Hunting, Forestry and Fishing Mining and Quarrying Community, Social & The community, social and personal
Census of Economic Establishments in Ethiopia
 Census of Economic Establishments in Ethiopia 1. Introduction In general, it is obvious that, availability of relevant, reliable and up to date statistical data is considered indispensable for the evaluation
Economic Surveys Results. Release Date : Oct 2015
 Economic Surveys Results 2014 Release Date : Oct 2015 Table of Contents Introduction 4 Key Points 5 Analysis of Results 6 3.1 Value added 6 3.2 Total production 7 3.3 Gross fixed capital formation 8 3.4
PERU. Sectoral Activities Department. Wholesale & Retail Trade. Fig. 1: Employment by Major Economic Activity ('000s),
,") PERU 4,500 Fig. 1: Employment by Major Economic Activity ('000s), 2002-2008 Wholesale & Retail Trade 4,000 3,500 3,000 2,500 2,000 1,500 1,000 500 0 2002 2004 2006 2008 Source: ILO Laborsta; Persons aged
PERU 4,500 Fig. 1: Employment by Major Economic Activity ('000s), 2002-2008 Wholesale & Retail Trade 4,000 3,500 3,000 2,500 2,000 1,500 1,000 500 0 2002 2004 2006 2008 Source: ILO Laborsta; Persons aged
Statistics on Informality in Indonesia
 Republic of Indonesia Statistics on Informality in Indonesia Wachyu Winarsih and Vera Lisna Regional Course on Statistics on Informality 6 1 July 15, Chiba Japan OUTLINE Overview of Indonesia Indonesia
Labour Force Surveys to produce statistics on paid and unpaid forms of work
 Labour Force Surveys to produce statistics on paid and unpaid forms of work Elisa M. Benes Senior Statistician Cecilia Tinonin Project Technical Officer ILO Department of Statistics Expert Group Meeting
Exhaustiveness, part 4 Informal Economy 1
 Exhaustiveness, part 4 Informal Economy 1 Introduction This paper continues the series dedicated to extending the contents of the Handbook Essential SNA: Building the Basics 2. One of the main themes in
Communications In The Workplace
 81 Chapter 6 Communications In The Workplace This chapter examines current levels of consultation, information and communication in the workplace. It outlines the type of information available in the workplace
Male-Female Pay Differences, Jordanian Case
 Distr.: General 20 February 2012 English only Economic Commission for Europe Conference of European Statisticians Group of Experts on Gender Statistics Work Session on Gender Statistics Geneva, 12-14 March
Women and Men Operators of Enterprises in India s Informal Sector
 WIEGO Statistical Brief N o 18 December 2017 and Operators of Enterprises in India s Informal Sector Govindan Raveendran 1 Half of the global workforce, more so in developing countries, is self-employed,
ADB Economics Working Paper Series. Informal Employment in Bangladesh
 ADB Economics Working Paper Series Informal Employment in Bangladesh Dalisay S. Maligalig, Sining Cuevas, and Aleli Rosario No. April 00 ADB Economics Working Paper Series No. Informal Employment in Bangladesh
VIET NAM EMPLOYMENT AND ENVIRONMENTAL SUSTAINABILITY FACT SHEETS 2017
 VIET NAM EMPLOYMENT AND ENVIRONMENTAL SUSTAINABILITY FACT SHEETS 17 The Employment and Environmental Sustainability Fact Sheets series provides key features of employment and environmental sustainability
Annual GDP by production approach in current and constant prices: main issues 1
 Annual GDP by production approach in current and constant prices: main issues 1 Introduction This paper continues the series dedicated to extending the contents of the Handbook Essential SNA: Building
The definition of the informal economy. Learning objectives
 Sessions 1.2. and 1.3. The definition of the informal economy Learning objectives Grasp the difference between the informal economy and its components: the informal sector and informal employment Be able
2011 Census Headlines 11 December 2012 Peterborough Unitary Authority Labour Market
 Headlines 11 December 2012 Peterborough Unitary Authority Economic Activity Rates (for usual residents aged 16 74) See Table KS601 (attached) Peterborough s economic activity rate at 72.3% is just above
2011 Population and Housing Census. Statistical data on the hours usually worked by employed persons
 HELLENIC REPUBLIC Piraeus, 27 February 2015 HELLENIC STATISTICAL AUTHORITY 2011 Population and Housing Census Statistical data on the hours usually worked by employed persons The Hellenic Statistical Authority
PAKISTAN EMPLOYMENT AND ENVIRONMENTAL SUSTAINABILITY FACT SHEETS 2017
 PAKISTAN EMPLOYMENT AND ENVIRONMENTAL SUSTAINABILITY FACT SHEETS 217 The Employment and Environmental Sustainability Fact Sheets series provides key features of employment and environmental sustainability
INFORMAL WORKERS: UNIVERSAL & OCCUPATIONAL HEALTH COVERAGE
 INFORMAL WORKERS: UNIVERSAL & OCCUPATIONAL HEALTH COVERAGE MARTY CHEN HARVARD UNIVERSITY WIEGO NETWORK IOM WORKSHOP JULY 29, 2014 REMARKS My remarks will be in 4 parts: Informal Employment o Definition
International developments in measuring the informal sector and informal employment. Technical Notes No. 01: Conceptual Framework
 International developments in measuring the informal sector and informal employment Technical Notes No. 01: Conceptual Framework February 2010 CONTENTS Page Introduction... 2 I. Refocusing of informal
Sectoral economic growth and structural transformation in Ethiopia
 Sectoral economic growth and structural transformation in Ethiopia Tadele Ferede (PhD) Department of Economics Addis Ababa University October 3, 2015 1 Outline 1 Introduction 2 Structural transformation
Skills for future Europe: New evidence from new forecast
 Skills for future Europe: New evidence from new forecast Vladimir Kvetan Cedefop The new Cedefop skills forecast provides projections of skill supply and demand Including first analysis/indicators of LM
FORECASTS OF EMPLOYMENT NEEDS IN THE CYPRUS ECONOMY
 SUMMARY OF STUDY FORECASTS OF EMPLOYMENT NEEDS IN THE CYPRUS ECONOMY 2017-2027 The systematic monitoring of employment trends over time and projecting the future situation of the labour market are key
Metadata: Number of employers and employees
 Number of employers and employees - Metadata 1 (8) Metadata: Number of employers and employees 0. Registration entry for subjects 0.1 Name Number of employers and employees 0.2 Subject area Enterprises
NEPAL EMPLOYMENT AND ENVIRONMENTAL SUSTAINABILITY FACT SHEETS 2017
 NEPAL EMPLOYMENT AND ENVIRONMENTAL SUSTAINABILITY FACT SHEETS 217 The Employment and Environmental Sustainability Fact Sheets series provides key features of employment and environmental sustainability
Labour market insights from the 2013 Census and implications on the Pacific labour force in Auckland
 Labour market insights from the 2013 Census and implications on the Pacific labour force in Auckland Penelope Tevita-Tuatagaloa Research and Evaluation Unit (RIMU), Auckland Council Abstract Pacific people
APPLICATION FOR TRAVELLING EXPENSES REGARDING A JOB INTERVIEW
 APPLICATION FOR TRAVELLING EXPENSES REGARDING A JOB INTERVIEW It is obligatory to fill in all information. An official invitation from the employer, including date, time, location, must be attached to
CANADA. Sectoral Activities Department. Wholesale & Retail Trade. Fig. 1: Employment by Major Economic Activity ('000s),
,") CANADA Fig. 1: Employment by Major Economic Activity ('000s), 2000-2008 20,000 18,000 16,000 14,000 12,000 10,000 8,000 6,000 4,000 2,000 0 2000 2002 2004 2006 2008 Agriculture, Forestry, Fishing Mining
CANADA Fig. 1: Employment by Major Economic Activity ('000s), 2000-2008 20,000 18,000 16,000 14,000 12,000 10,000 8,000 6,000 4,000 2,000 0 2000 2002 2004 2006 2008 Agriculture, Forestry, Fishing Mining
INFO BRIEF INFORMAL SECTOR OF BANGLADESH
 INFO BRIEF INFORMAL SECTOR OF BANGLADESH Introduction Dr. Md. Nurul Islam Director Bureau of Manpower Employment and Training Informal sector is a very significant area of the economy and employment in
Estimation of turnover for VAT Groups as A Pre-condition for publishing Data from the BR
 Estimation of turnover for VA Groups as A Pre-condition for publishing Data from the BR 18 th International Roundtable on Business Survey Frames 17-22 October 2004, Beijing Session 5 - BR Quality Indicators
1991 Census Special Workplace Statistics - 10% sample SECTION B Zone Identifier Zone of Workplace
 Table WB1 Economic position and age: Employees and self-employed Economic position TOTAL EMPLOYEES Age AND SELF-EMPLOYED Employees Self-employed Males Females Males Females Males Females TOTAL EMPLOYEES
Skills, Competitiveness and Productivity
 The Pakistan Development Review 48 : 4 Part II (Winter 2009) pp. 473 486 Skills, Competitiveness and Productivity MUHAMMAD KHAN, FOZIA AFTAB KIANI, AFSHEEN ASHRAF, and M. IFTIKHAR-UL- HUSNAIN * 1. INTRODUCTION
SOCIO ECONOMIC PROFILE OF THE SAMPLE HOUSEHOLDS
 CHAPTER - V SOCIO ECONOMIC PROFILE OF THE SAMPLE HOUSEHOLDS 46 SOCIO ECONOMIC PROFILE OF THE SAMPLE HOUSEHOLDS In this chapter an attempt is made to present socio, demographic and economic profile of sample
April An Analysis of Newfoundland and Labrador s Productivity, : Mining, and Oil and Gas Extraction Drives Strong Productivity Growth
 April 2011 111 Sparks Street, Suite 500 Ottawa, Ontario K1P 5B5 613-233-8891, Fax 613-233-8250 csls@csls.ca CENTRE FOR THE STUDY OF LIVING STANDARDS An Analysis of Newfoundland and Labrador s Productivity,
Chapter 16: Employment growth, Information and Other issues
 Chapter 16: Employment growth, Information and Other issues Learning Objectives:- 1. Introduction 2. Basic Concepts a. Meaning of worker b. Labour force and work force c. Meaning of employment d. Wage
ECONOMICALLY ACTIVE POPULATION: EMPLOYMENT, UNEMPLOYMENT, UNDEREMPLOYMENT
 Regional Workshop on Monitoring and Assessing Progress on Decent Work in Asia (Bangkok, Thailand, 28-30 June 2010) Session 3: Introduction Data Sources on Decent Work ECONOMICALLY ACTIVE POPULATION: EMPLOYMENT,
TONGA EMPLOYMENT AND ENVIRONMENTAL SUSTAINABILITY FACT SHEETS 2017
 TONGA EMPLOYMENT AND ENVIRONMENTAL SUSTAINABILITY FACT SHEETS 217 The Employment and Environmental Sustainability Fact Sheets series provides key features of employment and environmental sustainability
COMMISSION OF THE EUROPEAN COMMUNITIES COMMISSION STAFF WORKING DOCUMENT. Accompanying the
 EN EN EN COMMISSION OF THE EUROPEAN COMMUNITIES Brussels, 19.06.2008 SEC (2008) 2047 COMMISSION STAFF WORKING DOCUMENT Accompanying the FIFTH PROGRESS REPORT ON ECONOMIC AND SOCIAL COHESION Growing Regions,
COMMISSION OF THE EUROPEAN COMMUNITIES COMMISSION STAFF WORKING DOCUMENT. Accompanying the
 COMMISSION OF THE EUROPEAN COMMUNITIES Brussels, 19.06.2008 SEC (2008) 2047 COMMISSION STAFF WORKING DOCUMENT Accompanying the FIFTH PROGRESS REPORT ON ECONOMIC AND SOCIAL COHESION Growing Regions, growing
Culture statistics strategy Newsletter
 Culture statistics strategy Newsletter Prepared by the Policy Research Group (Canadian Heritage) Volume 1, March 2015 Photographer: Retis Source: https://www.flickr.com/photos/85264217@n04/8940676841/
Introduction. Objective
 Introduction Objective The aim of this paper is to contribute to Pakistan s poverty reduction policy framework by improving the understanding of labour market issues relevant to poverty and poverty reduction
WORLD EMPLOYMENT SOCIAL OUTLOOK WOMEN
 Executive summary WORLD EMPLOYMENT SOCIAL OUTLOOK WOMEN Gaps between men and women in the world of work remain widespread and begin with women s limited access to the labour market Gender gaps are one
Instructions on how to apply for relocation support
 Instructions on how to apply for relocation support Please follow these instructions and tick off the attached items. The application must be sent at the latest the day before you leave your country of
Guidelines to operationalize the definition of work adopted by the 19th ICLS
 Guidelines to operationalize the definition of work adopted by the 19th ICLS Kieran Walsh Senior Statistician, Contents 19th ICLS Resolution I Pilot study programme Future work 2 19 th International Conference
The Informal Sector and Informal Employment Statistical Measurement, Economic Implications and Public Policies Hanoi, Viet Nam May 6-7, 2010
 The Informal Sector and Informal Employment Statistical Measurement, Economic Implications and Public Policies Hanoi, Viet Nam May 6-7, 2010 Paper for session III - 3 Women and men in the informal economy
CREATING JOBS IN SRI LANKA
 CREATING JOBS IN SRI LANKA Role of Private Sector Financial Institutions Case Study Cover photo Dominic Sansoni / The World Bank IFC Disclaimer This publication may contain advice, opinions, and statements
Chapter Four Rural Urban Linkages and Rural Livelihoods in Punjab: Impact of Commuting and Outsourcing
 Chapter Four Rural Urban Linkages and Rural Livelihoods in Punjab: Impact of Commuting and Outsourcing Kamal Vatta Introduction Punjab is an important agricultural state in India which contributes around
ISCO-88 update and tourism occupations
 ISCO-88 update and tourism occupations A. Background B. Conceptual framework C. Tourism as a specific area for updating ISCO-88 D. Questionnaire on tourism occupations Madrid, April 2005 A. Background
Estimation of Rural and Urban Income
 Estimation of Rural and Urban Income Introduction 32.1 The Central Statistical Organisation (CSO) has been compiling estimates of Rural and Urban income of the Indian economy along with the exercises for
Table 1. Gross Domestic Product of Bangladesh at Current Prices, to
 Table 1. Gross Domestic Product of Bangladesh at Current Prices, 2010-11 to 2014-15 (Million Taka) A. Agriculture 1,539,506 1,707,064 1,857,524 2,062,758 2,240,810 1. AGRICULTURE AND FORESTRY 1,254,686
Measurements Based on Time Use Statistics : Some Issues
 Measurements Based on Time Use Statistics : Some Issues Indira Hirway Centre for Development Alternatives Ahmedabad, India 1 Measurement Issues Additional issues in measurement of workforce and GDP Valuation
Foreword. Sarajevo, September Zdenko Milinović
 2 Foreword Development of the Structural Business Statistics started through the support projects to the statistical system of Bosnia and Herzegovina with the objective of training staff for conducting
Human Resources Management in Construction
 4 Human Resources Management in Construction Dr. Nabil I. El Sawalhi Construction Management 1 Content External Issues Affecting HRM in Construction 1. Demographic Changes Age Composition of the Workforce
Skills development in the informal sector. Arvil V. Adams
 Skills development in the informal sector Arvil V. Adams Initial observations The informal sector plays a predominant role in job and national wealth creation in developing countries worldwide, but particularly
Kathmandu, Nepal, September 23-26, 2009
 Session Number: Session 4a (Parallel) Time: Friday, September 24, 14:00-15:30 Paper Prepared for the Special IARIW-SAIM Conference on Measuring the Informal Economy in Developing Countries Kathmandu, Nepal,
Rural Off-Farm Incomes in Myanmar s Dry Zone
 FSP RESEARCH HIGHLIGHT #10 Rural Off-Farm Incomes in Myanmar s Dry Zone Aye Myint Zu, Htet Htet Khine, Khin Zin Win, Sithu Kyaw INTRODUCTION This research highlight presents findings on key features of
Introduction to Supply and Use Tables, part 2 Data Sources and Compilation 1
 Introduction to Supply and Use Tables, part 2 Data Sources and Compilation 1 Introduction This paper continues the series dedicated to extending the contents of the Handbook Essential SNA: Building the
UNIT 7. Chapter 15 EMPLOYMENT : GROWTH INFORMALISATION AND OTHER ISSUES
 UNIT 7 Chapter 15 EMPLOYMENT : GROWTH INFORMALISATION AND OTHER ISSUES * Work plays an important role in our lives, as individuals and as members of society. * A worker is an individual, who is involved
How different are service and manufacturing firms in the informal sector? (Short Note)
") World Bank From the SelectedWorks of Mohammad Amin October, 2009 How different are service and manufacturing firms in the informal sector? (Short Note) Mohammad Amin Available at: https://works.bepress.com/mohammad_amin/14/
World Bank From the SelectedWorks of Mohammad Amin October, 2009 How different are service and manufacturing firms in the informal sector? (Short Note) Mohammad Amin Available at: https://works.bepress.com/mohammad_amin/14/
CHAPTER III SOCIO-ECONOMIC CHARACTERISTICS OF THE POPULATION IN AGRICULTURAL HOUSEHOLDS
 CHAPTER III SOCIO-ECONOMIC CHARACTERISTICS OF THE POPULATION IN AGRICULTURAL HOUSEHOLDS 1 INTRODUCTION Population as a producer and consumer is closely related with agriculture. On the one hand, population
Session 2.1. Overview of measurement objectives and methods. Learning objectives
 Session 2.1. Overview of measurement objectives and methods Learning objectives Be aware of why we need to produce statistics on the informal economy To know What is the minimum set of data items that
Updated System of National Accounts (SNA): Chapter 5: Enterprises, establishments and industries
: Chapter 5: Enterprises, establishments and industries") Statistical Commission Thirty-ninth session 26 29 February 2008 Item 3(d) of the provisional agenda Items for discussion and decision: National accounts Background document Available in English only Updated
Statistical Commission Thirty-ninth session 26 29 February 2008 Item 3(d) of the provisional agenda Items for discussion and decision: National accounts Background document Available in English only Updated
The informal sector and the 2008 SNA framework
 The informal sector and the 2008 SNA framework Regional Workshop on Measuring the Informal Sector and the Non-Observed Economy 4-7 October 2015 Tehran, Islamic Republic of Iran United Nations Statistics
Instructions on how to apply for an interview travel allowance
 Instructions on how to apply for an interview travel allowance Please follow these instructions and tick off the attached items. The application must be sent at the latest one day before the date of the
Statistics of the Informal sector in the Arab Countries
 Statistics of the Informal sector in the Arab Countries Nader KEYROUZ, Regional Labour Statistician International Labour Organization Regional Bureau for Arab States 1. Recommendation No. 204 concerning
Rajeev Dehejia (Wagner Graduate School of Public Service, NYU) and Nandini Gupta (Kelley School of Business, IU) April 2015
 and Nandini Gupta (Kelley School of Business, IU) April 2015") F D O C : E I Rajeev Dehejia (Wagner Graduate School of Public Service, NYU) and Nandini Gupta (Kelley School of Business, IU) April 2015 Dehejia-Gupta () Occupational Choice April 2015 1 / 22 Informal
F D O C : E I Rajeev Dehejia (Wagner Graduate School of Public Service, NYU) and Nandini Gupta (Kelley School of Business, IU) April 2015 Dehejia-Gupta () Occupational Choice April 2015 1 / 22 Informal
WAGES INEQUALITIES BETWEEN MEN AND WOMEN: EUROSTAT SES METADATA ANALYSIS APPLYING ECONOMETRIC MODELS 1
 QUANTITATIVE METHODS IN ECONOMICS Vol. XV, No. 1, 2014, pp. 113 124 WAGES INEQUALITIES BETWEEN MEN AND WOMEN: EUROSTAT SES METADATA ANALYSIS APPLYING ECONOMETRIC MODELS 1 Aleksandra Matuszewska-Janica
A data portrait of smallholder farmers
 A data portrait of smallholder farmers An introduction to a dataset on small-scale agriculture The Smallholder Farmers Dataportrait is a comprehensive, systematic and standardized data set on the profile
Regional Workshop on the Production of Statistics on Asset Ownership from a Gender Perspective through Household Surveys
 Regional Workshop on the Production of Statistics on Asset Ownership from a Gender Perspective through Household Surveys EDGE Pilot Surveys in Asia and the Pacific R-CDTA 8243: Statistical Capacity Development
LAO PEOPLE S DEMOCRATIC REPUBLIC
 LAO PEOPLE S DEMOCRATIC REPUBLIC EMPLOYMENT AND ENVIRONMENTAL SUSTAINABILITY FACT SHEETS 217 The Employment and Environmental Sustainability Fact Sheets series provides key features of employment and environmental
Beyond the traditional approach: Gender statistics and quality of work
 GLOBAL FORUM ON GENDER STATISTICS ESA/STAT/AC.140/2.2 10-12 December 2007 English only Rome, Italy Beyond the traditional approach: Gender statistics and quality of work Prepared by Ms. Joann Vanek Women
Resolution concerning an integrated system of wages statistics, adopted by the Twelfth International Conference of Labour Statisticians (October 1973)
") Resolution concerning an integrated system of wages statistics, adopted by the Twelfth International Conference of Labour Statisticians (October 1973) The Twelfth International Conference of Labour Statisticians,......
Resolution concerning an integrated system of wages statistics, adopted by the Twelfth International Conference of Labour Statisticians (October 1973) The Twelfth International Conference of Labour Statisticians,......
Volume Title: Productivity Trends in the Goods and Service Sectors, : A Preliminary Survey. Volume URL:
 This PDF is a selection from an out-of-print volume from the National Bureau of Economic Research Volume Title: Productivity Trends in the Goods and Service Sectors, 1929 61: A Preliminary Survey Volume
Agricultural Labour in India Ranjan Kumar Som
 Agricultural Labour in India Ranjan Kumar Som In a developing economy the change in the pattern of employment indicated by a fall in the number at agricultural labourers and labour households should be
EMPLOYMENT STRATEGY AND EQUITABLE GROWTH: A SOCIAL CAPITAL PERSPECTIVE FOR KPK
 EMPLOYMENT STRATEGY AND EQUITABLE GROWTH: A SOCIAL CAPITAL PERSPECTIVE FOR KPK Syed Akther Hussain Shah Deputy Provincial Representative UNDP KPK & FATA Syed Tariq Shah Associate Professor, Mathematics
EFFECTS OF UNILATERAL TRADE LIBERALIZATION IN SOUTH ASIAN COUNTRIES: Applications of CGE Models of Bangladesh, India, Nepal, Pakistan and Sri Lanka
 ESCAP SOUTH AND SOUTH-WEST ASIA OFFICE EFFECTS OF UNILATERAL TRADE LIBERALIZATION IN SOUTH ASIAN COUNTRIES: Applications of CGE Models of Bangladesh, India, Nepal, Pakistan and Sri Lanka Selim Raihan DEVELOPMENT
Intellectual property
 Intellectual property products and macroeconomic statistics Presentation to IGA seminar "Economic globalisation: addressing measurement challenges related to IPPs" 16 March 2018, Luxembourg Content IPP
Regional Workshop on Measuring the Informal Sector and the Non-Observed Economy 4 7 October 2015 Tehran NON OBSERVED ECONOMY IN NATIONAL ACCOUNTS
 Regional Workshop on Measuring the Informal Sector and the Non-Observed Economy 4 7 October 2015 Tehran NON OBSERVED ECONOMY IN NATIONAL ACCOUNTS Bengi YOSUNKAYA (Annual Accounts Group) 1 Content Introduction
Myanmar s Rural Transformation:
 Myanmar s Rural Transformation: Emerging evidence of rapid structural change Ben Belton (Michigan State University) Food Security Policy Project University of Sydney, Sydney Southeast Asia Centre 15 February,