DataVision SmartReport and Dashboard
|
|
|
- Cody Gordon
- 6 years ago
- Views:
Transcription


1 DataVision SmartReport and Dashboard Vanessa Dorr, RN, BSN, MSN DataVision Clinical Consultant Brenda Pettyjohn, RN, CPHQ DataVision Clinical Consultant
2 You asked for changes. We listened - 2 -
3 Dashboard - 3 -
4 SmartReport - 4 -
5 Navigation - 5 -
6 User Role - 6 -

7 User Role When you first log in to the new DataVision web application, you must choose the user role that most closely matches your own role in your organization Your selection generates a tailored Dashboard and SmartReport to get you started You can then customize the preconfigured views To change your role, you must submit a support ticket - 7 -
8 User Role Managers and Directors Case Management / Disease Outcome Management Chief Nursing Officer Decision Support Infection Control Quality / Performance Improvement Risk Management / Safety Staff Core Data Abstractor Data Analyst / Data Management / Systems Analyst Decision Support Infection Control Medical Staff Office Midas+ System Manager Quality / Performance Improvement Risk Management / Safety Physicians Behavioral Health Cardiology Decision Support Endocrinology Hospitalist / General Medicine Gastroenterology Gynecology Nephrology Obstetrics / Perinatal Orthopedics Pulmonary Quality / Performance Improvement Risk Management / Safety Urology Vascular Vice President Medical Affairs (VPMA) - 8 -
9 Dashboard - 9 -
10 Dashboard
11 Dashboard Widget title and the date range for the data Performance score (represented by gold stars) Performance percentile Performance trend and character compared with the previous period Performance values Link to top and bottom performers Measure selection tool
12 Dashboard Performance Score Gold stars indicate facility performance for the time period Calculation of performance score: Sum (percentile rank for each active measure) (number of active measures * 100) Result is compared with performance of facilities in the Midas+ Comparative Database (CDB) for the same measures to determine the site s percentile. Only active measures contribute to the performance score
13 Dashboard Performance Score Gold Stars Meaning Rank 1 Poor 10 th percentile or lower 2 Below average 11 th to 25 th percentile 3 Average 26 th to 74 th percentile 4 Above average 75 th to 89 th percentile 5 Excellent 90 th percentile or higher
14 Dashboard Facility s performance percentile only active measures contribute to the performance percentile Trend arrow indicates performance trend and character compared with the previous period Trending down, good Trending down, bad Neutral trend Trending up, good Trending up, bad

15 Dashboard APR DRGs Mortality, LOS, and PPR Observed number of deaths, length of stay (LOS), or Potentially Preventable Readmission (PPR) chains for active measures Facility s observed number of deaths, LOS, or PPR chains divided by the expected value for active measures Performance percentile
16 Dashboard APR DRGs Mortality, LOS, and PPR Click the flag to view up to five of the bestperforming and of the worst-performing APR DRGs, providers, or Service Lines Based on the active measures in the widget

17 Dashboard Top and Bottom Performers APR DRGs Green flag a indicates top performer Red flag indicates a bottom performer Ranked by delta value Delta value is the observed value minus the expected value View by APR DRG, provider, or Service Line


18 Dashboard Rare Events and Complications The number of rare events observed during the period Click the number to view a list of those events The percentile performance and trend for complication measures only Top and bottom performers complication measures
19 Dashboard Core Measures Core Measures Compliance rate for active core measures Number of opportunities for improvement (OFI) Percentile performance for active measures in the widget

20 Dashboard Core Measures Click the flag to view a list of up to five of the best and worst performing core measures or core measure providers Based on active measures in the widget
21 Dashboard x-axis Percentile y-axis O/E Ratio APR DRG Performance Drag the period slide bar to view APR DRG mortality, LOS, and PPR performance for up to 8 periods. Hover cursor over a bubble to see the observed/expected ratio. Based on active measures in the widget
22 Dashboard X axis - Percentile Y axis - % Compliance Clinical Process of Care (Core) Performance Drag the period slide bar to view core measure topic performance for up to 8 periods. Based on active measures in the widget Click the wrench icon to select topics for the chart
23 Dashboard Parameter options Most recent 3 months Most recent harvested quarter Year to date Previous year
24 SmartReport Widgets
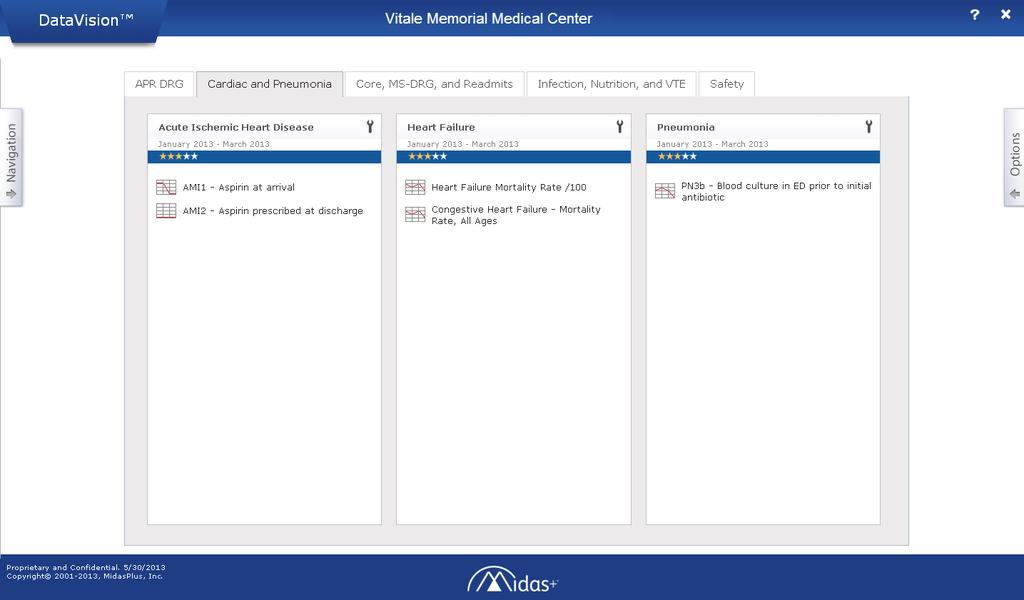
25 SmartReport
26 SmartReport Widgets Five widgets are displayed on the SmartReport and Dashboard APR DRG Length of Stay APR DRG Mortality Potentially Preventable Readmissions (3M PPRs) Core Measures Rare Events and Complications The selected measures in each widget are used to compute scores on the SmartReport and Dashboard. A widget must be on the SmartReport to be displayed on the Dashboard

27 SmartReport Widgets Title Date range for the data Measure selection tool add or remove a measure


28 SmartReport Widgets Measure Selection Drag a measure to or from the Active list. An active measure is displayed on the SmartReport if the facility performance differs from the CDB. Active measures contribute to your facility s performance score
29 SmartReport Widgets Performance Score Gold stars indicate facility performance for the time period. Calculation of performance score: Sum (percentile rank for each active measure) (number of active measures * 100) Result is compared with performance of facilities in the Midas+ CDB for the same measures to determine the site s percentile. Only active measures contribute to the performance score
30 SmartReport Widgets Performance Score Gold Stars Meaning Rank 1 Poor 10 th percentile or lower 2 Below average 11 th to 25 th percentile 3 Average 26 th to 74 th percentile 4 Above average 75 th to 89 th percentile 5 Excellent 90 th percentile or higher

31 SmartReport Widgets Performance Chart Shows performance trend over the most recent four periods

32 SmartReport Widgets Performance Chart Each vertical line represents a 3-month period or harvested quarter Each horizontal line represents a performance score (gold star rank) The top horizontal line represents excellent performance; the bottom line represents poor performance The red line connects the four data points to show performance over the most recent four periods
 below average Period 3 below average Period 2 below average Period 1 below average -")
33 SmartReport Widgets Period 4 (current) below average Period 3 excellent Period 2 poor Period 1 excellent Period 4 (current) poor Period 3 average Period 2 average Period 1 poor Period 4 (current) below average Period 3 below average Period 2 below average Period 1 below average
34 SmartReport Widgets A measure is displayed on the SmartReport if performance is: Below average or poor in the current 3-month period and in at least two of the three preceding periods. Below average or poor in the current 3-month period and above average or excellent in at least one of the three preceding periods. Poor in the current 3-month period and in at least one of the three preceding periods
 -")
35 SmartReport Widgets Rare/Serious Reportable Events icon Displays the number of rare events in the current period (or >9 if more than nine)

36 SmartReport Widgets MS-DRG Coding Analysis icon High performance is in the 90 th percentile or higher for the period Low performance is in the 10 th percentile or lower for the period
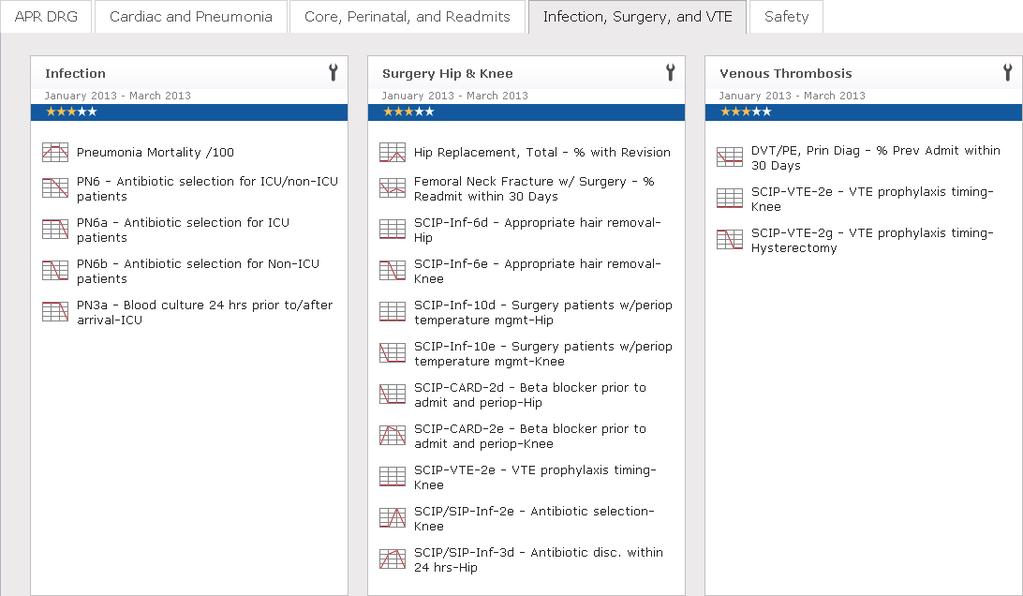
37 SmartReport Tab Configuration
38 SmartReport Tab Configuration Five configurable tabs Three configurable widgets on each tab Tab configuration is accessible through the Options bar

39 SmartReport Tab Configuration Tab names can be customized Widgets can be added, removed, repositioned
40 Navigation

41 Navigation Click the Navigation tab to display the menus. Left menu Navigate to the Dashboard, Platinum Quality Scorecard, or SmartReport Search with optional filters Right menu Navigation tree
 Readmission Frequency -")
42 Navigation Search by word, phrase, or measure number Available filters APR DRG Length of Stay (LOS) Complications Mortality Core Measure MS-DRG Cost of Care (requires license) Readmission Frequency

43 Navigation Options bar provides access to related reports
44 We can t wait to hear what you think!


45 - 45 -
46 Thank you for attending. Questions? Vanessa Dorr, RN, BSN, MSN DataVision Clinical Consultant Brenda Pettyjohn, RN, CPHQ DataVision Clinical Consultant 2013 Midas+ User Symposium
Product Overview 2007 MIDAS+ CPMS and DataVision. Vicky A. Mahn-DiNicola RN, MS, CPHQ Vice President and Product Manager ACS MIDAS+
 Product Overview 2007 MIDAS+ CPMS and DataVision Vicky A. Mahn-DiNicola RN, MS, CPHQ Vice President and Product Manager ACS MIDAS+ 2007 MIDAS+ CPMS and DataVision Client Base 533 Client Hospitals in comparative
Maximizing Your Use of Statit Physician Profile and Review (PPR)
") Maximizing Your Use of Statit Physician Profile and Review (PPR) Judi DeBord Midas+ System Development Specialist Nora Woolridge Midas+ Training Specialist Session Objectives By the conclusion of this
Maximizing Your Use of Statit Physician Profile and Review (PPR) Judi DeBord Midas+ System Development Specialist Nora Woolridge Midas+ Training Specialist Session Objectives By the conclusion of this
Understanding Core Measure Reports. Amy Schoenherr Project Manager Clinical Decision Support Services ACS MIDAS+
 Understanding Core Measure Reports Amy Schoenherr Project Manager Clinical Decision Support Services ACS MIDAS+ Comparative Reports & Detailed Reports Comparative Reports available on Clients Only https://www.midasplus.com/clients_only
2016 Symposium Agenda
 May 23 May 25, 2016 Tucson, Arizona 2016 Symposium Agenda See resort meeting space map on last page for session locations. SUNDAY, MAY 22 5:00 p.m. to 7:00 p.m. Early Registration... Midas+ Symposium Registration
Institutional Research & Effectiveness Power BI Quick Start Guide
 Accessing Stetson s Institutional Research Power BI Reports 1. Request Power BI License If you are a new user, you must request a Power BI license. Contact Institutional Research to request a license.
P6 Analytics Reference Manual
 P6 Analytics Reference Manual Release 3.2 December 2013 Contents Getting Started... 7 About P6 Analytics... 7 Prerequisites to Use Analytics... 8 About Analyses... 9 About... 9 About Dashboards... 10
Contents Getting Started... 7 Sample Dashboards... 12
 P6 Analytics Reference Manual Release 3.4 September 2014 Contents Getting Started... 7 About P6 Analytics... 7 Prerequisites to Use Analytics... 8 About Analyses... 9 About... 9 About Dashboards... 10
Employee Portal Quick Reference Guide
 Employee Portal Quick Reference Guide Your Action Items When you reach the UNC Employee Portal, the first screen you will see is Your Action Items. This will be a list of items that require your attention.
NAVIGATING THE MANAGER DASHBOARD
 HR ADMIN GUIDE NAVIGATING THE MANAGER DASHBOARD An eligible manager will receive an email invite with reporting site login information to view their reports and survey data. Included in the invite will
Find Your Service Level Agreement (SLA) Information for AT&T Network Functions on Demand Easily Locate Your SLA Credits
 Information for AT&T Network Functions on Demand Easily Locate Your SLA Credits") Find Your Service Level Agreement (SLA) Information for AT&T Network Functions on Demand Easily Locate Your SLA Credits November, 206 NOTE: AT&T Network Functions on Demand is now AT&T FlexWare. This change
Find Your Service Level Agreement (SLA) Information for AT&T Network Functions on Demand Easily Locate Your SLA Credits November, 206 NOTE: AT&T Network Functions on Demand is now AT&T FlexWare. This change
START Saratoga Taking Action and Report Tool Help Document
 www.pwc.com/workforce-analytics START Saratoga Taking Action and Report Tool Help Document Table of contents Introduction...1 Dashboard... 2 Common report features... 3 Metrics... 5 Contact for Further
TimeSaver Training - Managers & Supervisors
 TimeSaver Training - Managers & Supervisors 1. To begin, open TimeSaver 8 from the icon on your desktop. 2. Enter your employee ID and your password. Hit enter or the right arrow to log on. 3. If you have
Midas+ Statit Panel. 22nd Annual Midas+ User Symposium June 2 5, 2013 Tucson, Arizona. Tuesday, June 4, 2:30 pm
 22nd Annual Midas+ User Symposium June 2 5, 2013 Tucson, Arizona Tuesday, June 4, 2:30 pm A panel of Midas+ Statit pimd and PPR clients will discuss their use of these solutions, providing examples of
INTRO TO WORK PLANNING IN MIRADI 4.4
 INTRO TO WORK PLANNING IN MIRADI 4.4 Overview of Work Plan High Level Work Planning Adding Financial Information Analyzing & Using Work Plan Data Key Work Plan Controls Detailed Work Planning Work Planning
REFERENCE GUIDE. January, 2018
 REFERENCE GUIDE January, 2018 1 Contents Introductory Evaluation for New Hires and Transfers... 3 Adding Goals After Introductory Eval... 5 Re-Evaluation: Introductory & Annual... 7 Focus Review 1 and
PRACTICE USER GUIDE. For Practice Performance Registry. Rachel Bryan Updated
 PRACTICE USER GUIDE For Practice Performance Registry Rachel Bryan Rachel.bryan@dartnet.info Updated 01-21-2014 0 P a g e Practice User Guide Welcome, Practice User. This Guide will help you login and
Welcome to CalJOBS Case Management: Participation and Activities.
 Welcome to CalJOBS Case Management: Participation and Activities. This module will explain the following: Creating Participation- Once eligibility is established through the application, create participation
Product: ODTView. Subject: Basic Overview of Delivery and Orders Tab. Version: December 6, Distribution: Customer
 Product: ODTView Subject: Basic Overview of Delivery and Orders Tab Version: December 6, 2016 Distribution: Customer Setting Up Delivery and Orders Tab Log into ODT Viewer with an Admin user Navigate to
IT portfolio management template User guide
 IBM Rational Focal Point IT portfolio management template User guide IBM Software Group IBM Rational Focal Point IT Portfolio Management Template User Guide 2011 IBM Corporation Copyright IBM Corporation
Project and Portfolio Management Center
 Project and Portfolio Management Center Software Version: 9.42 Portfolio Management Configuration Guide Go to HELP CENTER ONLINE http://admhelp.microfocus.com/ppm/ Document Release Date: September 2017
Implementing Statit PPR: Transforming Provider OPPE Reporting from Paper to an Electronic Solution
 22nd Annual Midas+ User Symposium June 2 5, 2013 Tucson, Arizona Implementing Statit PPR: Transforming Provider OPPE Reporting from Paper to an Electronic Solution Monday, June 3, 2:30 pm During this session
How to Navigate the Dashboards
 Proprietary Notice Information: This document is provided for informational purposes only, and the information herein is subject to change without notice. While every effort has been made to ensure that
A. Locating the Job Requisition:
 Keep in Mind Hiring managers are assigned the role of recruiting screener in Workday, which allows access to review all applicant information. If you do not have access for the job(s) you re hiring for
User s Guide. (c) worksample by William Blank, technical writer, C-Secure Scorecard Balanced Performance Management System:
 worksample by William Blank, technical writer, C-Secure Scorecard Balanced Performance Management System:") unenduser.fm Page 1 Friday, January 24, 2003 9:52 AM C-Secure Scorecard Balanced Performance Management System: User s Guide Introduction The C-Secure SCORECARD Balanced Performance Management System provides
unenduser.fm Page 1 Friday, January 24, 2003 9:52 AM C-Secure Scorecard Balanced Performance Management System: User s Guide Introduction The C-Secure SCORECARD Balanced Performance Management System provides
The Benchmarking module
 5 45 5.1 What is the Benchmarking module? lets you easily evaluate your research performance in comparison to others. How does your institution compare to others in your region, country or the world? Choose
Engagement Portal. Employee Engagement User Guide Press Ganey Associates, Inc.
 Engagement Portal Employee Engagement User Guide 2015 Press Ganey Associates, Inc. Contents Logging In... 3 Summary Dashboard... 4 Results For... 5 Filters... 6 Summary Page Engagement Tile... 7 Summary
Lab 20: Excel 3 Advanced
 Lab 20: Excel 3 Advanced () CONTENTS 1 Lab Topic... Error! Bookmark not defined. 1.1 In-Lab... 27 1.1.1 In-Lab Materials... 27 1.1.2 In-Lab Instructions... 27 1.2 Out-Lab... 33 1.2.1 Out-Lab Materials...
.Scouting Tools District Level
 my.scouting Tools my.scouting Tools is best experienced using Firefox 14 or greater, Google Chrome 21 or greater, Apple Safari 6 or greater, and Internet Explorer 9.0 or greater. 1 The Training Manager
Executive Dashboard. Executive Dashboard is a powerful business intelligence tool that allows owners, managers and executives to:
 Executive Dashboard Executive Dashboard is a powerful business intelligence tool that allows owners, managers and executives to: Easily see trends that exist within the data that is imputed into PestPac.
Marathon Data Systems
 Marathon Data Systems Executive Dashboard Executive Dashboard is a powerful business intelligence tool that allows owners, managers and executives to: Easily see trends that exist within the data that
SAS VISUAL ANALYTICS HANDS-ON
 SAS VISUAL ANALYTICS HANDS-ON USING TEXT ANALYTICS SAS FORUM 2015 JEPPE DEIGAARD 1 About SAS Visual Analytics Whether you are a business user with limited technical skills, a statistician or a data scientist,
About SMART Practice Aids - Field Work
 About SMART Practice Aids - Field Work SMART Practice Aids Field Work is the newest addition to PPC s SMART Audit Suite. You can now plan and execute the entire PPC audit process within the SMART Suite,
Workflow Designer. Feature Guide. Visualize and Automate Your Business Processes
 Feature Guide Workflow Designer Visualize and Automate Your Business Processes Workflow Designer... Example Approval Process... Flow Diagram for a Business Process... Business Process in Workflow Designer...
Scheduler Book Mode User Guide Version 4.81
 Scheduler Book Mode User Guide Version 4.81 Contents Introduction...2 Scheduler Active Tab...2 Appointment Colors and Markings...2 Setting Book Mode...3 Active Tab Options...3 Active Tab Use...3 Active
Call Management Version 6.6 User Guide
 Call Management Version 6.6 User Guide Overview Call Management is purpose built software for all PBXs. It provides a complete communications management suite for all users of the system. Users are able
my.scouting Tools Training-Home Trend Chart Training Summary Report
 my.scouting Tools Training-Home my.scouting Tools is best experienced using the latest version of Google Chrome or Mozilla Firefox. Also works with the latest version of Safari, and Internet Explorer (v11).
KNOWLEDGE Builder. WORKDAY: Nursing Workflow. Try It Out
 KNOWLEDGE Builder WORKDAY: Nursing Workflow Use this process to complete a performance appraisal for employees who are RNs or LPNs, and who do not require an additional clinical reviewer. On-screen instructions
points in a line over time.
 Chart types Published: 2018-07-07 Dashboard charts in the ExtraHop system offer multiple ways to visualize metric data, which can help you answer questions about your network behavior. You select a chart
REPORTS. Version 5.5 5/15/2014. Page 0 of SmartLinx Solutions, LLC.
 REPORTS Version 5.5 Sample Reports The definitive list of standard Schedule Optimizer, Time & Attendance, and HRMS reports. Samples, descriptions, filtering options and parameters are included for all
3rd Global Congress On Medical & Clinical Case Reports Theme: Medical & Clinical Exploration By Global Experts About the Conference: Aim
 3rd Global Congress On Medical & Clinical Case Reports Theme: Medical & Clinical Exploration By Global Experts About the Conference: Gavin Conferences invites participants from all over the world to attend
BUSINESS ANALYTICS. Version 5.8
 BUSINESS ANALYTICS Version 5.8 Corporate Planning & Control The Business Analytics module was designed to provide senior management with the ability to view and control the entire organization s staffing
Performance Manager 5.0.6
 RELEASE NOTES Performance Manager 5.0.6 Release Date: December 10, 2015 Table of Contents Introduction... 3 System Requirements... 3 Release Details... 5 New Feature HealthcareSource Leadership Assessment...
REPORTING ON HISTORICAL CHANGES IN YOUR DATA
 REPORTING ON HISTORICAL CHANGES IN YOUR DATA Summary Get deeper insight and make data-driven decisions by analyzing your organization's activity over over the last three months. Report on Historical Changes
Quick Reference. Virtual OneStop (VOS) Employer User. Logging In
 Employer User. Logging In") Virtual OneStop (VOS) Employer User Logging In If you don t have an account: Click the link Not Registered? on the Home page, near the Sign In button, (name may vary, but will include Register in the link
Virtual OneStop (VOS) Employer User Logging In If you don t have an account: Click the link Not Registered? on the Home page, near the Sign In button, (name may vary, but will include Register in the link
Referral Training Exercise 3: Review and Hiring Manager
 Referral Training Exercise 3: Review and Hiring Manager Now that you have completed the online portion of training for Referral, it is time to log into the Stage environment of USA Staffing to practice
EDQ Dashboard Essentials
 EDQ Dashboard Essentials January, 2015 Introduction to the EDQ Dashboard Zero training monitoring of data quality KPIs The Dashboard in EDQ provides a view of published Data Quality Metrics, tailorable
Integrating PPC s SMART Practice Aids with Engagement CS (Best Practices)
") Integrating PPC s SMART Practice Aids with Engagement CS (Best Practices) Select a SMART Practice Aids client engagement for the first time in Engagement CS Prior to launching SMART Practice Aids, open
Integrating PPC s SMART Practice Aids with Engagement CS (Best Practices) Select a SMART Practice Aids client engagement for the first time in Engagement CS Prior to launching SMART Practice Aids, open
Our objectives today will be to review Outcomes Report layout and how to use the metrics to gauge how your site is doing in relation to all of the
 Our objectives today will be to review Outcomes Report layout and how to use the metrics to gauge how your site is doing in relation to all of the other IMPACT participants. We will discuss how to determine
How to view Results with. Proteomics Shared Resource
 How to view Results with Scaffold 3.0 Proteomics Shared Resource An overview This document is intended to walk you through Scaffold version 3.0. This is an introductory guide that goes over the basics
BEST PRACTICES. SMART Audit Suite with Engagement CS. Table of Contents. Integrating SMART Audit Suite Working with the SMART Suite...
 BEST PRACTICES SMART Audit Suite with Engagement CS Table of Contents Integrating SMART Audit Suite... 2 Working with the SMART Suite... 4 Create SMART Docs... 7 Using Checkpoint Tools and SMART Audit
Performance Assessment System. Student Manual
 Student Manual Welcome to Acadaware s Performance Assessment System (PAS) Student Manual. This manual will walk you through the PAS step by step. To access the PAS log into Acadaware.com If you have any
IT portfolio management template
 IT portfolio management template User guide lessons IBM Rational Focal Point version 6.5.1 October 2011 Copyright IBM Corporation 1997, 2011 U.S. Government Users Restricted Rights - Use, duplication,
Contents Getting Started... 9 Sample Dashboards... 17
 Analytics Reference Guide 16 R1 March 2016 Contents Getting Started... 9 About Oracle Primavera Analytics... 10 Prerequisites to Use Primavera Analytics... 11 About Analyses... 11 About s... 12 About
CONNECTICUT DSS ELECTRONIC VISIT VERIFICATION (EVV) PROGRAM PROVIDER TRAINING: BILLING. July August 2016
 PROGRAM PROVIDER TRAINING: BILLING. July August 2016") CONNECTICUT DSS ELECTRONIC VISIT VERIFICATION (EVV) PROGRAM PROVIDER TRAINING: BILLING 8 July August 2016 AGENDA 1. Billing Overview 2. Not OK to Bill Process 3. Getting Ready to Bill 4. Creating Invoices
CONNECTICUT DSS ELECTRONIC VISIT VERIFICATION (EVV) PROGRAM PROVIDER TRAINING: BILLING 8 July August 2016 AGENDA 1. Billing Overview 2. Not OK to Bill Process 3. Getting Ready to Bill 4. Creating Invoices
Welcome to the Project Manager guide
 Contents Getting around... 3 Creating a new project... 4 Selecting an existing project... 6 Dashboards... 6 Project planning... 9 Project roles... 9 Gantt view... 11 Adding a task in Gantt view... 12 Parent
IBM TRIRIGA Version Getting Started User Guide
 IBM TRIRIGA Version 10.3.1 Getting Started User Guide Note Before using this information and the product it supports, read the information in Notices on page 82. This edition applies to version 10, release
Excel 2011 Charts - Introduction Excel 2011 Series The University of Akron. Table of Contents COURSE OVERVIEW... 2
 Table of Contents COURSE OVERVIEW... 2 DISCUSSION... 2 OBJECTIVES... 2 COURSE TOPICS... 2 LESSON 1: CREATE A CHART QUICK AND EASY... 3 DISCUSSION... 3 CREATE THE CHART... 4 Task A Create the Chart... 4
Release Highlights 2.2
 Release Highlights 2.2 Rapattoni Magic-Cloud AMS 2.2 is here! This exciting new version gives your association access to the enhancements listed below as well as a number of maintenance updates. The following
BI Portal User Guide
 Contents 1 Overview... 3 2 Accessing the BI Portal... 3 3 BI Portal Dashboard... 3 3.1 Adding a new widget... 4 3.2 Customizing an Existing Widget... 8 3.3 Additional Widget Operations... 9 4 Widget Gallery...
Oracle Revenue Management and Billing Product Manager s Workbench. User Guide. Version Revision 1.1. E December, 2018
 Oracle Revenue Management and Billing Product Manager s Workbench Version 2.7.0.0.0 User Guide Revision 1.1 E88591-01 December, 2018 Copyright 2017, Oracle and/or its affiliates. All rights reserved. 1
A WegoWise Primer: Identifying Heating Energy Intensity and Water Consumption Metrics
 A WegoWise Primer: Identifying Heating Energy Intensity and Water Consumption Metrics This document provides specific guidance to WegoWise users about two metrics: heating energy intensity (HEI) and water
CU Careers: Step-by-Step Guide
 CU Careers: Step-by-Step Guide Background Check Process This guide contains information for background check coordinators (BCCs) to run HireRight background checks through CU Careers. Background checks
etime Version 8 Quick Reference Card for Hourly View Employees Time & Attendance Version 8.0 Opening Time & Attendance Signing Out Logging On
 etime Version 8 Time & Attendance Version 8.0 Quick Reference Card for Hourly View Employees The following instructions describe a typical employee persona configuration. The names and location of widgets
Supervisor Dashboard. Use the Supervisor Dashboard to monitor and respond to critical time and labor events.
 Supervisor Dashboard Use the Supervisor Dashboard to monitor and respond to critical time and labor events. View the current status of employees, pending time off requests, attendance exceptions, and missed
Tableau and Cerner's HealtheIntent Advancing health and care
 Welcome # T C 1 8 Tableau and Cerner's HealtheIntent Advancing health and care Peter Smart Senior Director & Solution Executive, Analytics Cerner Corporation Agenda About Cerner Cerner and Tableau Population
CORPORATE PLANNING & CONTROL SYSTEM
 CORPORATE PLANNING & CONTROL SYSTEM Version 5.5 CPCS The Corporate Planning and Control System was designed to provide senior management with the ability to view and control the entire organization s staffing
LOGGING ON, ONBOARDING AND VIEWING YOUR PROFILE
 EMPLOYEE SELF SERVICE (ESS) USER GUIDE DESKTOP USERS LOGGING ON, ONBOARDING AND VIEWING YOUR PROFILE Logging On Your log on details will be contained in your system launch letter/email. The first time
SHP Scorecards: SHP FOR AGENCIES. Practical Applications for Compensation Incentive Models. Zeb Clayton VP of Client Services, SHP
 SHP FOR AGENCIES Zeb Clayton VP of Client Services, SHP Chris Attaya VP of Business Intelligence, SHP Carolyn Flietstra Executive Vice President, Atrio Home Care SHP Scorecards: Practical Applications
Morningstar Direct SM Scorecard
 Within the Performance Reporting functionality, use the Scorecard to assign weighting schemes to data points and create custom criteria based on those quantitative and qualitative factors to calculate
BI360 for Healthcare Providers. Enabling World-class Decisions for Healthcare Providers A Solver Vertical Industry White Paper
 BI360 for Healthcare Providers Enabling World-class Decisions for Healthcare Providers A Solver Vertical Industry White Paper Updated: Nov 2017, Document Version 4 Solver, Inc. www.solverglobal.com Copyright
Infor HR Manager/Proxy Guide
 Putting the Pieces Together Part of the selection process involves interviewing applicants. The system assists in tracking of these interviews, as well as other types of communication with applicants (emails,
Using Data for Quality Improvement Seton 1
 Using Data for Quality Improvement 2015 Seton 1 Presenter Disclosure Information Anne Robinson, MS, BSN, RN Seton Network Cardiovascular Analytic and Quality Manager FINANCIAL DISCLOSURE: None UNLABELED/UNAPPROVED
Human Capital Management: Step-by-Step Guide
 Human Capital Management: Step-by-Step Guide Getting Started with HCM This guide describes a few tasks to help new users get started with HCM. Before you can access HCM, you must complete the HCM Fundamentals
This course explores the options available in the new role-based cockpit available for SAP Business One on HANA.
 This course explores the options available in the new role-based cockpit available for SAP Business One on HANA. 1 At the end of this topic, you will be able to: List the advantages of the new role-based
GYANVRIKSH INTERACTIVE PVT LTD III Foor, QZ Plaza, Opp Haveli Restaurant, Kothaguda, Kondapur Hyderabad , &
 Introduction and Getting Started (Desktop & Server) Why Tableau? History of Tableau Products of Tableau Tableau Desktop Tableau Server Tableau Public Tableau Online Tableau Reader Architecture of Tableau
Radian6 Overview What is Radian6?... 1 How Can You Use Radian6? Next Steps... 9
 Radian6 Overview What is Radian6?... 1 How Can You Use Radian6?... 6 Next Steps... 6 Set up Your Topic Profile Topic Profile Overview... 7 Determine Your Keywords... 8 Next Steps... 9 Getting Started Set
KeyedIn Projects Timesheet Only User Guide
 KeyedIn Projects Timesheet Only User Guide Version 2.0 July 27, 2012 Timesheet Only User Guide 1 2012 KeyedIn Solutions, Inc. Welcome to the Timesheet User Guide. This user guide will provide you with
Compensation Management Guide
 Compensation Management Guide Pay Grades Go to Company Settings > HR Setup > Pay Grades a. Code : Enter a code for the pay grade b. Pay Grade : Enter a name for the pay grade c. Description : Enter an
Automatic Trade Selection by Ed Downs
 Automatic Trade Selection by Ed Downs Tutorial Agenda: Pre-Release 2A How ATS Works Using ATS Building ATS Methods ATS and other features have been enhanced for Pre-Release 2A. Release Notes Pre-Release
Monitor your network and report service issues quickly
 Monitor your network and report service issues quickly Map and maintenance capabilities for your available AT&T services on Business Center October 206 206 AT&T Intellectual Property. All rights reserved.
Version No: 3.0, Build No: 3. Portal Release Notes V3B3
 Version No: 3.0, Build No: 3 Portal Release Notes V3B3 Table of Contents Important Note: The current version of V3B3 is supported with Compatibility View Settings OFF for IE (Internet Explorer) browsers....
Quick Start Guide Coles Product Catalogue
 Product Catalogue Quick Start Guide Coles Product Catalogue This Coles Product Catalogue (CPC) is a free online portal for Coles suppliers. The CPC enables you to enter, validate, store and maintain master
LiveEngage Report Builder
 LiveEngage Report Builder Overview Version 1.3 August 2018 Contents Introduction Key Features of Report Builder Getting Started with Report Builder Accessing Report Builder Viewing reports Filtering reports
Personal Financial Management
 Personal Financial Management Note - Click the heading in each section to view the answers for each section. Personal Financial Management FAQs: 1. What is Personal Financial Management? 2. What are the
Request Central Users Guide
 Request Central Users Guide Overview This user guide describes the procedures for operating the IBM TRIRIGA Request Central module. This user guide goes through a step by step scenario to emulate how the
User Guide. Cerner 724Access Downtime Viewer
 User Guide Cerner 724Access Downtime Viewer Version: 6 Date: April 16, 2013 TABLE OF CONTENTS Cerner 724Access Downtime Viewer What is the 724Access Downtime Viewer?... 1 What To Do When a Computer Downtime
V4 SQL Dashboard Features
 V4 SQL Dashboard Features 2000-2016 NECS, Inc. All Rights Reserved. I entrée V4 SQL System Guide Table of Contents Chapter I Contact NECS 1 Chapter II Using Dashboards 2 1 Dashboard... Features 2 2 Inventory...
Guide to Using TopOPPS TARGET Forecasting
 Guide to Using TopOPPS TARGET Forecasting Copyright and Trademark Notice Copyright 2016 TopOPPS, Inc. All rights reserved. TopOPPS Administrator Guide The information in this document is furnished for
Microsoft Office: Excel 2013
 Microsoft Office: Excel 2013 Intro to Charts University Information Technology Services Training, Outreach and Learning Technologies Copyright 2014 KSU Department of University Information Technology Services
Rev 01 Nov RFI s Request for Information
 Rev 01 Nov 2008 RFI s Request for Information Index Purpose:... 2 RFI Process... 2 Configuring the Category for RFI s... 3 Configuring the Master Data for RFI s... 3 Setting Security for RFI s... 4 Logging
Notice: Falsification of timesheets, whether submitting or approving, can be grounds for immediate termination.
 Employee Functions Time & Attendance Experience the Workforce system from the employee perspective. Learn Workforce navigation fundamentals and functions related to reporting time, activities, and absences
QUICKBOOKS PREMIER 2010/11
 QUICKBOOKS PREMIER 2010/11 INTRODUCTION AND NOTES FOR TEACHERS QuickBooks Premier is a commercial accounting package designed for small and medium sized businesses. It is a flexible and comprehensive package
OSIS Users Guide WUSM OSIS USERS GUIDE. This guide is intended to help you begin using OSIS for monitoring and tracking space
 OSIS Users Guide WUSM OSIS USERS GUIDE This guide is intended to help you begin using OSIS for monitoring and tracking space 0 Information in OSIS by the Systems of Record OSIS Online Spatial Information
Demystifying P6 EPPM Dashboards
 Demystifying P6 EPPM Dashboards Session ID#: 200620 Prepared by: Marie Gunnerson Global Primavera Manager Parsons Brinckerhoff @MarieGunnerson REMINDER Check in on the COLLABORATE mobile app Presenter
Performance Assessment System. Clinical Instructor Manual
 Clinical Instructor Manual Welcome to Acadaware s Performance Assessment System (PAS) Clinical Instructor Manual. This manual will walk you through the PAS step by step. To access the PAS log into Acadaware.com
HR Business Partner Guide
 HR Business Partner Guide March 2017 v0.1 Page 1 of 10 Overview This guide is for HR Business Partners. It explains HR functions and common actions HR available to business partners and assumes that the
CA Clarity PPM. New Product Development Product Guide. v2.0.00
 CA Clarity PPM New Product Development Product Guide v2.0.00 This documentation, which includes embedded help systems and electronically distributed materials, (hereinafter referred to as the Documentation
Cloud Management Platform Overview First Published On: Last Updated On:
 Cloud Management Platform Overview First Published On: 06-09-2016 Last Updated On: 07-25-2017 1 Table of Contents 1. Cloud Management Platform Overview 1.1.Cloud Consumer Request/Catalog 1.2.Cloud Admin
Effort Certification Effort Coordinator Training Guide. Certification Workflow. Guide to understanding the certification process using ecrt.
 Effort Certification Effort Coordinator Training Guide Guide to understanding the certification process using ecrt. Certification Workflow The certification workflow occurs on a quarterly basis. Faculty
Midas+ Product Update. Lu Calkins Vice President, Product Operations and Design
 Midas+ Product Update Lu Calkins Vice President, Product Operations and Design Daily Navigation Is Like a Maze The Path May Be Difficult To See Or Change With The Times Regardless We are Partners What