FACES IV Package. Administration Manual. David H. Olson Ph.D. Dean M. Gorall Ph.D. Judy W. Tiesel Ph.D.
|
|
|
- Cecily Rogers
- 6 years ago
- Views:
Transcription
1 FACES IV Package Administration Manual David H. Olson Ph.D. Dean M. Gorall Ph.D. Judy W. Tiesel Ph.D Version 3/ Life Innovations, Inc. Life Innovations P.O. Box 190 Minneapolis, MN 55440
2 FACES IV Administration Manual Table of Contents Preface...3 FACES IV Scales with Item Numbers...5 FACES IV Package: Background Information...7 FACES IV Package: Questionnaire...8 FACES IV Package: Answer Sheet...10 FACES IV: Scoring & Plotting by Hand...11 Percentile Conversion Charts Family Communication: Scoring & Interpretation...14 Family Satisfaction: Scoring & Interpretation...15 Using Excel to Store and Score FACES IV...16 Creating Circumplex Ratio Scores (for research purposes)...16 FACES IV Profile: Six Family Types...17 FACES IV Profile: Plotting Chart...18 Circumplex Model & FACES IV
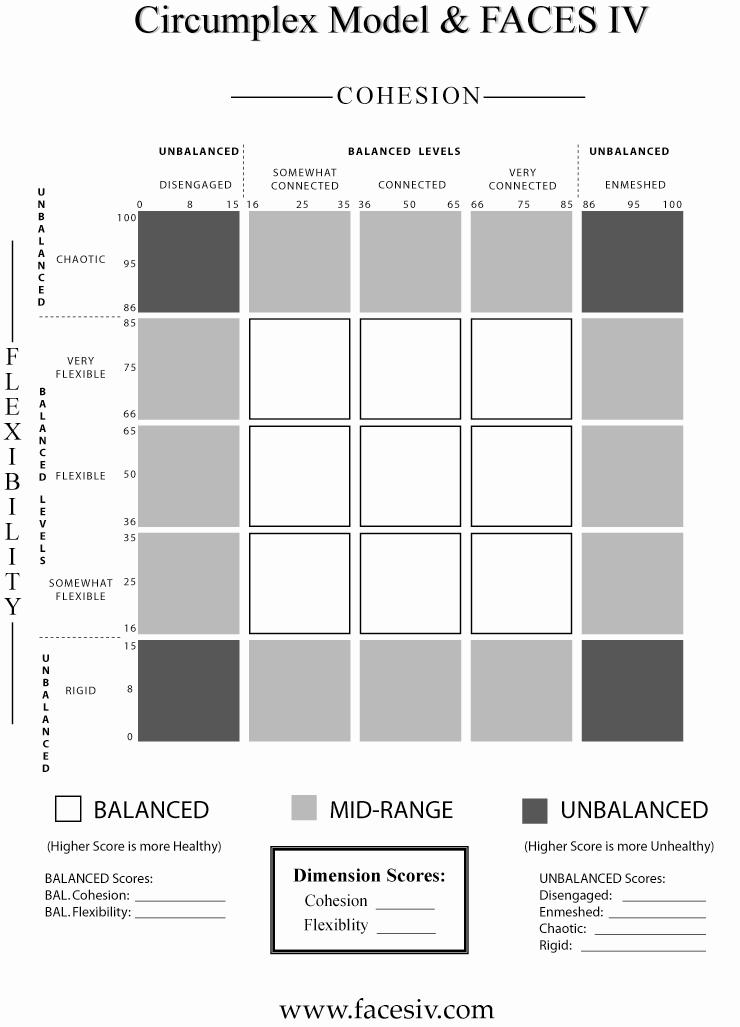
3 PREFACE Overview of Manual: This is the Administration Manual for the FACES IV Package that contains eight scales, six scales from FACES IV, and the Family Communication and Family Satisfaction scales. The FACES IV Package contains 62 items, 42 items from FACES IV and 10 on Family Communication and 10 on Family Satisfaction. The entire FACES IV Package of 62 items must be used in any study using FACES IV. FACES IV measures the dimensions of family cohesion and family flexibility using six scales. There are two balanced scales that assess balanced family cohesion and balanced family flexibility and they are similar to FACES II. FACES IV also contains four unbalanced scales that assess the high and low extremes of cohesion and flexibility. There are two unbalanced scales for cohesion which are disengaged and enmeshment. There are two unbalanced scales for flexibility which are rigid and chaotic. This Manual contains materials that you can use for administering, scoring and plotting FACES IV scores, Family Communication and Family Satisfaction onto the FACES IV Profile Summary and the revised Circumplex Model. There are two brief manuals for Family Communication and Family Satisfaction scales included in the package. Permission to Use FACES IV Package: Complete Family Abstract Form In order to use FACES IV for clinical work or in a research study, you need to complete the Family Abstract Form. Once we receive the completed Abstract Form, we will give you permission to use the FACES IV Package. Once approved, you have permission to reproduce unlimited number of copies of FACES IV Package for your research project or clinical work. Persons who want to use the FACES IV Package must purchase their own copy of the FACES IV Package and obtain permission to use the materials in their study. 3
4 After Your Study is Completed: Send Summary Report to Life Innovations Once you have completed your study or clinical project, we would like a copy of the summary report of your project. This should be completed using the following headings: title, hypotheses or goals, sample, research design, research methods, data analysis, findings related to FACES IV and conclusion. Excel Spreadsheet for Storing and Scoring the FACES IV Profile: We have created an Excel file for tracking your subjects answers that will automatically score the data for you. The Excel program will take each item response and sum them for each of the six FACES IV scales. The Total Raw Score is converted into Percentage Score using the Percentile Conversion Chart. The percentile score for the following six scales are provided: Balanced Cohesion, Balanced Flexibility, Disengaged, Enmeshed, Rigid & Chaotic. The Excel program will also create a Cohesion Ratio, Flexibility Ratio and Total Circumplex Ratio scores. The Excel program will also sum the 10 items in the Family Communication and Family Satisfaction scales and provides a Total Raw Score and percentile score for these two scales. Sharing of Data with Life Innovations for Creating National Norms: In order to develop a large and diverse norm base for the FACES IV Profile, we are requesting that you provide Life Innovations with a duplicate set of your data. We will give credit to you as providing data for the norm base. We would like to receive the data in an Excel File (Microsoft) we have designed, which is located on the website. Your data will only be used for updating our national norms and for additional analysis on reliability and validity of the scales. No individual analysis will be done with your data. This sharing of data is voluntary, but it will be greatly appreciated by us and other family scholars. Translation of FACES IV If you are willing to translate FACES IV, you will be given FACES IV at no cost and you will be given credit for the translation. You must follow the Translation Guidelines provided by Life Innovations at: Cost of FACES IV: The cost for unlimited copies of FACES IV and permission to use it for a research project or clinical assessment is $95. This fee is only for the person who purchases the assessment and completes a Family Abstract Form. Student discounts for doctoral dissertations is $75. For more information, go to: 4
5 FACES IV Scales with Item Numbers Balanced Cohesion TWO BALANCED SCALES 1. Family members are involved in each others lives. 7. Family members feel very close to each other. 13. Family members are supportive of each other during difficult times. 19. Family members consult other family members on important decisions. 25. Family members like to spend some of their free time with each other. 31. Although family members have individual interests, they still participate in family activities. 37. Our family has a good balance of separateness and closeness. Balanced Flexibility 2. Our family tries new ways of dealing with problems. 8. Parents equally share leadership in our family. 14. Discipline is fair in our family. 20. My family is able to adjust to change when necessary. 26. We shift household responsibilities from person to person. 32. We have clear rules and roles in our family. 38. When problems arise, we compromise. 5
6 Disengaged FOUR UNBALANCED SCALES: 3. We get along better with people outside our family than inside. 9. Family members seem to avoid contact with each other when at home. 15. Family members know very little about the friends of other family members. 21. Family members are on their own when there is a problem to be solved. 27. Our family seldom does things together. 33. Family members seldom depend on each other. 39. Family members mainly operate independently. Enmeshed 4. We spend too much time together. 10. Family members feel pressured to spend most free time together. 16. Family members are too dependent on each other. 22. Family members have little need for friends outside the family. 28. We feel too connected to each other. 34. We resent family members doing things outside the family. 40. Family members feel guilty if they want to spend time away from the family. Rigid 5. There are strict consequences for breaking the rules in our family. 11. There are clear consequences when a family member does something wrong. 17. Our family has a rule for almost every possible situation. 23. Our family is highly organized. 29. Our family becomes frustrated when there is a change in our plans or routines. 35. It is important to follow the rules in our family. 41. Once a decision is made, it is very difficult to modify that decision. Chaotic 6. We never seem to get organized in our family. 12. It is hard to know who the leader is in our family. 18. Things do not get done in our family. 24. It is unclear who is responsible for things (chores, activities) in our family. 30. There is no leadership in our family. 36. Our family has a hard time keeping track of who does various household tasks. 42. Our family feels hectic and disorganized. 6
7 FACES IV: Background Information Subject ID (4 digit) Age: Sex: M: F: Date: Education: (a) Some High School (b) Completed High School (c) Some college (d) Completed College (e) Advanced Degree Income: (If relevant) (a) Less than $10,000 (b) $10-20,000 (c) $20-30,000 (d) $30-40,000 (e) $40-50,000 (f) $50-60,000 (g) $60-80,000 (h) $80-100,000 (i) $100,000 or more Ethnic Background: (check all that apply) (a) Asian American (d) Hispanic/Latino (g) White/Caucasian (b) Black/African American (e) Mixed Race (c) Hawaiian or Pac. Islander (f) Native American Current relationship status: (a) Single, never married (b) Single, divorced (c) Single, widowed (d) Married, first marriage Current living arrangement: (a) Alone (b) With Parents (c) With Partner (e) Married, not first marriage (f ) Life-partnership (g) Living together (h) Separated (d) With Others (e) With Children (f ) With Partner and Children Use Current Family: If no current Family, use Family of Origin Family Structure: (a) Two parents (biological) (d) Two Parent (same sex) (b) Two parents (step family) (e) One Parent (c) Two parents (adoptive) Family Member: (a) Father (c) First Child (e) Third Child (b) Mother (d) Second Child (f) Fourth or Younger Child Number of Children (a) None (b) One (c) Two (d) Three in Family: (e) Four (f) Five (g) Six or more 7
8 FACES IV: Questionnaire Directions to Family Members: 1. All family members over the age 12 can complete FACES IV. 2. Family members should complete the instrument independently, not consulting or discussing their responses until they have been completed. 3. Fill in the corresponding number in the space on the provided answer sheet Generally Undecided Generally Disagree Agree Strongly Disagree 1. Family members are involved in each others lives. 2. Our family tries new ways of dealing with problems. 3. We get along better with people outside our family than inside. 4. We spend too much time together. 5. There are strict consequences for breaking the rules in our family. 6. We never seem to get organized in our family. Strongly Agree 7. Family members feel very close to each other. 8. Parents equally share leadership in our family. 9. Family members seem to avoid contact with each other when at home. 10. Family members feel pressured to spend most free time together. 11. There are clear consequences when a family member does something wrong. 12. It is hard to know who the leader is in our family. 13. Family members are supportive of each other during difficult times. 14. Discipline is fair in our family. 15. Family members know very little about the friends of other family members. 16. Family members are too dependent on each other. 17. Our family has a rule for almost every possible situation. 18. Things do not get done in our family. 19. Family members consult other family members on important decisions. 20. My family is able to adjust to change when necessary. 21. Family members are on their own when there is a problem to be solved. 22. Family members have little need for friends outside the family. 23. Our family is highly organized. 24. It is unclear who is responsible for things (chores, activities) in our family. 25. Family members like to spend some of their free time with each other. 26. We shift household responsibilities from person to person. 27. Our family seldom does things together. 28. We feel too connected to each other. 29. Our family becomes frustrated when there is a change in our plans or routines. 30. There is no leadership in our family. 8
9 Generally Undecided Generally Disagree Agree Strongly Disagree Strongly Agree 31. Although family members have individual interests, they still participant in family activities. 32. We have clear rules and roles in our family. 33. Family members seldom depend on each other. 34. We resent family members doing things outside the family. 35. It is important to follow the rules in our family. 36. Our family has a hard time keeping track of who does various household tasks. 37. Our family has a good balance of separateness and closeness. 38. When problems arise, we compromise. 39. Family members mainly operate independently. 40. Family members feel guilty if they want to spend time away from the family. 41. Once a decision is made, it is very difficult to modify that decision. 42. Our family feels hectic and disorganized. 43. Family members are satisfied with how they communicate with each other. 44. Family members are very good listeners. 45. Family members express affection to each other. 46. Family members are able to ask each other for what they want. 47. Family members can calmly discuss problems with each other. 48. Family members discuss their ideas and beliefs with each other. 49. When family members ask questions of each other, they get honest answers. 50. Family members try to understand each other s feelings 51. When angry, family members seldom say negative things about each other. 52. Family members express their true feelings to each other Somewhat Generally Very Dissatisfied Satisfied Satisfied Very Dissatisfied How satisfied are you with: 53. The degree of closeness between family members. 54. Your family s ability to cope with stress. 55. Your family s ability to be flexible. 56. Your family s ability to share positive experiences. 57. The quality of communication between family members. 58. Your family s ability to resolve conflicts. 59. The amount of time you spend together as a family. 60. The way problems are discussed. 61. The fairness of criticism in your family. 62. Family members concern for each other. Thank you for Your Cooperation! Extremely Satisfied 9
10 FACES IV: Answer Sheet Subject ID (4 digit) Age: Sex: M: F: Date: Generally Undecided Generally Disagree Agree Strongly Disagree Strongly Agree A. B. C. D. E. F Generally Undecided Generally Disagree Agree Strongly Disagree Strongly Agree SUM = % Somewhat Generally Very Satisfied Dissatisfied Satisfied Very Dissatisfied Extremely Satisfied SUM = % Thank You for Your Cooperation! 10
11 Hand Scoring & Plotting FACES IV I. FACES IV Directions for Scoring & Plotting: (Items 1-42) 1. Add the values down each row of items on the answer sheet. Write the total in the space provided on the bottom of the answer sheet. 2. Transfer scores (A-F) from the answer sheet to the corresponding spaces below. Convert raw scores to percentile scores using Percentile Conversion Chart. Locate the raw score for each scale in the appropriate column, and enter the corresponding percentile score in the far left hand column in the space below. Raw Score Percentile Score A B C convert to % BALANCED COHESION convert to % BALANCED FLEXIBILITY convert to % DISENGAGED D convert to % ENMESHED E F convert to % RIGID convert to % CHAOTIC 3. Plot Percentile Scores for each scale onto the FACES IV Profile, connect the plot points, and determine which cluster the family profile most closely approximates. See example of Six Family Types plotted onto the FACES IV Profile (page 18). 4. Create Dimension Scores from Balanced Cohesion and Balanced Flexibility. Cohesion Dimension Score = Balanced cohesion + (Enmeshed Disengaged) 4 Flexibility Dimension Score = Balanced flexibility + (Chaotic Rigid) 4 5. Using the Cohesion and Flexibility Dimension Scores, plot them onto the Circumplex Model. II. III. Family Communication Scale: Directions for Scoring & Interpretation (Items 43-52) See Page 14 Family Satisfaction Scale: Directions for Scoring & Interpretation (Items 53-62) See Page 15 11
12 Balanced Scales: Percentile Scores & Levels A. COHESION Raw Score COHESION Percentile Score COHESION Level B. FLEXIBILITY Raw Score FLEXIBILITY Percentile Score FLEXIBILITY Level 7 10 Somewhat Connected 7 10 Somewhat Flexible 8 10 Somewhat Connected 8 10 Somewhat Flexible 9 10 Somewhat Connected 9 10 Somewhat Flexible Somewhat Connected Somewhat Flexible Somewhat Connected Somewhat Flexible Somewhat Connected Somewhat Flexible Somewhat Connected Somewhat Flexible Somewhat Connected Somewhat Flexible Somewhat Connected Somewhat Flexible Somewhat Connected Somewhat Flexible Somewhat Connected Somewhat Flexible Somewhat Connected Flexible Somewhat Connected Flexible Somewhat Connected Flexible Somewhat Connected Flexible Somewhat Connected Flexible Somewhat Connected Flexible Somewhat Connected Flexible Connected Flexible Connected Very Flexible Connected Very Flexible Connected Very Flexible Very Connected Very Flexible Very Connected Very Flexible Very Connected Very Flexible Very Connected Very Flexible Very Connected Very Flexible Very Connected Very Flexible Very Connected Very Flexible 12
13 Unbalanced Raw Scores Unbalanced Scales: Percentile Scores and Levels C. DISENGAGED Percentile Score D. ENMESHED Percentile Score E. RIGID Percentile Score F. CHAOTIC Percentile Score Unbalanced Levels Very Low Very Low Very Low Very Low Very Low Very Low Very Low Very Low Very Low Very Low Low Low Low Low Low Moderate Moderate Moderate Moderate High High High High Very High Very High Very High Very High Very High Very High 13
14 II. Family Communication Scale: Directions for Scoring & Interpretation Scoring Procedures (Items 43-52) 1. Add all items of the Family Communication scale. 2. The sum of these items is the total score. 3. The range of scores is from Family Communication: Interpretation of Scores Percentage and Levels Very High 86-99% High 61-85% Moderate 36-60% Low 21-35% Very Low 10-20% Family Communication Family members feel very positive about the quality and quantity of their family communication. Family members feel good about their family communication and have few concerns. Family members feel generally good about their family communication, but have some concerns. Family members have several concerns about the quality of their family communication. Family members have many concerns about the quality of their family communication. Family Communication Raw Percent Standard Alpha Mean* Deviation Reliability Test-Retest Family Communication *Mean and scoring levels based on 2,465 persons. 14
15 III. Family Satisfaction Scale: Directions for Scoring & Interpretation Scoring Procedures (Items 53-62) 1. Add all items of the Family Satisfaction scale. 2. The sum of these items is the total score. 3. The range of scores is from Family Satisfaction: Interpretation of Scores Percentage and Levels Very High 86-99% High 61-85% Moderate 36-60% Low 21-35% Very Low 10-20% Family Satisfaction Family members are very satisfied and really enjoy most aspects of their family. Family members are satisfied with most aspects of their family. Family members are somewhat satisfied and enjoy some aspects of their family. Family members are somewhat dissatisfied and have some concerns about their family. Family members are very dissatisfied and are concerned about their family. Family Satisfaction Raw Percent Standard Alpha Mean* Deviation Reliability Test-Retest Family Satisfaction *Mean and scoring levels based on 2,465 persons 15
16 Using Excel to Store & Score FACES IV Data The design of the Excel file matches the answer sheet from the Administration Manual. You can simply type in each person answers in each row. The data columns have been set up for 500 cases. If you need more cases, you can use the Excel pull down feature to extend the formulas down. A sample Excel file has been included for your review. I. Creating & Plotting Dimension Scores for Cohesion and Flexibility The dimension scores for Cohesion and Flexibility are used for plotting the one location of the family onto the updated graphic representation of the Circumplex Model of Couple and Family Systems. Use percentile score (%), not raw scores. In order to create a single score for cohesion and flexibility dimensions, the following formula was created. This dimension score is created by using the balanced score and adjusting it up or down the scale based on whether the difference in the two unbalanced scale is at the high or low of the dimension. Percentile scores are used for each scale, which are derived from the raw scores. There is a table in the Manual for converting raw scores into percentile scores. The formulas for the dimension scores are: Cohesion Dimension Score = Balanced Cohesion + (Enmeshed Disengaged) 4 Flexibility Dimension Score = Balanced Flexibility + (Chaotic Rigid) 4 So if the Enmeshed score is higher than Disengaged, then the Balanced cohesion score is adjusted upward. If the Disengaged score is higher than the Enmeshed, the Balanced cohesion score is adjusted downward. ** Note: in some cases, the Dimension scores can be a negative number or over 100. The Excel program will also sum the 10 items in the Family Communication and Family Satisfaction scales and provide a Total Raw Score for each scale. II. Creating Circumplex Ratio Scores (for research purposes) The Excel program will also create a Cohesion Ratio, Flexibility Ratio and Total Circumplex Ratio scores. This Balanced/Unbalanced ratio score is very useful since it indicates the level of functional versus dysfunctional behavior perceived in the family system. The ratio score is obtained by assessing the Balanced/Average Unbalanced score for each dimension. The lower the ratio score, the more unbalanced the system. Conversely, the higher the ratio score, the more balanced the system. The formulas are: Cohesion Ratio = Balanced Cohesion / (Disengaged + Enmeshment) 2 Flexibility Ratio = Balanced Flexibility / (Rigid + Chaotic) 2 Total Circumplex Ratio = Balanced Cohesion + Balanced Flexibility / (Disengaged + Enmeshment + Rigid + Chaotic) 2 Norms for Ratio Scores Cohesion Ratio Flexibility Ratio TOTAL RATIO Mean SD Minimum Maximum Range
17 100 FACES IV Profile: Six Family Types Percentile COHESION FLEXIBILITY DISENGAGED ENMESHED RIGID CHAOTIC BALANCED UNBALANCED (Higher Scores Healthier) (Higher Scores Problematic) Balanced n=99 Rigidly Cohesive n=103 Midrange n=72 Flexibly Unbalanced n=50 Chaotically Disengaged n=63 Unbalanced n=57 17
18 FACES IV Profile: Plotting Chart A. BALANCED COHESION B. BALANCED FLEXIBILITY C. DISENGAGED D. ENMESHED E. RIGID F. CHAOTIC FAMILY COMM. FAMILY SATISFACTION BALANCED UNBALANCED (Higher Scores Healthier) (Higher Scores Problematic) (Higher Scores Healthier) 18
19 19
HEA 676 Women s Health Research Seminar Brittney Anderson, Brian McDonald, Casey Buss, Laura Jones, Louise Vincent with Paige Hall Smith
 HEA 676 Women s Health Research Seminar Brittney Anderson, Brian McDonald, Casey Buss, Laura Jones, Louise Vincent with Paige Hall Smith Christine Oppong (1980) Developed for developing countries Identified
AACC/ACT FACES OF THE FUTURE SURVEY (FFS) SUMMARY REPORT 05/23/11 PAGE ii TABLE OF CONTENTS SECTION I: GENERAL BACKGROUND
 SUMMARY REPORT 05/23/11 PAGE ii TABLE OF CONTENTS SECTION I: GENERAL BACKGROUND") AACC/ACT FACES OF THE FUTURE SURVEY (FFS) SUMMARY REPORT 05/23/11 PAGE i GENERAL INFORMATION ABOUT THIS SUMMARY REPORT IN ADDITION TO THE INTRODUCTORY PAGES, THIS REPORT BELOW ARE EXPLANATIONS AND INFORMATION
AACC/ACT FACES OF THE FUTURE SURVEY (FFS) SUMMARY REPORT 05/23/11 PAGE i GENERAL INFORMATION ABOUT THIS SUMMARY REPORT IN ADDITION TO THE INTRODUCTORY PAGES, THIS REPORT BELOW ARE EXPLANATIONS AND INFORMATION
AACC/ACT FACES OF THE FUTURE SURVEY (FFS) SUMMARY REPORT 12/03/07 PAGE ii TABLE OF CONTENTS SECTION I: GENERAL BACKGROUND
 SUMMARY REPORT 12/03/07 PAGE ii TABLE OF CONTENTS SECTION I: GENERAL BACKGROUND") AACC/ACT FACES OF THE FUTURE SURVEY (FFS) SUMMARY REPORT 12/03/07 PAGE i GENERAL INFORMATION ABOUT THIS SUMMARY REPORT IN ADDITION TO THE INTRODUCTORY PAGES, THIS REPORT BELOW ARE EXPLANATIONS AND INFORMATION
AACC/ACT FACES OF THE FUTURE SURVEY (FFS) SUMMARY REPORT 12/03/07 PAGE i GENERAL INFORMATION ABOUT THIS SUMMARY REPORT IN ADDITION TO THE INTRODUCTORY PAGES, THIS REPORT BELOW ARE EXPLANATIONS AND INFORMATION
Dartmouth College 2008 Staff Survey
 Dartmouth College 2008 Staff Survey Data Analysis Solutions Prepared for: Dartmouth College Survey Overview Revised survey allowed for new questions and comparison to results from the 2006 Dartmouth College
WANTED: WOMEN IN STEM
 Additional support from WANTED: WOMEN IN STEM An Exploration of Influential Factors, Their Professional Journey & Ways to Foster Change Women in Technology International Survey, 2016 Gender Female 98.8%
Partnership Self-Assessment Tool (PSAT)
") Partnership Self-Assessment Tool (PSAT) Every two years, OKN uses the PSAT to gather information from committee members. Developed by The Center for the Advancement of Collaborative Strategies in Health,
Partnership Self-Assessment Tool (PSAT) Every two years, OKN uses the PSAT to gather information from committee members. Developed by The Center for the Advancement of Collaborative Strategies in Health,
INTRODUCTION. 2. What is your job type? (please check only one) Professional Supervisor/manager
 Professional Supervisor/manager") INTRODUCTION 1. Which of the following best describes your current job position? (please check only one) Application software developer Business analyst/consultant Data entry Database administrator/ Database
INTRODUCTION 1. Which of the following best describes your current job position? (please check only one) Application software developer Business analyst/consultant Data entry Database administrator/ Database
L e a d e r s h i p S t y l e S u r v e y
 L e a d e r s h i p S t y l e S u r v e y This questionnaire contains statements about leadership style beliefs. Next to each statement, circle the number that represents how strongly you feel about the
INTRODUCTION. 2. What is your job type? (please check only one) Professional Supervisor/manager
 Professional Supervisor/manager") INTRODUCTION 1. Which of the following best describes your current job position? (please check only one) Application software developer Business analyst/consultant Data entry Database administrator/ Database
INTRODUCTION 1. Which of the following best describes your current job position? (please check only one) Application software developer Business analyst/consultant Data entry Database administrator/ Database
Questions and Answers about SPILLOVER: NEGATIVE IMPACTS A Sloan Work and Family Research Network Fact Sheet
 Questions and Answers about SPILLOVER: NEGATIVE IMPACTS A Sloan Work and Family Research Network Fact Sheet Introduction The Sloan Work and Family Research Network has prepared Fact Sheets that provide
2008 Final Report for the Consumer Assessment of Healthcare Providers and Systems (CAHPS ) Survey
 Survey") 2351 Henry Clower Boulevard Suite D Snellville, GA 30078 Tel Fax 770-978-6267 www.themyersgroup.net July 22, Barbara Wilder QI Director MDWise 1099 North Meridian Street Suite 320 Indianapolis, IN 46204
2351 Henry Clower Boulevard Suite D Snellville, GA 30078 Tel Fax 770-978-6267 www.themyersgroup.net July 22, Barbara Wilder QI Director MDWise 1099 North Meridian Street Suite 320 Indianapolis, IN 46204
Employee Quality of Worklife Survey (EQWLS)
") Employee Quality of Worklife Survey (EQWLS) Preliminary Assessment Questionnaire Published by Karl Albrecht International 2013 Karl Albrecht. Reproduction permitted subject to rights limitations. This
Employee Quality of Worklife Survey (EQWLS) Preliminary Assessment Questionnaire Published by Karl Albrecht International 2013 Karl Albrecht. Reproduction permitted subject to rights limitations. This
2013 IUPUI Staff Survey Summary Report
 2013 IUPUI Staff Survey Summary Report Steven Graunke Office of Student Data, Analysis, and Evaluation February 2014 Executive Summary The IUPUI Staff Survey was designed to collect representative data
2007 Final Report for the Consumer Assessment of Healthcare Providers and Systems (CAHPS ) Survey
 Survey") 2351 Henry Clower Boulevard Suite D Snellville, GA 30078 Tel Fax 770-978-6267 www.themyersgroup.net July 26, Barbara Wilder VP, Quality Improvement 1099 North Meridian Street Suite 320 Indianapolis, IN
2351 Henry Clower Boulevard Suite D Snellville, GA 30078 Tel Fax 770-978-6267 www.themyersgroup.net July 26, Barbara Wilder VP, Quality Improvement 1099 North Meridian Street Suite 320 Indianapolis, IN
1 Survey of Cohort Mentors: Gender-Based Analyses August 2013
 1 Survey of Cohort Mentors: Gender-Based Analyses August 2013 Sample Seventeen mentors completed the survey from an overall population sample of 32 mentors. Thus, this survey had a response rate of 53.1%.
Pario Sample 360 Report
 Pario Sample 360 Report Pario 360 Feedback Personal Development Feedback Report Chris Case-Study Report Compiled 16th May 2011 Note: This report does not include the table that compares mean ratings of
APPENDIX 5 FINAL VMI INCLUDING SCORING GUIDE
 Developing the Volunteer Motivation Inventory 71 APPENDIX 5 FINAL VMI INCLUDING SCORING GUIDE Volunteer Motivation Inventory Instructions This section of the survey contains a list of statements that ask
EMPLOYEE SATISFACTION SURVEY VOICE OF EMPLOYEE - ANALYSIS & RESULTS. SpiceJet Employee Satisfaction Survey
 EMPLOYEE SATISFACTION SURVEY VOICE OF EMPLOYEE - ANALYSIS & RESULTS SpiceJet Employee Satisfaction Survey Executive Summary 1 The main objective of conducting Employee Satisfaction Survey was to set a
SampleCo Organization Survey Results
 SampleCo Organization Survey Results October 2009 Profile Report (This report was created on 5/30/2017) Table of Contents 1 Introduction: High Performance Organizations 2 Understanding the Data 3 Overall
Survey of Cohort Mentors August 2012
 1 Sample Survey of Cohort Mentors August 2012 Sixteen mentors completed the survey from an overall population sample of 33 mentors. Thus, this survey had a response rate of 48.5%. This sample was made
Job Satisfaction Quiz: How Satisfied Are You with Your Job? A Quintessential Careers Quiz
 Job Satisfaction Quiz: How Satisfied Are You with Your Job? A Quintessential Careers Quiz Does this job-seeker s scenario sound similar to yours? Jamie once loved his job and the accomplishments he achieved
PITTSBURGH REGIONAL DIVERSITY SURVEY RESULTS JOB SECTORS
 PITTSBURGH REGIONAL DIVERSITY SURVEY RESULTS JOB SECTORS Sample sizes: Job Sector Frequency Percent 286 11.2 902 35.4 Health Care & 340 13.4 Information 111 4.4 328 12.9 Professional, 298 11.7 159 6.2
Employee Satisfaction Summary. Prepared for: ABC Inc. By Insightlink Communications October 2005
 Employee Satisfaction Summary Prepared for: ABC Inc. By Insightlink Communications October 2005 Table of Contents Background and Methodology... 3 Note on the Results... 4 Executive Summary... 5 Corporate
Downloaded from Medico Research Chronicles Work life balance among the employees in information technology sector A sociological perspective
 ISSN No. 2394-3971 Original Research Article WORK LIFE BALANCE AMONG THE EMPLOYEES IN INFORMATION TECHNOLOGY SECTOR A SOCIOLOGICAL PERSPECTIVE Sarala Bhushan G 1, Dr. M. Trimurthi Rao 2 1. Research Scholar,
ACT STUDENT OPINION SURVEY (SOS 2-YR) SUMMARY REPORT 12/06/11 PAGE i IVY TECH COMMUNITY COLLEGE WARSAW CODE 1191 GENERAL INFORMATION ABOUT THIS SUMMAR
 SUMMARY REPORT 12/06/11 PAGE i IVY TECH COMMUNITY COLLEGE WARSAW CODE 1191 GENERAL INFORMATION ABOUT THIS SUMMAR") ACT STUDENT OPINION SURVEY (SOS 2-YR) SUMMARY REPORT 12/06/11 PAGE i GENERAL INFORMATION ABOUT THIS SUMMARY REPORT IN ADDITION TO THE INTRODUCTORY PAGES, THIS REPORT BELOW ARE EXPLANATIONS AND INFORMATION
ACT STUDENT OPINION SURVEY (SOS 2-YR) SUMMARY REPORT 12/06/11 PAGE i GENERAL INFORMATION ABOUT THIS SUMMARY REPORT IN ADDITION TO THE INTRODUCTORY PAGES, THIS REPORT BELOW ARE EXPLANATIONS AND INFORMATION
Board Effectiveness Survey Application. Hello,
 Hello, What follows is an item-by-item report of the responses from all those who completed the Board Performance Self-Assessment Questionnaire. You should also by now have obtained the Dashboard Report--
Job satisfaction of secondary school s teachers
 26 Original research International Journal of Science and Consciousness Access online at: www.ijsc.net July 2015, 1(1), 26-31 Job satisfaction of secondary school s teachers Dr. Vinitkumar M. Thakur Ahmadabad,
How do my values influence my career choice? Which career am I most passionate about and why?
 Choosing a Career 6 CAREERS The BIG Idea How do my values influence my career choice? Which career am I most passionate about and why? AGENDA Approx. 45 minutes I. Warm Up: Values (5 minutes) II. Comparing
A. OVERVIEW OF THE COMPETENCIES BY CLUSTER
 A. OVERVIEW OF THE COMPETENCIES BY CLUSTER Marketing Representative Competency Model I. Communication and Influence II. Task Management III. Self Management 1. Interpersonal Awareness: The ability to notice,
GLOBAL ASSESSMENT INVENTORY
 GLOBAL ASSESSMENT INVENTORY Development Guide A Brookfield Company GLOBAL ASSESSMENT INVENTORY Development Guide This Report is Prepared for: GAI Sample Participant This Report is Prepared by BGRS Intercultural
Giving More Than Money.
 Giving More Than Money. 2015 Wells Fargo/BoardSource study of nonprofit board leadership. Wells Fargo Philanthropic Services endeavors to help nonprofit boards and board members gain the most from board
APPENDIX 1 THE SURVEY INSTRUMENT - QUESTIONNAIRE
 APPENDIX 1 THE SURVEY INSTRUMENT - QUESTIONNAIRE 84 Date : September 03, 2011 MBA Research Project Questionnaire Research Title : Does Flexible Working Arrangement as one of the Work Life Benefits Foster
Assess the technical competence level of our graduates in practice area Measure the extent of demonstration of transferable skills by our graduates
 10/16/2018 Employer Survey Employer Survey Thiagarajar College of Engineering(TCE) Thiagarajar College of Engineering(TCE), Madurai, an ISO 9001:2008 certified Institution affiliated to Anna University
THOMAS-KILMANN CONFLICT MODE QUESTIONNAIRE
 THOMAS-KILMANN CONFLICT MODE QUESTIONNAIRE Consider situations in which you find your wishes differing from those of another person. How do you usually respond to such situations? On the following pages
NZ Police 2007 Employee Engagement Survey (Organisational Health Audit) Results Presentation
 Results Presentation") NZ Police 2007 Employee Engagement Survey (Organisational Health Audit) Results Presentation Copyright 2008 Gallup, Inc. All rights reserved. 1 Purpose of today Understand the 2007 Employee Engagement
NZ Police 2007 Employee Engagement Survey (Organisational Health Audit) Results Presentation Copyright 2008 Gallup, Inc. All rights reserved. 1 Purpose of today Understand the 2007 Employee Engagement
Lesson 3 Workplace Job Skills (hard skills or job specific skills)
") Lesson 3 Workplace Job Skills (hard skills or job specific skills) In the prior Lessons, we ve discussed how to look or appear professional ( Workplace Presences or soft skills) and how to act as a professional
Lesson 3 Workplace Job Skills (hard skills or job specific skills) In the prior Lessons, we ve discussed how to look or appear professional ( Workplace Presences or soft skills) and how to act as a professional
EMPLOYEE ENGAGEMENT SURVEY
 EMPLOYEE ENGAGEMENT SURVEY ATC Project March 30, 2015 on behalf of TTC TABLE OF CONTENTS Introduction 3 Overall Engagement Score 12 Aspects of Employee Engagement 16 What Drives Engagement 20 Overall Organizational
Suffolk University/USA Today FINAL April 8-13, 2015
 Region: Northeast ---------------------------------------------------------- 206 20.60 South --------------------------------------------------------------- 335 33.50 Midwest ------------------------------------------------------------
Study Guide. Scoring Record. Chapter 12. Name. The Manager as Leader. Perfect score. Date. My score
 Chapter 12 Scoring Record The Manager as Leader Name Date Perfect score My score Port A 20 PartB 10 PartC Total Study Guide Part A Directions: Indicate your answer to each of the following questions by
Lean Leader Manual. How to Manage Operations in a Lean Environment
 Lean Leader Manual How to Manage Operations in a Lean Environment About the Author Dan Burgos is an experienced business professional. With over 10 years of hands-on experience leading, and coaching organizations
Career Values Scale Report John Smith
 Career Values Scale Report John Smith 1/29/07 Copyright 2002 by Psychometrics Publishing. All rights reserved in whole or part. Career Values Scale Report: John Smith Page 2 About this report This report
Teacher Questionnaire Mathematics
 Identification Label TRENDS IN INTERNATIONAL MATHEMATICS AND SCIENCE STUDY Teacher Questionnaire Mathematics IEA, 2014 Teacher Questionnaire Your
Career Values Map John Sample
 Career Values Map John Sample Wednesday, January 8, 2003 Copyright 2002 by Psychometrics Publishing. All rights reserved in whole or part. Career Values Map: John Sample Page 2 About this report This report
2016 EMPLOYEE SURVEY RESULTS AND ANALYSIS
 2016 EMPLOYEE SURVEY RESULTS AND ANALYSIS JULY 2016 Survey Administered by the Institutional Effectiveness Committee March-June 2016 Report Prepared by the Office of Institutional Advancement Data Support
When you are leading at a higher level, the development of people is of equal importance to performance. by Ken Blanchard
 Leading at a Higher Level When you are leading at a higher level, the development of people is of equal importance to performance. by Ken Blanchard For years, The Ken Blanchard Companies has defined leadership
Sex and the Single Worker: Who's Cynical about Work-Life Balance?
 Working Papers Sex and the Single Worker: Who s Cynical about Work-Life Balance John Kervin University of Toronto Mark Easton University of Toronto UT Sociology Working Paper No. 2016-03 September, 2016
What is an unregulated and potentially misleading label worth? The case of natural -labelled groceries. Appendix
 What is an unregulated and potentially misleading label worth? The case of natural -labelled groceries Appendix Appendix A: Experiment Instructions The training instructions and the Experiment Part 1 instructions
A STUDY ON THE STRESS MANAGEMENT AMONG EMPLOYEES OF MANJILAS GROUP OF COMPANIES
 P P P Assistant P P M.Phil International Journal of Scientific Engineering and Applied Science (IJSEAS) - Volume-1, Issue-8,November 2015 A STUDY ON THE STRESS MANAGEMENT AMONG EMPLOYEES OF MANJILAS GROUP
Preface: About This Study Guide Pre-Test: Test Your Knowledge I. Introduction: Constructive Disagreement vs. Destructive Conflict
 CONTENTS Preface: About This Study Guide 2 Pre-Test: Test Your Knowledge 3 I. Introduction: Constructive Disagreement vs. Destructive Conflict 4 II. Sources: Making Conflicts Worse 8 Don t gossip or dwell
Building an Effective Team
 Building an Effective Team BOLD, Berry Organizational and Leadership Development, LLC Cynthia Berry, Ph.D. 2 Horn Cove Lane Defiance, MO. 63341 Cynberry42@msn.com 636-798-3031 1 Building an Effective Team
University wide Report Delivering quality survey, research and analysis solutions
 University wide Report Delivering quality survey, research and analysis solutions Teesside University Staff Survey 2012 January 2013 Project number: 5927 Organisational Contact Information Address: Capita
getabstract compressed knowledge Motivation Management Overall Applicability Innovation Style
 Motivation Management Fueling Performance by Discovering What People Believe About Themselves and Their Organizations by Thad Green Davies-Black, 2000 268 pages Focus Leadership Strategy Sales & Marketing
Appendix A: Good To Go! Customer Experience Survey Report
 Appendix A: Good To Go! Customer Experience Survey Report Appendix A: Good To Go! Customer Experience Survey Report Good To Go! Customer Experience Survey Report Prepared for the Washington State Department
SUPRC Maine Statewide August 2018
 Region: North Regions ----------------------------------------------------- 82 16.40 South Coast ------------------------------------------------------ 225 45.00 Mid Coast ---------------------------------------------------------
Toolkit. The Core Characteristics of a Great Place to Work Supporting Framework and Tools. Author: Duncan Brodie
 Toolkit The Core Characteristics of a Great Place to Work Supporting Framework and Tools Author: Duncan Brodie 01 About this document This framework has been designed based on the results of the literature
Employee Retention & Engagement: Moving Beyond Convention to Results
 Employee Retention & Engagement: Moving Beyond Convention to Results Published on Alvarez & Marsal (https://www.alvarezandmarsal.com) Companies suffering from high employee turnover and disengagement resort
Identification Label. Student ID: <TIMSS National Research Center Name> <Address> Student Name: Questionnaire. <Grade 8>
 Identification Label Student ID: Student Name: Main Survey Student Questionnaire General Directions In this booklet, you will find questions about
Stages of Organisational Consciousness: Part II
 Stages of Organisational Consciousness: Part II Shaun McCarthy Managing Director and Chairman of Human Synergistics Australia March 2014 In our earlier paper, Stages of Organisational Consciousness: Part
Identification Label. Student ID: <TIMSS National Research Center Name> <Address> Student Name: Questionnaire. (Separate Science Subjects) <Grade 8>
 <Grade 8>") Identification Label Student ID: Student Name: Main Survey Student Questionnaire (Separate Science Subjects) General Directions In this booklet,
Identification Label Student ID: Student Name: Main Survey Student Questionnaire (Separate Science Subjects) General Directions In this booklet,
Teacher Questionnaire Mathematics
 Identification Label TRENDS IN INTERNATIONAL MATHEMATICS AND SCIENCE STUDY Teacher Questionnaire Mathematics IEA, 2014 Teacher Questionnaire Your
City of Clinton Employee Satisfaction Survey 2016
 Augustana College Augustana Digital Commons 2015-2016: Clinton, Iowa Sustainable Workshops Landscapes Initiative 2016 City of Clinton Employee Satisfaction Survey 2016 Melinda Mahon Augustana College,
2018 Employee Climate Survey
 2018 Employee Climate Survey 2018 Employee Climate Survey Summary Employees were invited to take the 2018 campus climate survey between Oct. 15 and Nov. 9, 2018. The survey consisted of 79 questions. Thirty-four
Survey of Cohort Mentors: Gender-Based Analyses August 2011
 Survey of Cohort Mentors: Gender-Based Analyses August 2011 1 Sample Nineteen mentors completed the survey from an overall population sample of 38 mentors. Thus, this survey has a response rate of 50.0%.
Chapter 3: Research Design and Methodology. This chapter firstly defines the scope of green personal care and cosmetic
 Chapter 3: Research Design and Methodology This chapter firstly defines the scope of green personal care and cosmetic products for this study. The research methodology including the sample and data collection
Student Questionnaire
 Identification Label TRENDS IN INTERNATIONAL MATHEMATICS AND SCIENCE STUDY Student Questionnaire IEA, 2014 Directions In this booklet, you will
88% of consumers prefer dealing with a company with strong customer service than one with the hottest, most innovative product offerings.
 A recent customer service survey conducted by Harris Interactive indicated: 88% of consumers prefer dealing with a company with strong customer service than one with the hottest, most innovative product
Defining Paternity Leave: Shifting Roles, New Responsibilities in the Family and the Workplace
 Boston College Center for Work & Family E X E C U T I V E B R I E F I N G S E R I E S Defining Paternity Leave: Shifting Roles, New Responsibilities in the Family and the Workplace This presentation is
2017 RESIDENTIAL SATISFACTION
 2017 RESIDENTIAL SATISFACTION 8/01/2017 Adams Electric Cooperative Survey Results Prepared by: ADAMS ELECTRIC COOPERATIVE EXECUTIVE SUMMARY Following are the top-line findings based on the results of a
College Student Inventory. Student 1 Student Report. Motivational Assessment Student Background Information. Specific Recommendations
 Student Report Female, Age 37, ID# DeVry University March 06, 2012 Instructions Student one, this is an interpretive report of your responses to the College Student Inventory. Its purpose is to help you
EMPLOYEE ENGAGEMENT SURVEY
 EMPLOYEE ENGAGEMENT SURVEY Customer Communications/Customer Development/Farecard Team March 31, 2015 on behalf of TTC TABLE OF CONTENTS Introduction 3 Overall Engagement Score 11 Aspects of Employee Engagement
ATTACHMENT #1 Value-of-Work Activity
 ATTACHMENT #1 Value-of-Work Activity Goals: 1. To assess personal work values 2. To gain insight into personal levels of satisfaction Process 1. Explain that a value is anything to which a person ascribes
Profile Comparison Top-Leader
 Limbic Personality GmbH Profile Comparison Top-Leader Peter Mustermann Presented by The Limbic Personality Profile Comparison for Top Leaders There are a lot of leaders in the market but only those with
Customer Experience & Satisfaction Lessons from the 2018 Rider Survey
 Customer Experience & Satisfaction Lessons from the 2018 Rider Survey Customer Services & Marketing Strategic Initiatives Eric Lind Manager, Research & Analytics Understanding & Improving the Metro Transit
S E L E C T D E V E L O P L E A D H O G A N L E A D V A L U E S CORE VALUES AND MOTIVATORS FOR LEADERSHIP ROLES. Report for: John Doe ID: HA154779
 S E L E C T D E V E L O P L E A D H O G A N L E A D V A L U E S CORE VALUES AND MOTIVATORS FOR LEADERSHIP ROLES Report for: John Doe ID: HA154779 Date: November, 09 2 0 0 9 H o g a n A s s e s s m e n
ORGANIZATIONAL DESIGNS AND CHANGES
 ORGANIZATIONAL DESIGNS AND CHANGES AND CULTURE SHIFTS SO WHAT DOES THAT MEAN, ANYWAY? Head Start has been in business 50 years and some of you work out of the same offices that were in place in 1965. That
Virginia General Election Voters
 FINAL VIRGINIA OCTOBER Region: NoVA -------------------------------------------------------------- 143 28.60 West ----------------------------------------------------------------- 36 7.20 Piedmont Valley
EMPLOYEE ENGAGEMENT SURVEY
 EMPLOYEE ENGAGEMENT SURVEY Plant Maintenance March 30, 2015 on behalf of TTC TABLE OF CONTENTS Introduction 3 Overall Engagement Score 13 Aspects of Employee Engagement 17 What Drives Engagement 21 Overall
A Study On Organizational Climate At Jbm Auto Systems Pvt Ltd, Chennai
 A Study On Organizational Climate At Jbm Auto Systems Pvt Ltd, Chennai M. Venkatesh, PG Scholar, P.S.R. Engineering College, Sivakasi. 1. S. Saranya Jegajothi, AP/MBA., P.S.R. Engineering College, Sivakasi.
Credit Union Board Self-Assessment: A Research Study
 Credit Union Board Self-Assessment: A Research Study By Berit M. Lakey, PhD and George Hofheimer, CAE Copyright 2004 by Credit Union Executives Society and BoardSource All rights reserved. Credit Union
Liberty Utilities New Hampshire Electric Customer Satisfaction Final Report. October 2014
 5021 Liberty Utilities New Hampshire Electric Customer Satisfaction Final Report October 2014 Contents 1. Objectives & Methodology 2. Key Findings & Recommendations 3. Detailed Findings 4. Appendix Respondent
BUREAU OF CONSUMER FINANCIAL PROTECTION DECEMBER BCFP Annual Employee Survey Results
 BUREAU OF CONSUMER FINANCIAL PROTECTION DECEMBER 2018 2018 BCFP Annual Employee Survey Results Introduction Interpretation of results More than 72 percent of the Bureau of Consumer Financial Protection
A Report on the Quality of Work Life Survey Conducted During April-May 2010
 A Report on the Quality of Work Life Survey Conducted During April-May 2010 Office of Institutional Research October 2010 1 Executive Summary The Quality of Work Life Survey was conducted in the April
Chapter 10: Servant Leadership
 Chapter 10: Servant Leadership Description Servant leadership is an approach focusing on leadership from the point of view of the leader and his or her behaviors Servant leadership emphasizes that leaders
An Empirical Study on the Effect of Work/Life Commitment to Work-Life Conflict
 Available online at www.sciencedirect.com Physics Procedia 24 (2012) 1343 1349 2012 International Conference on Applied Physics and Industrial Engineering An Empirical Study on the Effect of Work/Life
Assessing Your Agency s Ethical Culture
 PUBLIC SERVICE ETHICS International City/County Management Association Assessing Your Agency s Ethical Culture This survey has been designed to assist your agency in gauging its ethical climate. Instructions:
NATIONAL SURVEY A Survey of Likely Voters October 2, 2014
 NATIONAL SURVEY A Survey of Likely Voters October 2, 2014 Sample Size : 1,000 Gender Men 48% Women 52% 1. Starting out, are you registered to vote at your current address? Yes 100% 2. I know it s still
Salon Experience 2011 Survey Results
 Executive Summary: Salon Experience 2011 Survey Results Listening to the feedback of beauty salon clients is critical to maintain and to improve client retention rates. Salon owners must have a firm understanding
About the 2016 Employee Survey
 About the 2016 Employee Survey The first Cornell Employee Survey in 2011 was a response to a resolution from the Employee Assembly calling for a study to better understand staff engagement. This second
Employee Opinion Survey
 Employee Opinion Survey Canutillo Independent School District April 6, 2017 Catherine Rubiera Table of Contents Executive Summary... 2 Background... 2 Survey Administration and Respondents... 2 Major Findings...
Feedback Report. ESCI - University Edition. Sample Person Hay Group 11/21/06
 Feedback Report ESCI - University Edition Sample Person Hay Group 11/21/06 Introduction What Is Emotional and Social Intelligence? Emotional and Social Intelligence, commonly refered to as EI, is the capacity
SELF-STUDY GUIDE: CULTURAL COMPETENCE
 SELF-STUDY GUIDE: CULTURAL COMPETENCE Unit I: Culture and Cultural Competence 1) Culture: Culture represents the values, norms and traditions that affect how individuals of a particular group think, interact,
Suffolk University/USA TODAY FINAL DRAFT October 2018
 Region: Northeast ---------------------------------------------------------- 202 20.20 South --------------------------------------------------------------- 331 33.10 Midwest ------------------------------------------------------------
Engaging Customer-Facing Bank Employees to Create a Service Culture
 Engaging -Facing Bank Employees to Create a Service Culture By Rich Brose, Director, Research Consulting, Financial Services Research Group, Maritz Research Introduction Bank executives are striving to
ASSESSING JOB SATISFACTION LEVEL OF EMPLOYEES IN A TERTIARY CARE HOSPITAL -A TOOL FOR TALENT RETENTION
 494 ABSTRACT ASSESSING JOB SATISFACTION LEVEL OF EMPLOYEES IN A TERTIARY CARE HOSPITAL -A TOOL FOR TALENT RETENTION MS. SYEDA AMTUL YAFE* *Head & Associate Professor, Department of Hospital Management,
A Scale to Measure Managerial Leadership among Panchayat Development Officers (Pdos)
") Available online at www.ijpab.com Tamgale and Badiger Int. J. Pure App. Biosci. 5 (3): 98-102 (2017) ISSN: 2320 7051 DOI: http://dx.doi.org/10.18782/2320-7051.3015 ISSN: 2320 7051 Int. J. Pure App. Biosci.
Available online at www.ijpab.com Tamgale and Badiger Int. J. Pure App. Biosci. 5 (3): 98-102 (2017) ISSN: 2320 7051 DOI: http://dx.doi.org/10.18782/2320-7051.3015 ISSN: 2320 7051 Int. J. Pure App. Biosci.
Communication Audit of the Academic & Career Advising Center. Table of Contents
 Helping organizations reach new heights through effective communication Communication Audit of the Academic & Career Advising Center Table of Contents Mission Statement 4 Executive Summary 5 Introduction
Volunteerism for the Next Generation
 Valuing and Achieving Diversity in Volunteer Management The goal of achieving organizational diversity is more than a moral or legal issue; it makes good sense! Diversity strengthens and enhances the effectiveness
Driving Change: A National Study of Canadian Nonprofit Executive Leaders. Supplemental Analysis Report
 A National Study of Canadian Nonprofit Executive Leaders 1 Supplemental Analysis Report The HR Council takes action on nonprofit labour force issues. As a catalyst, the HR Council sparks awareness and
Johnson City ISD SEE: Survey of Employee Engagement 2015
 Johnson City ISD SEE: Survey of Employee Engagement 2015 INSTITUTE FOR ORGANIZATIONAL EXCELLENCE The University of Texas at Austin THANK YOU for your participation in the Survey of Employee Engagement