CHAPTER 5 DATA ANALYSIS
|
|
|
- Eric Griffith
- 6 years ago
- Views:
Transcription
1 142 CHAPTER 5 DATA ANALYSIS The first and foremost procedure in the data analysis stage was to verify the quality of collected data for finalizing the tools required for further analysis. 5.1 ANALYZING THE QUALITY OF DATA This section involves procedures adopted in verifying and cleaning of data for further analysis. This included steps such as Verification of missing values Identification of Outliers Analysis of Normality Analysis of validity and Reliability Verification of Missing Values The responses collected from 500 respondents using structured questionnaire was entered in SPSS 17 under different variable names. To identify missing variables a frequency test was done. Missing responses were noticed in 105 cases where respondents fail to mark their responses related to certain questions which were critical in analysis point of view and hence these cases were deleted. After deletion of missing responses, 395 usable responses were obtained.
2 Identification of Outliers Outliers are created due to various reasons such as data entry errors, sampling errors as well as biased responses from the respondents. Some cases of outliers are noticed and were treated in the following manner in this research. Statisticians have devised several ways to detect univariate outliers. Grubbs' test is particularly easy to follow. This method is based on Z, which is calculated as the difference between the outlier and the mean divided by the SD. If Z is large, the value is far from the others. Hair et al (1998) suggest that as common rule of thumb, z scores can range from ± 3 to ± 4 for samples of more than 80.In this research to determine outlier, an outlier calculator which performs Grubbs' test available at was used. Three outliers located by this procedure were eliminated. The multivariate assessment of outliers was conducted using the DfBeta Influence Statistics method using SPSS17. To estimate effect of outliers in the study, the following rules were used: where n = Sample Size i.e. 384(minimum required), and hence all cases where DfBeta > shall be considered as outlier. The above procedures detected 7 cases as outliers, which were eliminated. Outliers represent cases whose scores are substantially different from all others in a particular set of data. A univariate outlier has an extreme
3 144 score on a single variable, whereas a multivariate outlier has extreme scores on two or more variables (Kline, 2005). A common approach to the detection of multivariate outliers is the computation of the squared Mahalanobis distance (D2) for each case. This statistic measures the distance in standard deviation units between a set of scores for one case and the sample means for all variables (centroids). Typically, an outlying case will have a D2 value that stands distinctively apart from all the other D2 values. Therefore to countercheck for multivariate outliers, squared Mahalanobis distance (D2) was verified from the Amos output. A review of these values showed minimal evidence of serious multivariate outliers Analysis of Normality Many of the statistical methods require the assumption that the variables observed are normally distributed. With multivariate statistics, the assumption is that the combination of variables follows a multivariate normal distribution. Since there is no direct test for multivariate normality, we generally test each variable individually and assume that they are multivariate normal if they are individually normal, though this may not necessarily the case. In SEM model, estimation and testing are usually based on the validity of multivariate normality assumption, and lack of normality will adversely affect goodness-of-fit indices and standard errors (Baumgartner and Homburg 1996; Hulland et al 1996; Kassim 2001). To assess normality, skewness and kurtosis are commonly used by the statisticians. Skewness refers to the symmetry of a distribution whereas kurtosis relates to the peakedness of a distribution. A distribution is said to be normal when the values of skewness and kurtosis are equal to zero (Tabachnick and Fidell; 2001). However, there are few clear guidelines about how much non-normality is problematic.it is suggested that absolute values of
4 145 univariate skewness indices greater than 3.0 seem to describe extremely skewed data sets (Chou and Bentler 1995). Regarding kurtosis, there appears that kurtosis index greater than 10.0 may suggest a problem. Analysis for univariate normality done using Kolomogorov- Smirnov test with Lillefors significance correction revealed that none of the variables are normally distributed. However skewness was between -0.9 to 0.1 range showing most of the data negatively skewed. Non-normality of the data was anticipated as most of the respondents preferred to agree or strongly agree to the survey dimensions indicating bulk of the values (including the median) lie to the right of the mean. In this study, all the variables fall under the kurtosis value of 3, inferring kurtosis was not problematic in this research. Amos16.0 provides normality checks for data including skewness, kurtosis indexes and Mardia s coefficient which is a test of multivariate normality. Critical ratios provided by Amos output as attached to kurtosis represents Mardia s normalized estimate of multivariate kurtosis. Bentler (2005), has suggested that, in practice, values > 5.00 are indicative of data that are non-normally distributed. To correct for non-normality in the underlying database, use of Bollen-Stine bootstrap and associated p-value was considered in this study. For all constructs to moderate the effect of multivariate non-normality, the maximum likelihood (ML) estimation, which is relatively robust against departures from multivariate normality even in a small manner (Anderson and Gerbing 1988; Sweeney 2000; Tabachnick and Fidell 2001), was applied with Bollen-Stine bootstrap procedure. The boot strap sample of 1000 was adopted in this study Analysis of Validity and Reliability In undertaking a statistical analysis, unidimensionality should be always assessed first, prior to examining reliability and validity (Hair et al.
5 ). This step reduces the possibility of misspecifications (Gerbing and Anderson 1988), because the analysis of reliability and validity is based on the assumption of unidimensionality (Nunnally and Bernstein 1994). Validity determines whether the scale truly measures what it was intended to measure. Testing the reliability of survey data is the pre-requisite for data analysis and inference. Reliability analysis tests whether a scale consistently reflects the subset it measures (Churchill 1979; Nunnally and Bernstein 1994). By consistency it is firstly meant that a respondent should score questionnaire the same way at different times. Secondly, two respondents with the same attitude towards service quality should identically score the survey. According to Field, (2005), values between 0.7 and 0.8 of Cronbach s items make a difference and in extreme cases they can lead to a negative Cronbach's alpha (Field 2005). In this study reverse scored items were not included as it may lead to problems in reliability of the data if the respondents answer without proper understanding of the question. In this study both reflective and Formative measures were used. The approaches to test reliability of these constructs are different. The reliability of reflective constructs was ascertained using the above criterion. As formative constructs are composed of different aspects of a construct, their indicators are not necessary to correlate with each other. Diamantopoulos and Winklhofer (2001), stated that it is not clear that reliability is a concept that applies well to formative constructs. This statement was also supported by Diamantopoulos and Siguaw (2006) and Rossiter (2002) and hence concluded that no reliability test are mandatory for formative indicators. Reliability evaluation for formative constructs is in ascertaining the absence of multicollinearity (Diamantopoulos and
6 147 Siguaw 2006). Muticollinearity can be tested using Variance Inflation Factor (VIF). The guidelines applied in this regard were as follows: VIF should be less than 3.3 (Diamantopoulos and Siguaw 2006). If VIF is less than 10 explains the absence of Collinearity (Hair et al 1998). Various validity and reliability criteria adopted in this study were explained in Table 4.5 above. 5.2 ANALYSIS OF SERVICE QUALITY DIMENSIONS The next step in the analysis procedure was to explore the service quality construct and confirm the existence of various dimensions by which it was assumed to be formed. This was done in two stages Exploratory factor Analysis using Factor 7.0 developed at the Rovira I Virgili University, Spain Confirmatory factor Analysis using Amos Exploratory Factor Analysis The indicator variables related to Service quality construct were subjected to an exploratory factor analysis to identify the underlying factors and to test whether the factors extracted are similar to the dimensions proposed in the study. The analysis was conducted by Factor 7.0,which is a freeware program developed at the Rovira i Virgili University, Spain by Urbano Lorenzo-Seva and Pere J. Ferrando( 2005). An important feature of this program was that it generates goodness of fit of the data simultaneously. 28 scale items were used to measure service quality in the Banking context as
7 148 explained in the previous chapters. In order to identify the naturally occurring dimensions of service quality all 28 items were subjected to a factor analysis. This approach was recommended in the literature as a means of identifying actual, rather than perceived, factor groupings (Rosen and Surprenant, 1998). The role of factor analysis is to identify the components or factors that derive from a set of variables, i.e. to identify the subset of correlated variables that form a subset which is reasonably uncorrelated with other subsets (Hair et al 1998; Tabachnick and Fidell; 2001). An Exploratory Maximum Likelihood factor analysis with varimax rotation was performed as it incorporates common, specific and error variance and was appropriate when the objective was to identify the minimum number of factors associated with the maximum explanation of variance (Hair et al 1998). The items that load higher than 0.5 are retained while low loading items are dropped. In general, higher factor loading is considered better, and typically loadings below 0.30 are not interpreted. As general rule of thumb, loadings above 0.71 are excellent, 0.63 very good, 0.55 good, 0.45 fair, and 0.32 poor (Tabachnick and Fidell 2007). The Exploratory Maximum Likelihood factor analysis identified five components with an Eigen value greater than 1, which together explained over percent of the variance indicated a good fit and hence it was assumed that model represents the data. The Kaiser-Meyer-Olkin Measure of Sampling Adequacy was and the Bartlett Test of Sphericity was significant (p<0.001) with a Chi Square value of with 378 degrees of freedom which was considered to be very good for further analysis and provided support for the factorization (Table 5.1). The Goodness of fit statistics are shown in Table 5.2.


8 149 Table 5.1 Adequacy of the correlation Matrix Table 5.2 Goodness of fit statistics after EFA of service quality construct


9 150 Table 5.3 below provides the details of each factor along with items contributing it with component loadings for each item. The total number of items for service quality construct got reduced to 27 as one item could not load more than 0.45 in factor extraction. Therefore the item technically skilled staff was deleted. Table 5.3 Factor loadings of service quality construct

10 151 Explained Variance and reliability of rotated factors as obtained from the output of Factor 7.0 analysis (Table 5.4) shows adequate reliability for extracted factors. Table 5.4 Explained Variance and Reliability of Rotated Factors analysis conducted. The following conclusions were drawn from the exploratory factor There existed five underlying factors which represent the service quality construct in the banking context in Kerala. Each item was mainly related to only one factor except for cross loading shown by certain indicators which can be theoretically justified as correlations among reflective measures are expected and possibility of respondents conceive a different factor perception for certain indicators cannot be ruled out. Some of the Image related indicators showed considerable cross loadings with Human factor. Indicator variables such as Helpful to customers and punctual in service delivery showed higher loading to Human dimension which can be justified on content grounds as these indicators represent contribution from the employees also. Hence it was decided to include these indicators along with Human dimension for further analysis.
11 152 One indicator variable attached to products and services dimension namely less documentation for products and services was showing higher loading to Convenience factor and hence decided to include this indicator along with Convenience factor for further analysis. Two indictors modern systems for service and wide network of ATM for easy service were showing higher loadings to products and services dimension rather than System and hence decided to include them with products and services for further analysis. On indicator variable technically skilled staff showed loading less than 0.45 and hence excluded from further analysis. The next step was to conduct a confirmatory factor analysis for the service quality dimensions identified Confirmatory Factor Analysis-Service Quality Dimensions The primary objective of conducting CFA was to determine the ability of a predefined factor model to fit an observed set of data. It provides estimates for each parameter of the measurement model. The various parameters used for evaluation of the model are shown in Table 5.5. Table 5.5 Various Parameters to be considered for model evaluation Sl.NO 1 Factor loadings, 2 Factor Variances 3 Covariance 4 Indicator Error Variances 5 Error Covariances CFA is useful in Parameter
12 153 Testing the significance of a specific factor loading. Testing the relationship between two or more factor loadings. Testing whether a set of factors are correlated or uncorrelated. Assessing the convergent and discriminant validity of a set of measures. CFA has strong links to structural equation modeling and hence the procedures involved are as explained under heading 4.4.Prior to validating the full structural model with all latent variables, it was required to validate each of the measurement models as a preliminary step. The measurement model is the part of an SEM model that deals with the latent variables and their indicators. The measurement model was evaluated for validity like any other SEM model, using goodness of fit measures. The major data considerations to be addressed before conducting CFA are Table 5.6 Various Data Considerations Sl.No. Data Considerations 1 Absence of missing data 2 Absence of outliers 3 Adequacy of sample size 4 Existence univariate and multivariate normality The data were found free from missing values and outliers as explained in headings 5.1. Unfortunately, there is no easy way to determine the sample size needed for CFA. There are some very rough guidelines for sample sizes: less than 100 is considered small and may only be appropriate for very simple models; 100 to 200 is medium and may be an acceptable minimum sample size if the model is not too complex; and greater than 200 is
13 154 large, which is probably acceptable for most models (Kline, 2005). Analysis of normality was done in the univariate level and multivariate level as explained in the heading Maximum likelihood (ML) estimation method was used in all analysis using Amos.16. Maximum likelihood aims to find the parameter values that make the observed data most likely (or conversely maximize the likelihood of the parameters given the data) (Brown, 2006). It has several desirable statistical properties: it provides standard errors (SEs) for each parameter estimate, which are used to calculate p -values (levels of significance) and it provides confidence intervals, and its fitting function is used to calculate many goodness-of-fit indices Measurement Model for Image Dimension The seven indicator variable model of Image dimension was suggesting poor fitting model in the first estimate. The normed alpha, RMSEA and CFI were above the permissible level. On verification of modification indices two indicator variables img2 and img8 were showing cross loadings to many other variables and was found to be a major cause for poor fit and hence were removed. The resulting model was found to be good fitting model with recommended indices as illustrated in Figure 5.1. All the paths shown in the model are significant as critical ratios were above 1.96.
14 img img1 img3 img5 img i1 i3 i4 i5 img9 i7 CMIN/df-2.96,CFI-0.98,SRMR-0.027,RMSEA-0.07,PClose HoelterNat , Composite reliability-0.706,ave Figure 5.1 Measurement Model for "Image" dimension Measurement Model for Human Dimension The seven indicator variable model of Human dimension was suggesting poor fitting model in the first estimate. The normed alpha, RMSEA, and NFI were above the permissible level. On verification of modification indicators indicator variables img7 was showing cross loadings to many other variables and was found to be a major cause for poor fit and hence were removed. The resulting model was found to be much better but still needed modification except for low squared multiple correlation of indicator variable Human5 which is considered for removal in the second stage. The resulting model was found to be good fitting model with recommended indices as illustrated in Figure 5.2. All the paths shown in the model are significant as critical ratio were above 1.96.
15 Human img4 human1 human2 human h1 h3 h4 h5 human4 h6 CMIN/df-2.74,CFI-0.99,SRMR-0.019,RMSEA-0.07,PClose-0.12 HoelterNat , Composite reliability-0.83,ave Figure 5.2 Measurement Model for "Human" dimension Measurement Model for Convenience Dimension The initial five indicator variable model reported a poor level of fit as the RMSEA (0.134) was outside the recommended tolerances. To modify the model, the indicator variable convei1 was removed due to poor squared multiple correlation. The resulting model was found to be good fitting model with recommended indices as illustrated in Figure 5.3. All the paths shown in the model are significant as critical ratio were above Convenience convei2 convei3 convei h3 h4 h5 prd1 h6 CMIN/df-3.34,CFI-0.995,SRMR-0.015,RMSEA-0.079,PClose-0.2 HoelterNat , Composite reliability-0.835,ave Figure 5.3 Measurement Model for "Convenience" dimension
16 Measurement Model for Products and Services Dimension The four indicator variable model of products and services dimension was suggesting poor fitting model in the first estimate. The normed alpha and RMSEA were above the permissible level. An indicator variable prd2 was removed from further analysis due to poor loading to get a well fit model with all indices considered above the desired level and with significant paths as illustrated in Figure prd&services prd3 sys p2 p3 sys2 p4 CMIN/df-1.13,CFI-0.99,SRMR-0.013,RMSEA-0.017,PClose HoelterNat , Composite reliability-0.705,ave Figure 5.4 Measurement Model for "products & services" dimension Measurement Model for System Dimension The five indicator variable model related to system dimension was suggesting poor fitting model in the first estimate. The normed alpha, RMSEA and CFI were above the permissible level. As per modification indices, an error correlation was added between indicator variables sys6 and sys7 considering the theoretical grounds, as to correlate error terms there needs to be a strong theoretical justification behind such a move (Joreskog and Long 1993) to develop a well-fit and significant model as illustrated in Figure 5.5. These variables represent responses related to userfriendly website and up to date web site and hence theoretically there is a
17 158 chance for their error variables to have correlation. All the paths shown in the model are significant as critical ratio were above system sys3 sys4 sys5 sys6 sys s1 s2 s3 s4 s5.36 CMIN/df-3.74,CFI-0.99,SRMR-0.011,RMSEA-0.07,PClose-0.08 HoelterNat , Composite reliability-0.839,ave Figure 5.5 Measurement Model for "system" dimension Structural Model for Service Quality Construct Structural equation models with latent variables (SEM) are more often used to analyse relationships among variables. The relationships among latent variables were tested only after obtaining a statistically significant wellfitting model which represents the data. The statistical significance of relationships among Service quality and its extracted dimensions such as Image, Human, Convenience, products and Services and system were of interest to this study. The well-fit measurement models of service quality dimensions such as Image, Human, Convenience, products and Services and system are taken together to arrive at a fitting structural model for service quality. The model developed is illustrated in Figure 5.6.Two important considerations are used to test the statistical significance using Amos output.
18 159 The critical ratio (C.R.), which represents the parameter estimate divided by its standard error; as such, it operates as a z-statistic in testing that the estimate is statistically different from zero. Based on a probability level of.05, the critical ratios are to be > ±1.96 for statistical significance. Non-significant parameters, with the exception of error variances, can be considered unimportant to the model; in the interest of scientific parsimony they should be deleted from the model (Barbara.M.Byrne 2010).The standard residual co-variance should be less than 2.58 to conclude statistically significant co-variance between two variables (Barbara.M.Byrne 2010). Hence such observations can also be considered for exclusion in further analysis. The first model developed needed re-specification as the standard residual co-variance between some of the variables was above The model re-specification on the basis of modification indices was adopted to finalize a good-fitting model explaining the service quality construct. However a scientific theory based reasoning is essential in adopting suggestion offered by modification indices in an urge to find better fit for the structural model. The indicator variable image 4 attached to Human dimension was selected for removal at re-specification stage due to two reasons The squared multiple correlation<0.5 This item was showing cross loadings with many other variables and hence problematic.
19 160 The re-specified model is illustrated in Figure img x1.63 img x2 Img.74 img5.55 x3.63 img6.39 x4 img9.47 x img4 x6.81 human1.83 x7.91 Human.95 human2.90 x8.81 human3.66 x9 human4.52 x10.72 convei2.42 x convei3.62 x12 Convenience.75 convei4.56 x13 prd1.43 x14.65 prd3.72 x sys1.62 x16 Prd&services sys2.73 x17 sys x18.92 sys4.81 x19.90 System.82 sys5.67 x20.80 sys6.64 x21 sys7 x22.35 Fig 5-6 Confirmatory model for Service quality construct-1 CMIN/df-2.11,CFI-0.96,SRMR-0.043,RMSEA-0.054,PClose HoelterNat ,Re-specification needed as some of std.redidual covariences >2.58 Figure 5.6 Confirmatory model for Service quality construct-1
20 161 img img1 img3 img5 img x1 x2 x3 x4.77 img9.65 x Human Convenience Prd&services System human1.83 x7 human2.92 x8 human3.65 x9 human4.52 x10 convei2.42 x11 convei3.62 x12 convei4.56 x13 prd1.43 x14 prd3.72 x15 sys1.62 x16 sys2.73 x17 sys3.85 x18 sys4.81 x19 sys5.67 x20 sys6.64 x21 sys7 x22.35 Fig 5-7 Confirmatory model for Service quality construct-cmin/df-1.7, CFI-0.976,SRMR-0.037,RMSEA ,PClose HoelterNat , Figure 5.7 Confirmatory model for Service quality construct as follows. The stages in development of a confirmed model are summarized Stage-1: from the initial list of 28 indicator variables, 1 variable related to technically skilled staff was removed for poor loading at exploratory factor analysis.


21 162 Stage-2: Five variables were removed at the stage of development of measurement models for dimensions identified after exploratory factor analysis. Stage-3: One variable was removed in the re-specification stage of evaluating the confirmatory model for service quality. The details of dimensions with their indicators in perceived service quality scale developed for banking context are given in Table 5.7. The overall reliability of the scale was The model fit summary and estimates are provided in Appendix 2. Table 5.7 Variables after Confirmatory Factor Analysis
22 Validation of the Perceived Service Quality Scale To demonstrate the soundness of measurement scale developed, first of all, it was necessary to address the issue of Common methods variance (CMV). Common methods variance can be a major source of measurement error in data collection when variables are latent and measured using the same survey at one point of time. CMV may inflate the true correlations among latent constructs and threaten the validity of conclusions. Harman's singlefactor test is most widely known approach for assessing CMV in a singlemethod research design (Podsakoff and Organ 1986). In single-factor test, all of the items in the study are subjected to exploratory factor analysis (EFA). CMV is assumed to exist if a single factor emerges from unrotated factor solutions, or a first factor explains more than 50% the variance in the variables (Podsakoff and Organ 1986) The EFA conducted with all variables in the study yielded five distinct factors with an eigenvalue above 1. The first factor accounts for 22.5% of the variance at unrotated stage and all factors together account for 66.5% of the total variance. When the initial solution was rotated using a varimax rotation in principal component analysis the same factor accounts for less than 12% of the total variance and hence confirmed that CMV was not a major concern in this study. Convergent validity was established when the relationship between measurement items and the factor were significantly different from zero. Based on this criterion, critical ratios were used to evaluate the statistical significance. Parameters which have a critical ratio greater than 1.96 were considered significant based on the level of p=0.05 (Anderson and Gerbing 1988). In this study, all of the measurement items represented their factors


.In this study the factor loading ranged from 0.629 to 0.")


23 164 significantly, as the critical ratio of every item exceeded the 1.96 value; hence, all of the measurement items satisfied the convergent validity test (Table 5.8). Also, the standardized regression weights should be significantly linked to the latent construct and have at least loading estimate of 0.5 and ideally exceed 0.7 (Hair et al 2006).In this study the factor loading ranged from to and no loading was less than recommended 0.5. Table 5.8 Estimates and squared multiple correlation of all indicators The convergent validity assessment also included the measure of construct reliability and average variance extracted. According to Fornell and Larcker (1981), variance extracted refers the amount of variance that is captured by the construct in relation to the amount of variance due to

24 165 measurement error. Further, Fornell and Larcker (1981), suggested that variance extracted to be a more conservative measure than construct reliability. The other criteria used to assess convergent validity are: As a rule of thumb good reliability is suggested if Cronbach s alpha estimate is t higher than 0.7. Variance extracted (VE) for a construct should be larger than 0.5 indicate reliable factors (Hair et al 1995,Holmes-Smith 2001) As a rule of thumb composite reliability is considered high if squared multiple correlation R2 ( smc ) greater than 0.5, moderate if between 0.3 and 0.5 and poor if less than 0.3 (Holmes-Smith 2001),suggesting construct reliability Online CONSTRUCT VALIDITY Calculator version 2.0 available at is used for calculating construct reliability and variance extracted by each dimensions used for service quality (Table 5.9). Table 5.9 Composite Reliability and Variance Extracted by each constructs Discriminant validity was confirmed by examining correlations among the constructs. As a rule of thumb, a 0.85 correlation or higher indicates poor discriminant validity in structural equation modeling
 were calculated and compared with average variance extracted.")
25 166 (David 1998). None of the correlations among variables were above 0.85 (Table 5.10). The results suggested adequate discriminant validity of the measurement Table 5.10 Correlations among constructs Further, to confirm discriminant validity the squared inter construct correlation (SIC) were calculated and compared with average variance extracted. All variance extracted (AVE) estimates in the Table 5.9 were larger than the squared inter construct correlation estimates (SIC) provided in Table Therefore it was confirmed that the indicators have more in common with the construct they were associated with than they do with other constructs. Nomological validity was tested by examining whether the covariances between the constructs in the measurement model make sense. The construct covariances are used to assess this. All the covariances were positive and significant as seen in Table 5.11 confirming nomological validity. From the above observations, it was confirmed that the scale developed was having adequate psychometric soundness for measuring perceived service quality of banking services in Kerala, India
.")
; Comparing the goodness-of-fit indices between the constrained and unconstrained")
26 167 Table 5.11Covariances among constructs Multi-group Comparison. A multi-group CFA was conducted to identify potential developmental differences in factor structure. In a multigroup CFA, measurement scale was tested to check whether the items comprising a particular measuring instrument operate equivalently across different populations (e.g., gender, age, bank type etc). There are three primary steps in a multi-group CFA: Determining the factor structure of the measure across each group freely estimating the factor loadings (unconstrained model); Determining the factor structure of the measure across each group constraining the factor loadings to be equal (constrained model); Comparing the goodness-of-fit indices between the constrained and unconstrained models. Differences between groups were assessed by comparing the goodness- of-fit indices of the model with factor loadings constrained to be equal to the unconstrained base model. If significant differences are observed between the constrained and unconstrained model goodness-of-fit indices, this indicates that factor structure is not same. If no significant differences are


27 168 observed between the constrained and unconstrained model goodness-of-fit indices, this indicates factor structure is considered to be the same. A multi-group comparison was conducted to determine whether the scale has the same theoretical structure for each bank type. No significant differences between the constrained and unconstrained models were identified. The comparative indices are listed in Table 5.12 below. Table 5.12 Comparative goodness of fit for nested models All indices are showing similar values and hence it can be assumed that model fits to all type of population. Thus the construct validity of the measurement model for service quality is fully established. The objective of the study to understand the various dimensions and indicators that can form a valid scale to measure perceived service quality in the kerala context was thus achieved. 5.3 STRUCTURE OF PERCEIVED SERVICE QUALITY CONSTRUCT An important issue to be addressed in this study was whether Perceived service quality needs to be defined as a formative or a reflective construct. A reflective construct implies that the separate dimensions of PSQ,such as image, human, convenience, products and services and system are actually different manifestation of the PSQ construct and as such reflect
28 169 the content of PSQ, whereas a formative construct suggests that PSQ is defined as the outcome formed of its dimensions. For example, increases in any one of the dimensions say Human, if results in an increase in all the other dimensions of PSQ, then PSQ should be conceptualized as reflective. On the other hand, when an increase in any one of the dimensions increases the overall magnitude of PSQ, without necessarily affecting the rest of the dimensions, PSQ should be defined as formative. The researcher conceptualized PSQ as first-order reflective and second-order formative construct on theoretical grounds and content validity need to be established for this assumption. For statistical validity of both reflective and formative models of perceived service quality and to understand which model represents the data in a better manner two models as shown in Figures 5.8 and 5.9 are developed and tested for goodness of fit analysis. Identification of formative indicator constructs in Amos 16 required following procedures (Jarvis et al 2003; MacCallum and Browne 1993). (1) The scale of measurement for the latent construct was established by constraining a path from one of the construct s indicators to be equal to 1 or by constraining the residual error variance for the construct to be equal to 1 and (2) To resolve the indeterminacy associated with the construct level error term, a formative Construct should emits paths to at least two unrelated latent constructs with reflective indicators at least two theoretically appropriate reflective indicators, or one reflective indicator and one latent construct with reflective indicators
29 170 Hence it was assumed that formative construct of PSQ emit paths to five indicators used to measure satisfaction development. This move can be theoretically justified as PSQ was assumed to cause satisfaction development among customers. The same indicators were used in reflective PSQ model also. e2 satdevelop x e3 satdevelop e4 satdevelop PSQ e5 satdevelop e6 satdevelop Img Human Convenience Prd&services System img1.40 x1 img3.72 x2 img5.56 x3 img6.40 x4 img9.65 x5 human1.83 x7 human2.92 x8 human3.65 x9 human4.52 x10 convei2.42 x11 convei3.62 x12 convei4.56 x13 prd1.43x14 prd3.72 x15 sys1.62 x16 sys2.73 x17 sys3.84 x18 sys4.81 x19 sys5.67 x20 sys6.65 x21 sys7 x22.34 Fig 5-8 Confirmatory model for Formative Service quality construct CMIN/df-1.79,CFI-0.964,SRMR-0.043,RMSEA-0.045,PClose HoelterNat , Figure 5.8 Confirmatory model for Formative Service quality construct
30 Img System e Human.96 e6.80 satdevelop e7 satdevelop e e8 satdevelop3 x PSQ Convenience.74 e9 satdevelop e10 satdevelop5 e Prd&services e1 e img1.40 x1 img3.73 x2 img5.55 x3 img6.40 x4 img9.65 x5 human1.83 x7 human2.92 x8 human3.64 x9 human4.53 x10 convei2.41 x11 convei3.63 x12 convei4.55 x13 prd1.43x14 prd3.72 x15 sys1.62 x16 sys2.73 x17 sys3.84 x18 sys4.82 x19 sys5.67 x20 sys6.64 x21 sys7 x22.35 Fig 5-9 Confirmatory model for Reflective Service quality construct CMIN/df-3.95,CFI-0.858,SRMR-0.089,RMSEA-0.088,PClose HoelterNat , Figure 5.9 Confirmatory model for Reflective Service quality construct The model no 1 demonstrated in Figure 5.8 emerged superior to other model with regard to goodness of fit. The model 1 explained the relation among first order factors to second order PSQ construct in the formative manner. This finding was in tune with the initial conceptualization of perceived service quality construct as a multidimensional second order formative construct with five first order reflective constructs. Hence the


31 172 content validity was further established. The findings confirmed that the structure of perceived service quality in the Kerala construct is hierarchical one formed with five first order dimensions all measured in the reflective manner. Thus objective in this regard is satisfied. 5.4 ANALYSIS OF BANK PERFORMANCE BASED ON SERVICE QUALITY The previous sections have explained the steps in developing and confirming measurement scale for perceived service quality with regard to banking context. The next step was to analysis of bank s performance based on perceived service quality for each type of banks like private sector, public sector and new generation in the Kerala context. This study adopted perception alone method suggested by Cronin and Taylor (1992), in SERVPERF analysis for evaluating the performance of each type of banks considered for the study. The SERVPERF score is the cumulative score obtained for each bank on all attributes (items) included in the validated scale of perceived service quality. Table 5.13 gives the SERVPERF score for each type of banks. Table 5.13 SERVPERF details of each type of banks

32 173 On verification of the results, it was observed that service quality in the new generation banks are ahead compared to other types of banks followed by private sector banks and public sector banks. The retained indicators after confirmatory factor analysis were used to calculate SERVPERF scores for each type of banks. In image and human dimensions private sector banks dominated perceived service quality supremacy whereas in other three dimensions new generation banks are more accepted in the Kerala banking context. The public sector banks even though enjoy second position in system dimension was found last in overall service quality perceptions. A test of Homogeneity was performed to check whether the assumption of homogeneity is violated to make valid inferences. Levene s test for homogeneity was not significant (p>0.05) as shown in Table 5.14 and hence, it can be concluded that population variance of each group are approximately equal. In order to find out the significant difference in the perception towards various dimensions of perceived service quality among the customers of three groups of banks, one-way analysis of variance was administered. The resulted F statistics are illustrated in Table 5.15 which suggests that except products and services and system dimensions there exists no significant difference in perceptions of customers in perceived service quality at 0.05 levels. Table 5.14Test of Homogeneity of Variances


33 174 Table 5.15 F-tests for significance among service quality dimensions ** Significant at 0.05 level 5.5 MEASUREMENT MODEL FOR DESIRED EXPECTATION CONSTRUCT In this study apart from perceived service quality dimensions, reflective model was conceptualized for the construct Desired Expectation. Hence validation of this construct was also done using Amos The Nine indicator variable model for Desired Expectation dimension was suggesting poor fitting model in the first estimate. Two indicator variables namely helpful employees and Punctual were showing very poor values for squared multiple correlation and hence were removed for further analysis. The resulting model was showing a better fit but further improvement was required. As per modification indices, two error correlations were added between indicator variables easy transaction and
34 175 system consistency as well as speedy action and grievance redressal. These steps can be theoretically justified as the chance of responses in correlated manner to these questions was possible due to complimentary nature of these questions. All the paths shown in the model are significant as critical ratio were above 1.96 and the model is illustrated in Figure 5.10.In the further analysis desired expectation was considered as a reflective construct with seven indicator variables..43 desiex Knowledgeable employees Safety Privacy Easy transaction System consistency.57 e2 e3 e4 e6 e7.34 Speedy action.41 Grievance redressal e8 e9.26 CMIN/df-2.71,CFI-0.987,SRMR-0.026,RMSEA-0.067,PClose HoelterNat , Composite reliability-0.701, AVE Figure 5.10 Measurement Model for "Desired expectation" 5.6 HYPHOTHESIS TESTING RESEARCH MODEL ANALYSIS For the analysis of the thesis model, instead of covariance based structural equation modeling, a variance based or component based Partial least square (PLS) approach was adopted in this study. PLS-based SEM has several key advantages over covariance-based SEM, including the following:
35 176 it always yield a solution, even in complex models it does not require variables to meet parametric analysis criteria, such as multivariate normality and large sample sizes it enables the estimation of parameters in models with formative LVs as well as reflective and doesn t give rise to identification problems as the case in Amos Most relationships between variables describing natural and behavioral phenomena seem to be nonlinear, with U-curve and S-curve relationships being particularly common (NedKock 2009). WarpPLS1.0 introduced in 2009 identifies nonlinear (or warped, hence the name of the software) relationships among LVs and corrects the values of path coefficients accordingly. Hence in this study Warp PLS 2.0 (current version) was used for analysis of relationships among latent variables. The main features of Warp PLS 2.0 are It estimates P values for path coefficients automatically and hence significance can be easily established. It estimates several model fit indices for checking whether data is well represented by the model. It enables evaluation of measurement model as well as structural model simultaneously The software allows users to view scatter plots of each of the relationships among LVs together with the regression curves that best approximate those relationships.
36 177 It calculates variance inflation factor (VIF) coefficients for LV predictors associated with each LV criterion. It pre-process the data before SEM analysis and hence make it easy to correct problems with the data, such as identical column names, columns with zero variance, and missing values In this study two constructs namely perceived service quality and satisfaction were conceptualized as second order constructs. For analysis of second order constructs using WarpPLS2.0, it is required to calculate the LV scores at first by creating models with latent variables and indicators without linking. These LV scores are used to define the second order construct in the final model. The Path coefficients and associated p-values are obtained by running WarpPLS 2.0 with a bootstrapping procedure. Boot strapping method of re-sampling was adopted due to the reason it tends to generate more stable path coefficients with samples sizes more than 100 (Nevitt and Hancock 2001). Various analysis algorithms used by Warp PLS are Warp3 PLS Regression, Warp2 PLS Regression, PLS Regression, and Robust Path Analysis. In this study Warp3 PLS Regression algorithm was used for analysis. The estimated model with path co-efficients and corresponding p values are provided in Figure The detailed results of analysis are provided in Appendice-3. A pre condition for accepting the estimated model for further interpretation was that the model should fit with the data. Similarly the various validity and reliability criterion should be met. A model possessing required reliability and validity conclude that the levels of measurement errors in the data are relatively less and the results of analysis credibly tests the hypotheses proposed in the study.


37 178 Figure 5.11 Estimated Research Model in Table Latent variable coefficients of the variables in the model are shown Table 5.16 Latent Variable Coefficients of the variables in the model
 and the average r-squared (ARS) be")
38 Model Validation-Verifying the Model Fit To assess the model fit with the data, it was recommended that the p-values for both the average path coefficient (APC) and the average r-squared (ARS) be both lower than.05. In addition, it was recommended that the average variance inflation factor (AVIF) be lower than 5 (Ned Kock 2009). Table 5.17 below provides the model fit indices with p values of the estimated model. It was found that, all the three fit criteria were met and can reasonably assume that the model have acceptable predictive and explanatory quality as the data is well represented by the model. Table 5.17 Model fit indices and P values of the Research Model Validity of Reflective Constructs in the Model The following rules were adopted to check the validity of reflective constructs. The reflective constructs used in this model were Desired expectation and the first order dimensions of Perceived service quality construct Validation of Desired Expectation Construct The construct of Desired expectation was found reliable since the indicators like composite reliability co-efficient(0.927), Cronbach alpha(0.907) and the average variance extracted (AVE=0.646) obtained after the estimation of the model were above the threshold limits.
. Table 5.")
39 180 To check the Convergent validity loadings of each indicator of the construct and their p values were considered. All the loadings were above 0. 5 and were significant at p <0.05and thus established convergent validity. (Table 5.18). Table 5.18 Factor loadings and p values for Desired expectation construct The latent variable correlations in the model are considered for ascertaining the discriminant validity of both reflective and formative constructs. If the square root of the average variance extracted to be higher than any of the correlations involving that latent variable (the values on the diagonal latent variable correlation table of Warp PLS output should be higher than any of the values above or below them, in the same column).(table 5.19). Table 5.19 latent variable correlations of constructs

 establishes the reliability, convergent")


40 Validation of Various Dimensions of PSQ The tables below (Tables 5.20, 5.21, and 5.22) establishes the reliability, convergent validity and discriminant validity of the five dimensions of the perceived service quality construct as per guidelines mentioned in previous section. The results re-confirmed the findings from confirmatory factor analysis. Table 5.20 Reliability analysis of PSQ dimensions Table 5.21 Factor loadings and p values for PSQ dimensions


41 182 Table 5.22 Latent variable correlations among PSQ dimensions (All the correlations significant at p<0.001) Validity of Formative Constructs Validation of Customer Satisfaction Construct formative constructs The following conditions were verified to establish validity of Absence of Multi collinearity was verified by checking the Variance inflation factors (VIF) and found that they were less than recommended value of 3.3 (Table 5.23). Table 5.23 Indicator weights and VIFs of Satisfaction Construct
42 183 All the indicator weights were with P values lower than.05 and hence merit validity in formative latent variable measurement (Table 5.23). All square root of AVE shown in the diagonal of the latent correlation matrix are higher than the correlation involving that latent variable, establishing Discriminant validity (Table5.24). Table 5.24 Latent variable correlation of the Satisfaction Construct (All correlations are significant at p<0.001) Validity of other Formative Constructs Formative indicators were used in this study for measurement of all constructs except Desired Expectation and first order dimensions of Perceived Service Quality. All this measures were found valid as explained below Absence of Multi collinearity and indicator weights with P values lower than.05 confirm validity of other formative constructs (Table 5.25) The Discriminant validity was established as under heading In this model all the Average variance extracted(ave) which is measure of the amount of variance captured by a latent construct in relation to the variance due to random measurement error were above 0.5establishing discriminant validity of the model (Table 5.16).


43 184 Table 5.25 Indicator weights of formative constructs 5.7 ANALYSIS OF RELATIONSHIP BETWEEN SERVICE QUALITY DIMENSIONS TO CUSTOMER SATISFACTION AND BEHAVIORAL INTENTIONS To find out the service quality dimensions which have significant relationship to customer satisfaction a model was developed as illustrated in Figure 5.12 and was estimated using WarpPLS2.0. The model developed was valid model with regard to fit indices. The significant dimension to have direct impact on Customer satisfaction at p<0.01 was the System dimension and the Human dimension was found significant at p<0.05. With regard to influence of service quality dimensions to behavioral intentions of the customer, it was observed that none of the dimensions are significant at0.01 level but two dimensions namely Human and Products and Services influence positive behavioral intentions of the customer significantly at 0.05
 which can be considered as")


44 185 level (Figure 5.13) which can be considered as valid information for drawing conclusions on customer behavior in the banking context. Figure 5.12 Model for PSQ dimensions to Satisfaction Figure 5.13 Model for PSQ dimensions to Behavioral Intentions

45 SERVICE QUALITY AND CUSTOMER SATISFACTION DEMOGRAPHIC FACTORS The Hypothesis to examine the association between demographics, and service quality perceived and customer satisfaction was done by developing another model as illustrated in Figure 5.14 and estimating the model using Warp3 PLs algorithm with boot strapping procedure. On verification of model fit indices with p values of the estimated model, it was found that, all the three fit criteria are met and can reasonably assume that the model have good fit with the data. Figure 5.14 Model for demographic factors to PSQ and Satisfaction On verification of p values for the path co-efficients from each parameter to latent constructs PSQ and Satisfaction, it was found that, age of the respondents have significant relation with perceived service quality (p<0.05) at 0.05 level whereas none of the other demographic factors had
46 187 significant relation with perceived service quality or Customer satisfaction. Thus Hypothesis H8 was only partly supported. The p values for path co-efficients from bank type to PSQ and satisfaction were found to be significant at 0.01 level (p<0.01) whereas length of association with the bank was found to have significant relationship with PSQ and satisfaction at 0.05 level (p<0.05) establishing the support for hypothesis H DESCRIPTIVE STATISTICS OF RESPONDENTS below. The summary of demographic profile of the respondents was listed 75.3% of the respondents are male 21.6% of the respondents are customers of private banks,37.1% public sector banks and 41.3% new generation banks 19.2% of the respondents in the age group less than 20,36.1% in the age group 20-35,32.2% between and 12.5% above 50yrs 1.8% of the respondents were matriculates,35.3% graduates,31.4% post-graduates and 31.4 professionals 10.9%ofthe respondents having annual income less than 2 lakhs,31.4% between 2lakh and 4 lakh,24.9% between 4 lakh and 6 lakh and 32.7% above 6lakh 2.9% of the respondents were having length of association with their bank for less than 1yr, 11.4% between 1yr and 3 yr, 15.6% between 3yr and 5 yrs and 70.1% above 5 yrs.
47 ANALYSIS OF PATHS-TESTING OF HYPOTHESES The next step of data analysis involved examining the structural models in order to test various hypotheses proposed for the study. All the paths in the model except two were found significant at 0.01level.The hypotheses found insignificant were, H2a- desired expectation to service quality and H 6b-Service quality to negative BI. The abstract of hypothesis tested are provided in Table The third objective of the study to identify the linkages among various constructs used in the study was thus satisfied. Except two, all other hypotheses proposed were found significant. The insignificant relation between PSQ and desired expectation can be justified from the fact that on determining perceived service quality the factors which contribute are more critical rather than what are the desired expectations regarding quality parameters. Also the significant relation desired expectations bear with customer satisfaction underlines its importance in developing satisfaction. Similarly from the quality perceptions of the sample under study negative behavioral intentions were not expected exclusively due to perceived service quality alone and found customer satisfaction has a vital role in the development of both positive and negative behavioral intentions. All the paths from indicators to corresponding constructs were found significant in this study. The measurement variables to first order service quality latent constructs such as Image, Human, Convenience, Products services and system were found significant in the confirmatory factor analysis(tables 5.8 and 5.20 above).all the indicators irrespective of formative or reflective were found significant and thus confirmed content validity of the theory developed.


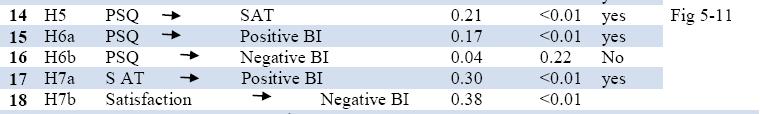
48 Table 5.26 Results of hypothesis testing 189
CHAPTER 5 RESULTS AND ANALYSIS
 CHAPTER 5 RESULTS AND ANALYSIS This chapter exhibits an extensive data analysis and the results of the statistical testing. Data analysis is done using factor analysis, regression analysis, reliability
CHAPTER 5 DATA ANALYSIS AND RESULTS
 5.1 INTRODUCTION CHAPTER 5 DATA ANALYSIS AND RESULTS The purpose of this chapter is to present and discuss the results of data analysis. The study was conducted on 518 information technology professionals
Estimation of multiple and interrelated dependence relationships
 STRUCTURE EQUATION MODELING BASIC ASSUMPTIONS AND CONCEPTS: A NOVICES GUIDE Sunil Kumar 1 and Dr. Gitanjali Upadhaya 2 Research Scholar, Department of HRM & OB, School of Business Management & Studies,
CHAPTER 4 RESEARCH METHODOLOGY
 91 CHAPTER 4 RESEARCH METHODOLOGY INTRODUCTION This chapter presents how the study had been designed and orchestrated and provides a clear and complete description of the specific steps that were taken
An Empirical Investigation of Consumer Experience on Online Purchase Intention Bing-sheng YAN 1,a, Li-hua LI 2,b and Ke XU 3,c,*
 2017 4th International Conference on Economics and Management (ICEM 2017) ISBN: 978-1-60595-467-7 An Empirical Investigation of Consumer Experience on Online Purchase Intention Bing-sheng YAN 1,a, Li-hua
Chapter 5 RESULTS AND DISCUSSION
 Chapter 5 RESULTS AND DISCUSSION 5.0 Introduction This chapter outlines the results of the data analysis and discussion from the questionnaire survey. The detailed results are described in the following
GREEN PRODUCTS PURCHASE BEHAVIOUR- AN IMPACT STUDY
 ORIGINAL RESEARCH PAPER Commerce GREEN PRODUCTS PURCHASE BEHAVIOUR- AN IMPACT STUDY KEY WORDS: Green Product, Green Awareness, Environment concern and Purchase Decision Sasikala.N Dr. R. Parameswaran*
Which is the best way to measure job performance: Self-perceptions or official supervisor evaluations?
 Which is the best way to measure job performance: Self-perceptions or official supervisor evaluations? Ned Kock Full reference: Kock, N. (2017). Which is the best way to measure job performance: Self-perceptions
Statistics & Analysis. Confirmatory Factor Analysis and Structural Equation Modeling of Noncognitive Assessments using PROC CALIS
 Confirmatory Factor Analysis and Structural Equation Modeling of Noncognitive Assessments using PROC CALIS Steven Holtzman, Educational Testing Service, Princeton, NJ Sailesh Vezzu, Educational Testing
Chapter 3. Basic Statistical Concepts: II. Data Preparation and Screening. Overview. Data preparation. Data screening. Score reliability and validity
 Chapter 3 Basic Statistical Concepts: II. Data Preparation and Screening To repeat what others have said, requires education; to challenge it, requires brains. Overview Mary Pettibone Poole Data preparation
Partial Least Squares Structural Equation Modeling PLS-SEM
 Partial Least Squares Structural Equation Modeling PLS-SEM New Edition Joe Hair Cleverdon Chair of Business Director, DBA Program Statistical Analysis Historical Perspectives Early 1900 s 1970 s = Basic
Chapter 5. Data Analysis, Results and Discussion
 Chapter 5 Data Analysis, Results and Discussion 5.1 Large-scale Instrument Assessment Methodology Data analysis was carried out in two stages. In the first stage the reliabilities and validities of the
Chapter Six- Selecting the Best Innovation Model by Using Multiple Regression
 Chapter Six- Selecting the Best Innovation Model by Using Multiple Regression 6.1 Introduction In the previous chapter, the detailed results of FA were presented and discussed. As a result, fourteen factors
ASSESSMENT APPROACH TO
 DECISION-MAKING COMPETENCES: ASSESSMENT APPROACH TO A NEW MODEL IV Doctoral Conference on Technology Assessment 26 June 2014 Maria João Maia Supervisors: Prof. António Brandão Moniz Prof. Michel Decker
Phd Program in Transportation. Transport Demand Modeling. Session 4
 Phd Program in Transportation Transport Demand Modeling João de Abreu e Silva Session 4 Factor Analysis Phd in Transportation / Transport Demand Modelling 1/38 Factor Analysis Definition and Purpose Exploratory
Constructing a B2C Repurchase Intention Model Based on Consumer Perceptive Factors
 Constructing a B2C Repurchase Intention Model Based on Consumer Perceptive Factors Ling-Lang Tang College of Management, Yuan Ze University, Taiwan Email: balltang@saturn.yzu.edu.tw Che-Han Hsu Department
CHAPTER 4 RESEARCH OBJECTIVES AND METHODOLOGY
 CHAPTER 4 RESEARCH OBJECTIVES AND METHODOLOGY 4.1 PROBLEM STATEMENT Various studies in the area of service quality management highlight the fact that as customer behavior is dynamic in nature, it is hard
MODELLING THE 2009 WORK ENVIRONMENT SURVEY RESULTS THE TECHNICAL REPORT APRIL 2010
 MODELLING THE 2009 WORK ENVIRONMENT SURVEY RESULTS THE TECHNICAL REPORT APRIL 200 CONTACT INFORMATION This paper was prepared by Taylor Saunders. If you have any questions about the information in this
USING EXPLORATORY FACTOR ANALYSIS IN INFORMATION SYSTEM (IS) RESEARCH
 RESEARCH") USING EXPLORATORY FACTOR ANALYSIS IN INFORMATION SYSTEM (IS) RESEARCH Maria Argyropoulou, Brunel Business School Brunel University UK Maria.Argyropoulou@brunel.ac.uk Dimitrios N.Koufopoulos Brunel Business
USING EXPLORATORY FACTOR ANALYSIS IN INFORMATION SYSTEM (IS) RESEARCH Maria Argyropoulou, Brunel Business School Brunel University UK Maria.Argyropoulou@brunel.ac.uk Dimitrios N.Koufopoulos Brunel Business
Assessing the Fitness of a Measurement Model Using Confirmatory Factor Analysis (CFA)
") International Journal of Innovation and Applied Studies ISSN 2028-9324 Vol. 17 No. 1 Jul. 2016, pp. 159-168 2016 Innovative Space of Scientific Research Journals http://www.ijias.issr-journals.org/ Assessing
International Journal of Innovation and Applied Studies ISSN 2028-9324 Vol. 17 No. 1 Jul. 2016, pp. 159-168 2016 Innovative Space of Scientific Research Journals http://www.ijias.issr-journals.org/ Assessing
How to Get More Value from Your Survey Data
 Technical report How to Get More Value from Your Survey Data Discover four advanced analysis techniques that make survey research more effective Table of contents Introduction..............................................................3
SCALE DEVELOPMENT AND VALIDATION FOR MEASURING CORPORATE BRAND ASSOCIATIONS
 CHAPTER 6 SCALE DEVELOPMENT AND VALIDATION FOR MEASURING CORPORATE BRAND ASSOCIATIONS Despite the importance of corporate branding, research on corporate branding has largely ignored the dimensional structure
CHAPTER 5 DATA ANALYSIS AND DISCUSSION
 CHAPTER 5 DATA ANALYSIS AND DISCUSSION 54 5. Data Analysis and Discussion This chapter is organized as follows: Section 5.1 provides the descriptive statistics of the respondents. Sections 5.1 and 5.2
Chapter Five- Driving Innovation Factors by Using Factor Analysis
 Chapter Five- Driving Innovation Factors by Using Factor Analysis 5.1 Introduction In the previous chapter, the results of preliminary stages of analysis including normality, reliability, and demographic
This chapter will present the research result based on the analysis performed on the
 CHAPTER 4 : RESEARCH RESULT 4.0 INTRODUCTION This chapter will present the research result based on the analysis performed on the data. Some demographic information is presented, following a data cleaning
Diffusion of Smart Grid in South Korea: The Relationship between Consumers Awareness and Intention to Use
 Int'l Conf. e-learning, e-bus., EIS, and e-gov. EEE'17 37 Diffusion of Smart Grid in South Korea: The Relationship between Consumers Awareness and Intention to Use Jaehun Joo 1 and M. Minsuk Shin 2 1 Professor,
A Study on New Customer Satisfaction Index Model of Smart Grid
 2016 International Conference on Material Science and Civil Engineering (MSCE 2016) ISBN: 978-1-60595-378-6 A Study on New Customer Satisfaction Index Model of Smart Grid *Ze-san LIU 1, Zhuo YU 2 and Ai-qiang
Reliability and Validity Testing of Research Instruments
 Reliability and Validity Testing of Research Instruments Mr. Sajijul Islam Research Scholar, Vidyasagar University Abstract: The aims of this paper are to determine the validity and reliability of research
Validation of the Conceptual Model for Mentoring in B-schools. Contents
 Contents 7.1 Structural equation model 7.2 Execution of the research model by visual PLS 7.3 Proposed model 7.4 Operational model 7.5 Validated structural equation model 7.6 AVE and reliability 7.7 Direct
CHAPTER 4 DATA ANALYSIS, PRESENTATION AND INTERPRETATION
 CHAPTER 4 DATA ANALYSIS, PRESENTATION AND INTERPRETATION 4.1 OVERVIEW The responses given by 385 faculty members and 30 directors working in NBA accredited institution business schools in Northern India
AIS Contribution in Navigation Operation- Using AIS User Satisfaction Model
 International Journal on Marine Navigation and Safety of Sea Transportation Volume 1 Number 3 September 2007 AIS Contribution in Navigation Operation- Using AIS User Satisfaction Model A. Harati-Mokhtari
CHAPTER 4 RESEARCH FINDINGS. This chapter outlines the results of the data analysis conducted. Research
 CHAPTER 4 RESEARCH FINDINGS This chapter outlines the results of the data analysis conducted. Research findings are organized into four parts. The first part provides a summary of respondents demographic
Adequacy of Model Fit in Confirmatory Factor Analysis and Structural Equation Models: It Depends on What Software You Use
 Adequacy of Model Fit in Confirmatory Factor Analysis and Structural Equation Models: It Depends on What Software You Use Susan R. Hutchinson University of Northern Colorado Antonio Olmos University of
PRESENTING SEM MODELS: JOURNAL AND CONFERENCE CONSIDERATIONS
 PRESENTING SEM MODELS: JOURNAL AND CONFERENCE CONSIDERATIONS John R Hamilton*, James Cook University, Cairns, QLD, Australia, 4870. Ph +(6)7404209 John.Hamilton@jcu.edu.au Singwhat Tee, James Cook University,
Service Quality and Customer Satisfaction: An Application of Internet Banking in Turkey
 Service Quality and Customer Satisfaction: An Application of Internet Banking in Turkey Merve Kılıç, Fatih University, Turkey Abstract: In the changing world the distribution of the services has also changed.
CHAPTER 4 METHOD. procedures. It also describes the development of the questionnaires, the selection of the
 CHAPTER 4 METHOD 4.1 Introduction This chapter discusses the research design, sample, and data collection procedures. It also describes the development of the questionnaires, the selection of the research
LINKING ORGANIZATIONAL COMMITMENT AND ENVIRONMENTAL PERFORMANCE IN MEXICO ABSTRACT INTRODUCTION
 LINKING ORGANIZATIONAL COMMITMENT AND ENVIRONMENTAL PERFORMANCE IN MEXICO Jacob A. Massoud, Pacific Lutheran University, School of Business, Morken Center, Tacoma, WA 98477, Ph: 253-535-8129, Fax: 253-535-8723,
ONLINE APPENDIX. This appendix contains additional results, which are not reported in detail in the paper due to space constraints.
 ONLINE APPENDIX FREYBURG, Tina (2011) Transgovernmental Networks as Catalysts for Democratic Change? EU Functional Cooperation with Arab Authoritarian Regimes and Socialization of Involved State Officials
Research Note. Community/Agency Trust: A Measurement Instrument
 Society and Natural Resources, 0:1 6 Copyright # 2013 Taylor & Francis Group, LLC ISSN: 0894-1920 print=1521-0723 online DOI: 10.1080/08941920.2012.742606 Research Note Community/Agency Trust: A Measurement
Chapter -7 STRUCTURAL EQUATION MODELLING
 Chapter -7 STRUCTURAL EQUATION MODELLING STRUCTURAL EQUATION MODELLING Chapter 7 7.1 Introduction There is an increasing trend in usage of structural equation modelling (SEM) in management research. Conceptual
Transformational and Transactional Leadership in the Indian Context
 ISSN 2278 0211 (Online) ISSN 2278 7631 (Print) Transformational and Transactional in the Indian Context Dr. Vikramaditya Ekkirala Associate Professor, Institute Of Management Technology, Nagpur, India
FACTOR ANALYSIS OF EFFECTS OF CAREER ON QUALITY OF WORK LIFE AMONG WOMEN EMPLOYEES WORKING IN PRIVATE SECTOR BANKS IN COIMBATORE DISTRICT
 FACTOR ANALYSIS OF EFFECTS OF CAREER ON QUALITY OF WORK LIFE AMONG WOMEN EMPLOYEES WORKING IN PRIVATE SECTOR BANKS IN COIMBATORE DISTRICT *Saravanan S. & Elamathi K. Department of Commerce with Information
An Examination of Mobile Application Use Intention through the Unified Theory of Acceptance and Use Technology Model
 An Examination of Mobile Application Use Intention through the Unified Theory of Acceptance and Use Technology Model Mu-Cheng Wu, Assistant Professor, Physical Education Office, National Chin-Yi University
Author please check for any updations
 The Relationship Between Service Quality and Customer Satisfaction: An Empirical Study of the Indian Banking Industry Sunayna Khurana* In today s intense competitive business world, the customer is educated
THE EFFECT OF PRODUCT PORTFOLIO ON PURCHASE INTENTION IN E-COMMERCE WEB SITES. Dr. Mustafa Emre Civelek & Dr. Adnan Veysel Ertemel
 THE EFFECT OF PRODUCT PORTFOLIO ON PURCHASE INTENTION IN E-COMMERCE WEB SITES Dr. & Dr. Adnan Veysel Ertemel OUTLINE PROBLEM IDETIFICATION CONCEPTUAL MODEL HYPOTHESES DIMENSIONS MEASURES AND SAMPLING RESEARCH
Comparative Assessment of Triveni Supermarket, Margin free Markets and Private..
 COMPARITIVE ASSESSMENT OF TRIVENI SUPERMARKET, MARGIN- FREE MARKETS AND PRIVATE SUPERMARKETS USING SELECTED RETAIL VARIABLES 7 C o n t e n t s 7.1 Measures 7.2 Validity and Reliability of Data 7.3 Retail
CSR organisational taxonomy and job characteristics on performance: SME case studies
 See discussions, stats, and author profiles for this publication at: https://www.researchgate.net/publication/316869842 CSR organisational taxonomy and job characteristics on performance: SME case studies
on customer lifetime value: An example using Star Cruises
 November 2010, Volume 9, No.11 (Serial No.89) Chinese Business Review, ISSN 1537-1506, USA The effect of experiential value, perceived quality and customer satisfaction on Ming-Cheng Lai, Feng-Sha Chou
A MULTIVARIATE ANALYSIS TECHNIQUE: STRUCTURAL EQUATION MODELING
 A Publication of Vol. Issue 4, September 202, ISSN 2278-4853 ABSTRACT A MULTIVARIATE ANALYSIS TECHNIQUE: STRUCTURAL EQUATION MODELING RINAL B. SHAH* *Assistant Professor, L.J. Institute of Management Studies,
Journal of Chemical and Pharmaceutical Research, 2015, 7(3): Research Article
: Research Article") Available online www.jocpr.com Journal of Chemical and Pharmaceutical Research, 2015, 7(3):550-554 Research Article ISSN : 0975-7384 CODEN(USA) : JCPRC5 Research on factors affecting brand image strategies
Available online www.jocpr.com Journal of Chemical and Pharmaceutical Research, 2015, 7(3):550-554 Research Article ISSN : 0975-7384 CODEN(USA) : JCPRC5 Research on factors affecting brand image strategies
Impact of ERP Implementation on Supply Chain Performance of Transport and Logistics Companies in Sri Lanka
 ISSN: 2513-2520 R4TLI Conference Proceedings 2017 Impact of ERP Implementation on Supply Chain Performance of Transport and Logistics Companies in Sri Lanka 1. Introduction Dilini Yapa University of Moratuwa,
Chapter 3 Research Methodology
 Chapter 3 Research Methodology 68 Chapter 3 Research Methodology Research Methodology-3.1 In this chapter the theoretical framework and methodology taken in the study has been elaborated. It covers the
Purchase Intent of an Electronic Product and Online Consumers Reviews: An Experiment on the Internet
 ISSN: 2278-3369 International Journal of Advances in Management and Economics Available online at: www.managementjournal.info CASE STUDY Purchase Intent of an Electronic Product and Online Consumers Reviews:
The Compositions, Antecedents and Consequences of Brand Loyalty. Chien-An Lin, National Kaohsiung University of Hospitality and Tourism, Taiwan
 The Compositions, Antecedents and Consequences of Brand Loyalty Chien-An Lin, National Kaohsiung University of Hospitality and Tourism, Taiwan Asian Conference on Psychology and Behavioral Sciences 2015
An Empirical Study on Customers Satisfaction of Third-Party Logistics Services (3PLS)
") International Conference on Education, Management and Computing Technology (ICEMCT 2015) An Empirical Study on Customers Satisfaction of Third-Party Logistics Services (3PLS) YU LIU International Business
International Conference on Education, Management and Computing Technology (ICEMCT 2015) An Empirical Study on Customers Satisfaction of Third-Party Logistics Services (3PLS) YU LIU International Business
Measuring Cross-Cultural Orientation: Development of a New Instrument
 Measuring Cross-Cultural Orientation: Development of a New Instrument Rakesh Mittal New Mexico State University In this study I design and present a new instrument, Cross-Cultural Orientation Inventory
CUSTOMER SATISFACTION WITH MOBILE OPERATORS SERVICES IN LITHUANIAN RURAL AREAS
 CUSTOMER SATISFACTION WITH MOBILE OPERATORS SERVICES IN LITHUANIAN RURAL AREAS Lina Pileliene 1, PhD; Viktorija Grigaliunaite 1 Vytautas Magnus University Abstract. In tough competitive conditions of Lithuanian
A Structural Equation Modeling approach to understand the Impact of Gartner s CRM Practices on Customer Retention
 DOI : 10.18843/ijms/v5i2(4)/06 DOI URL :http://dx.doi.org/10.18843/ijms/v5i2(4)/06 A Structural Equation Modeling approach to understand the Impact of Gartner s CRM Practices on Customer Retention Dr.
Assessing the drivers of online impulse buying
 Assessing the drivers of online impulse buying S-W Chang*, Marketing, Branding, & Tourism Department, Middlesex University, UK G. Loukides*, School of Computer Science and Informatics, Cardiff University,
Internet Shoppers Perceptions of the Fairness of Threshold Free Shipping Policies
 Internet Shoppers Perceptions of the Fairness of Threshold Free Shipping Policies Wen-Hsien Huang, Department of Marketing, National Chung Hsing University. Taiwan. E-mail: whh@nchu.edu.tw George C. Shen,
Glossary of Terms Ability Accommodation Adjusted validity/reliability coefficient Alternate forms Analysis of work Assessment Band Battery
 1 1 1 0 1 0 1 0 1 Glossary of Terms Ability A defined domain of cognitive, perceptual, psychomotor, or physical functioning. Accommodation A change in the content, format, and/or administration of a selection
*Javad Rahdarpour Department of Agricultural Management, Zabol Branch, Islamic Azad University, Zabol, Iran *Corresponding author
 Relationship between Organizational Intelligence, Organizational Learning, Intellectual Capital and Social Capital Using SEM (Case Study: Zabol Organization of Medical Sciences) *Javad Rahdarpour Department
Factor Retention Decisions in Exploratory Factor Analysis Results: A Study Type of Knowledge Management Process at Malaysian University Libraries
 Asian Social Science; Vol. 9, No. 15; 2013 ISSN 1911-2017 E-ISSN 1911-2025 Published by Canadian Center of Science and Education Factor Retention Decisions in Exploratory Factor Analysis Results: A Study
1. Measures are at the I/R level, independent observations, and distributions are normal and multivariate normal.
 1 Neuendorf Structural Equation Modeling Structural equation modeling is useful in situations when we have a complicated set of relationships among variables as specified by theory. Two main methods have
Structural equation model to investigate the factors influencing quality performance in Indian construction projects
 Sādhanā Vol. 40, Part 6, September 2015, pp. 1975 1987. c Indian Academy of Sciences Structural equation model to investigate the factors influencing quality performance in Indian construction projects
A study on the relationship of contact service employee s attitude and emotional intelligence to coping strategy and service performance
 , pp.75-79 http://dx.doi.org/10.14257/astl.2014.70.18 A study on the relationship of contact service employee s attitude and emotional intelligence to coping strategy and service performance Kim, Gye Soo
Chapter 3. Database and Research Methodology
 Chapter 3 Database and Research Methodology In research, the research plan needs to be cautiously designed to yield results that are as objective as realistic. It is the main part of a grant application
A SCALE TO MEASURE CONSUMERS ENGAGEMENT WITH SOCIAL MEDIA BRAND-RELATED CONTENT
 A SCALE TO MEASURE CONSUMERS ENGAGEMENT WITH SOCIAL MEDIA BRAND-RELATED CONTENT Bruno Schivinski, Gdańsk University of Technology, Poland George Christodoulides, Brikbeck University of London, UK Dariusz
Chapter 7. Measurement Models and Confirmatory Factor Analysis. Overview
 Chapter 7 Measurement Models and Confirmatory Factor Analysis Some things have to be believed to be seen. Overview Ralph Hodgson Specification of CFA models Identification of CFA models Naming and reification
Exploring Experiential Value in Online Mobile Gaming Adoption
 CYBERPSYCHOLOGY & BEHAVIOR Volume 11, Number 5, 2008 Mary Ann Liebert, Inc. DOI: 10.1089/cpb.2007.0202 Rapid Communication Exploring Experiential Value in Online Mobile Gaming Adoption Shintaro Okazaki,
Using Factor Analysis to Generate Clusters of Agile Practices
 Using Factor Analysis to Generate Clusters of Agile Practices (A Guide for Agile Process Improvement) Noura Abbas University of Southampton School of Electronics and Computer Science Southampton, UK, SO17
CHAPTER 5 ANALYSIS OF WORK LIFE BALANCE WITH RESPECT TO OTHER VARIABLES
 CHAPTER 5 ANALYSIS OF WORK LIFE BALANCE WITH RESPECT TO OTHER VARIABLES 201 CHAPTER- 5 ANALYSIS OF WORK LIFE BALANCE WITH RESPECT TO OTHER VARIABLES The second level of analysis was carried out to examine
A COMPREHENSIVE STRUCTURAL EQUATION MODELING FOR E IMPULSE BUYING
 A COMPREHENSIVE STRUCTURAL EQUATION MODELING FOR E IMPULSE BUYING Shalini Singh, DIT University Hemraj Verma, DIT University ABSTRACT Purpose: The main purpose of this paper is to establish a comprehensive
IMPACT OF SELF HELP GROUP IN ECONOMIC DEVELOPMENT OF RURAL WOMEN WITH REFERENCE TO DURG DISTRICT OF CHHATTISGARH
 IMPACT: International Journal of Research in Business Management (IMPACT: IJRBM) ISSN(E): 2321-886X; ISSN(P): 2347-4572 Vol. 3, Issue 9, Sep 2015, 81-90 Impact Journals IMPACT OF SELF HELP GROUP IN ECONOMIC
Intention to Buy Online: An Empirical Analysis ABSTRACT
 Intention to Buy Online: An Empirical Analysis ABSTRACT Behavioral Intention denotes the willingness of an individual to perform a certain action. Assessment of intention provides information that is helpful
Customers Retail Bank Selection Criteria in South Africa
 ISSN -1905 (Paper) ISSN -839 (Online) Vol.6, No.3, 014 Customers Retail Bank Selection Criteria in South Africa Allexander Muzenda Department of Research and Publications, Regenesys Business School; South
AFFECTIVE AND CONTINUANCE COMMITMENT IN CALL CENTRES: VALIDATION OF MEYER AND ALLEN QUESTIONNAIRE ABSTRACT
 Psychology and Psychiatry AFFECTIVE AND CONTINUANCE COMMITMENT IN CALL CENTRES: VALIDATION OF MEYER AND ALLEN QUESTIONNAIRE Assis. Prof. Dr. Leonor Pais 1 Dr. Cristina Souza de Castro 1 Assis. Prof. Dr.
CHAPTER 3 RESEARCH METHODOLOGY. This chapter provides an overview of the methodology used in this research. The use
 CHAPTER 3 RESEARCH METHODOLOGY 3.1 INTRODUCTION This chapter provides an overview of the methodology used in this research. The use of appropriate methodology forms the basis for a research so that scientifically
CHAPTER SIX DATA ANALYSIS AND INTERPRETATION
 CHAPTER SIX DATA ANALYSIS AND INTERPRETATION In this chapter various factors influencing preference of using Delhi Metro were checked and the impact of demographic characteristics (age, gender) of consumers
Amer Ahmad AlAnazi Universiti Utara Malaysia. Faridahwati Mohd. Shamsudin Universiti Utara Malaysia. Johanim Johari Universiti Utara Malaysia
 Linking Organisational Culture, Leadership Styles, Human Resource Management Practices and Organisational Performance: Data Screening and Preliminary Analysis Amer Ahmad AlAnazi Universiti Utara Malaysia
RFID Utilization through Supply Chain Management and Logistics Performance
 RFID Utilization through Supply Chain Management and Logistics Performance Sirichai Kingside 1, Natnarong Jaturat 2, and Chanongkorn Kuntonbutr 3 Faculty of Business Administration, Rajamangala University
Viswanath Venkatesh. Walton College of Business, University of Arkansas, Fayetteville, AR U.S.A. Jaime B.
 RESEARCH ARTICLE PERSON ORGANIZATION AND PERSON JOB FIT PERCEPTIONS OF NEW IT EMPLOYEES: WORK OUTCOMES AND GENDER DIFFERENCES Viswanath Venkatesh Walton College of Business, University of Arkansas, Fayetteville,
CHAPTER 4 EMPIRICAL ANALYSIS AND DISCUSSION
 79 CHAPTER 4 EMPIRICAL ANALYSIS AND DISCUSSION 4.1 SAMPLE SELECTION AND DESCRIPTIVE STATISTICS The study begins by identifying industrial sectors heavily reliant on intellectual capital. The data covers
demographic of respondent include gender, age group, position and level of education.
 CHAPTER 4 - RESEARCH RESULTS 4.0 Chapter Overview This chapter presents the results of the research and comprises few sections such as and data analysis technique, analysis of measures, testing of hypotheses,
MEASUREMENT OF DISCONFIRMATION IN ONLINE PURCHASING BEHAVIOR
 MEASUREMENT OF DISCONFIRMATION IN ONLINE PURCHASING BEHAVIOR Chinho Lin, Institute of Information Management of National Cheng Kung University, Taiwan R.O.C. Email: linn@mail.ncku.edu.tw Yu-Huei Wei, Department
REASONS BEHIND CONSUMERS SWITCHING BEHAVIOR TOWARDS MOBILE NETWORK OPERATORS: A STUDY CONDUCTED IN WESTERN PART OF RURAL WEST BENGAL
 REASONS BEHIND CONSUMERS SWITCHING BEHAVIOR TOWARDS MOBILE NETWORK OPERATORS: A STUDY CONDUCTED IN WESTERN PART OF RURAL WEST BENGAL Debarun Chakraborty, Assistant Professor, Department of Management &
PRELIMINARY DATA ANALYSIS
 PRELIMINARY DATA ANALYSIS CHAPTER 6 6.1 Introduction This chapter presents the results of the psychometric evaluation of the constructs in this study. First of all, the reliability and the validity of
Content Appendicises
 Abstract In this paper a communication survey within a company is evaluated using exploratory as well as confirmatory factor analysis. Data sets from two surveys, one performed in 2008 and one in 2009,
Sustainability of Commercial Banks: Role of Brand Image over. Brand Equity
 Sustainability of Commercial Banks: Role of Brand Image over Brand Equity Md. Abul Kalam Azad (Corresponding Author) Assistant Professor, International Islamic University Chittagongg Address: House-23,
A Comparison of Segmentation Based on Relevant Attributes and Segmentation Based on Determinant Attributes
 30-10-2015 A Comparison of Segmentation Based on Relevant Attributes and Segmentation Based on Determinant Attributes Kayleigh Meister WAGENINGEN UR A Comparison of Segmentation Based on Relevant Attributes
Customer Satisfaction on Services of Lakshmi Vilas Bank and Nationalized Banks in Tiruchengode:
 Parikalpana - KIIT Journal of Management (July-Dec - 2016) 1 Customer Satisfaction on Services of Lakshmi Vilas Bank and Nationalized Banks in Tiruchengode: A Comparative Study S. Ramesh Associate Professor
PROACTIVE BEHAVIOUR AS A MEDIATOR IN THE RELATIONSHIP BETWEEN QUALITY OF WORK LIFE AND CAREER SUCCESS
 International Journal of Business and Society, Vol. 18 S4, 2017, 701-709 PROACTIVE BEHAVIOUR AS A MEDIATOR IN THE RELATIONSHIP BETWEEN QUALITY OF WORK LIFE AND CAREER SUCCESS Nyuk-Ping Ling Universiti
An Investigation of the Impact Factors to Increase Citizens Engagement in E-participation on E- government in Saudi Arabia
 An Investigation of the Impact Factors to Increase Citizens Engagement in E-participation on E- government in Saudi Arabia A THESIS SUBMITTED IN FULFILMENT OF THE REQUIREMENTS FOR THE AWARD OF THE DEGREE
*Zahra Ghorbani Nasrollahabadi and Marhamat Hematpour Rasht Branch, Islamic Azad University, Rasht, Iran *Author for Correspondence
 STUDYING THE EFFECTS OF TRUST, QUALITY OF THE SERVICES AND THE VALUE OF THE SERVICES ON CUSTOMERS' SATISFACTIONAND LOYALTY (CASE STUDY: IRAN INSURANCE CO. OF RASHT CITY) *Zahra Ghorbani Nasrollahabadi
AN ANALYSIS OF FUNCTIONAL / PSYCHOLOGICAL BARRIERS AND QUALITY OF E-BANKING / INTERNET BANKING
 CHAPTER 5 AN ANALYSIS OF FUNCTIONAL / PSYCHOLOGICAL BARRIERS AND QUALITY OF E-BANKING / INTERNET BANKING 5.1 Introduction India is one of the leading countries in the world where e-banking / internet banking
Journal of Internet Banking and Commerce
 Journal of Internet Banking and Commerce An open access Internet journal (http://www.icommercecentral.com) Journal of Internet Banking and Commerce, May 2017, vol. 22, no. S8 Special Issue: Mobile banking:
An Empirical Analysis Of Factors Affecting The Adoption Of E-Payment System From Firm s Perspective In UAE
 An Empirical Analysis Of Factors Affecting The Adoption Of E-Payment System From Firm s Perspective In UAE Pooja Trivedi Lecturer Beenu Mago Lecturer Abstract Due to exponential use of e-commerce by consumers,
A Study on Acceptance of Selected FMCG Products among Women Managers in Tiruchirappalli District, Tamil Nadu
 A Study on Acceptance of Selected FMCG Products among Women Managers in Tiruchirappalli District, Tamil Nadu Dr.R. Kalpana Assistant Professor Department of Management Studies Thanthai Hans Roever College(Autonomous)
CHAPTER IV DATA ANALYSIS
 CHAPTER IV DATA ANALYSIS 4.1 Descriptive statistical analysis 4.1.1 The basic characteristics of the sample 145 effective questionnaires are recycled. The sample distribution of each is rational. The specific
3.1. Construct Validity of the Quick decision making model
 Testing Construct Validity Using Confirmatory Factor Analysis Khalidelhadi Alfagih 1, Sadun Alheety 2 1, 2 Al-Madinah International University Correspondence E-mail: kaa197323[at]yahoo.com Abstract: The