Annual Workforce Equality Monitoring Report
|
|
|
- Gwen Gaines
- 6 years ago
- Views:
Transcription

1 Annual Workforce Equality Monitoring Report
2
3 Contents Introduction 4 Purpose 5 Staff in post 6 Applicants for Employment 8 Applicants for Flexible Working 12 Maternity Leave 13 Paternity Leave 14 Career Breaks 15 Promotions 16 Grievances 18 Disciplinaries 20 Bullying and Harassment 23 Violence and Aggression 26 Leavers Analysis 28 Sickness Absence 31 Attendance at Training 32 Personal Development Plans and Band Breakdown 34 Recommendations 35
4 Introduction The Employment duty under the Equality Act 2010 obliges public bodies to report on a range of workforce monitoring areas for the protected characteristics of disability, ethnicity, gender, transgender, sexual orientation, religion & belief, age, marital status and pregnancy and maternity for staffin-post, applicants for jobs, promotion and training as well as the results of training, disciplinary and grievance procedures, performance appraisal and leavers. In addition to this the Vital Connection Department of Health document requires that the Trust also monitors bullying and harassment, violence and aggression, sickness absence, applicants for flexible working and special leave, staff returning from maternity leave at the same level as percentage of staff taking maternity leave, percentage of staff from professional groups working part-time and all of the workforce areas above reported by full-time/ part-time status, occupation code, and length of service.. The breadth of the workforce equality monitoring produced was agreed in the Single Equality and Human Rights scheme (SEHRS) Page 2
5 Purpose The purpose of this paper is to set out the results of employment monitoring between 1 April 2011 and 31 March 2012, to meet statutory obligations and publish this equality data on the Trust s external website and to understand the workforce profile and the equality of employment policy and practices in the hospital. This intelligence will enable action to be taken to remove any potential for discrimination, promote equality and foster good relations between people with different backgrounds. The equality monitoring data presented in this report is from ESR (electronic staff record). In 2008/09 a data cleanse project My details was undertook to increase confidence in existing data, reduce the number of blanks in equality data and collect equality monitoring information particularly in relation to sexual orientation and religion and belief that had not historically been collected in the hospital. Although this exercise has increased disclosure of equality data it should be noted that as at March 2011 there is still a level of undisclosed data for some protected characteristics. Equal opportunities monitoring information is captured on the standard application form on NHS jobs, this interface automatically transfers equality data to ESR for new appointments. Therefore by a process of natural attrition the % of complete equality data will increase on a year on year basis as staff leave the Trust and are replaced. The completion levels of disclosed data for each characteristic reported at end of March 2012 are detailed below: Gender 100% Age 100% Disability 60.27% (over 4% increase in disclosure since 10/11) Religion 55.3% (over 3% increase in disclosure since 10/11) Sexual Orientation 55/3% (over 3% increase in disclosure since 10/11) Ethnicity 95.41% Staff Group 100% PT/FT Status 100% Marital Status 100% Pregnancy & Maternity 100% Page 3
6 Staff are encouraged to disclose their protected characteristics but always have the option I do not wish to disclose. The current I do not wish to disclose figures are: Disability 39.73% Religion 44.64% Sexual Orientation 44.71% Ethnicity 4.59% To increase disclosure staff need to understand the rationale for equality monitoring and how it will be used to improve HR policy and practice. The 3 key protected characteristics that we need to increase disclosure for are disability, religion and sexual orientation. Non-disclosure (choosing to specify I do not wish to disclose) should be borne in mind when interpreting the data. Gathering reliable workforce diversity data remains an important issue in order to plan and analyse employment data effectively. Although diversity data collection has improved in , it still remains a challenge to achieve sufficient disclosure for all protected characteristics to allow analysis of workforce data by diversity to be meaningful. There are still some gaps that need to be closed in order to effectively meet statutory reporting duties and these are detailed where appropriate throughout the report. Page 4
7 Staff in Post Occupational Group The Trust employed 5581 staff on 31st March The composition of the workforce by occupational group is shown in Table 1. Nursing and midwifery represents the largest staff group, accounting for % of the workforce this is a slight decrease from 32% of the workforce in 10/11. Almost a quarter (24.4 %) of the workforce is employed in an Admin and Clerical capacity. Additional Clinical Services makes up % of the workforce and Medical and Dental staff equate to % of the workforce (an increase from 9% of the workforce in 10/11). Age The majority of the workforce employed are almost equally distributed in the age groups between 26-55, with between 12 & 14 % in each group; in total accounting for 80 % of the workforce. The age group 0-16 represents less than 0.2 % of the workforce employed. This is reflective of the national demography (it is anticipated that 41% of the population will be over 60 by 2033, office of national statistics) and the fact that the number of school leavers is reducing, and the number of staff employed in this group has decreased since last year. The age group is also under-represented at 4.9% of the workforce (a decrease from 6% last year). This could be influenced by the level of education/experience/ qualifications required for roles. A person specification screening tool was introduced in to the recruitment process in 2008 to identify and remove any discriminatory language from role descriptions and person specifications that may have previously inadvertently blocked applicants from applying for roles. The percentage of staff employed in the age group over 61 is also significantly less than in the rest of the workforce at 5.36 % however this has increased very slightly from 5.04% in and 5.08% in The trust has a Flexible Retirement policy that allows staff to manage their retirement, following the removal of the statutory default retirement age. The Trust is a DWP Age Positive employer and this is demonstrated in the age diversity of the workforce. Ethnicity Overall, the Trust employs % BME staff (for the purpose of this report BME is defined as any ethnic group other than White British/White Irish) and % White British/White Irish, the percentage of BME staff has decreased very slightly in the last year. Work remains to be done to encourage the outstanding 5 % of employees to disclose their ethnicity in future staff surveys. Page 5
8 The estimated BME population from the ONS statistics (any other ethnic group than White British/White Irish and White other local 2009 is 9% BME. Our BME staff using this definition is 11.23% this demonstrates that BME staff are represented in line with the demography of the hospital at a whole organisation level. Nationally the population is becoming more ethnically diverse and it is estimated that across England the proportion of white British has remained static between 2001 and 2009 where as the BME community has been growing by around 4.1% a year. It is expected that the workforce profile would shift in the same way. Religion and Belief This table depicts the breakdown of the workforce profile by religion / belief at a Trust level. Almost half (47%) of our staff have stated that they do not wish to disclose their religion/belief or have chosen not to provide any data this is high when the 2001 census shows that only 15% of the population do not have a religion. 44.3% are Christian, an increase from when it was 42%, 4.23% are Atheists. Buddhism, Hinduism, Islam, Judaism, Sikhism and other religions are all represented in small numbers in the workforce. Nationally 72% of the population are Christian. Sexual orientation Over half of the workforce declared that they are heterosexual % and % have stated that they do not wish to disclose their sexual orientation. Less than 1 % of the workforce 0.93 % (52 staff) have declared that they are Lesbian, gay or bisexual and 14.6% of the workforce has not provided any data on their sexual orientation, this is low in comparison to stonewall estimation of over 6% LGB population. The number that have not provided any information has decreased from 20% in to 18% in and 14.6% in so this is improving. The trust has joined the Stonewall Diversity Champions programme and by working with Stonewall and our Lesbian, Gay, Bisexual and Transgender Staff Network aims to increase staff confidence in disclosing sexual orientation for equality monitoring purposes and to increase the number of Lesbian, Gay and Bisexual staff that we employ. We actively promote international day against homophobia in the hospital and support and showcased the regional LGBT contribution to the NHS timeline in the last year and have an involvement in the annual Liverpool Pride Festival. Our staff network is involved in the E & D Sub-Committee and we place recruitment advertisements in the Stonewall starting out recruitment guide and enter the Stonewall Workplace Equality Index Gender Nationally the population of England is approximately 50 percent male and 50 percent female (ONS) and no change is projected by Three quarters of the workforce are female and 1 quarter male and this has remained constant from 09/10. Males are significantly under-represented, which reflects the national workforce profile in the NHS. This may be attributable to nursing and healthcare being a female dominated profession and historical gender occupational segregation. Page 6
9 Transgender No staff have declared that the gender that they identify with now is not the gender that they were born in. This data was collected via the data cleanse but is not currently collected on an ongoing basis via the national equal opportunities monitoring form on NHS Jobs. There is no clear consensus on how to define the trans population its is likely that transsexual people represent only a small proportion of those who might be considered trans with estimates of around 1550 and 5000 nationally (ONS). A Gender Reassignment policy was developed and implemented in the hospital in 2012 to support staff going through gender reassignment. Disability For 42.39% of our staff have not disclosed whether they have a disability. There are 125 staff that have declared that they are disabled, which is 6 more than in and equates to 2.24% of the workforce % of the workforce has declared that they do not consider themselves to be disabled. Data is collected and recorded on an equal opportunities monitoring form in relation to impairment type however it is not currently possible to report on this from ESR. We are exploring the ability to report on this in future reports. The Trust supports a Disabled staff network and is also a member of the Employers Forum on Disability and Mindful Employer. The Trust has the two ticks positive about disabled people accreditation, one of the benefits of which is the offer of a guarantee of interview for disabled applicants who meet minimum requirements for a role. NHS Employers report than 1 in 8 employees is disabled nationally. The Two Ticks accreditation was renewed in December Working with the staff network the Trust needs to promote understanding of the definition of disability with staff and to provide a supportive environment for disclosure and opportunities to disclose at different points in employment e.g. via the annual PDR process, at occupational health appointments, at sickness review meetings etc. Marital Status We collect marital status routinely on the standard recruitment application form. We have 100% complete data for marital status. The majority of our staff are married (45%) closely followed by 39% single. Only 16 staff (0.28%) of the workforce are in a civil partnership. The number of married couples decreased by 100,000 between 2001 and 2010 to 12.2 million in 2010 and this is consistent with an increase in cohabiting couples and the general decrease in marriages since the early 1970 s. The proportion of adults who are married is projected to decrease over the next 25 years from 49% to 42% and the proportion of people who have never married is projected to increase from 35 to 43% and it is expected that the workforce profile will shift accordingly. The civil partnership act was introduced in 2004, the number of staff in civil partnerships is expected to increase on a yearly basis. Page 7
10 Applicants for Employment In 10/11 there were applicants for employment with the trust which represents a significant increase from 8507 in 09/10 and is reflective of the current economic climate and increased competition for available jobs, the number of jobs appointed to was 381, a decrease from 420 last year. From all applicants just under a quarter (2470,22.22%) of applicants were short-listed and invited to interview and 381 appointed. Detailed tables breaking down applicants, short-listed and appointed staff by protected characteristics are detailed in the Recruitment Appendix. The Trust has recently transferred to Capita for HR Services, the Trust will work with Capita to extend recruitment reporting to include marital status and pregnancy/maternity from next year. Gender Females accounted for % of all applicants for employment with the trust (an increase from 59.47% of applicants in 10/11), 73.72% of people short listed and 76.38% of people appointed % of all of the female applicants were short-listed in comparison to % of all of the male applicants. From the short-listed applicants a slightly higher proportion of females were appointed than men % of males short-listed were appointed and 15.9% of the short-listed females were appointed. From the information above and monitoring information from 09/10 & 10/11 it would appear that females are more likely to be short-listed and appointed than male applicants. The HR Policy group are currently exploring this difference in terms of gender influence in completing the NHS application forms, short-listing and interview processes in the hospital. It may help to ensure that male staff are included and represented on interview panels. Disability Applicants declaring a disability represented 3.91 % (433) of all applications which is a slight increase on the number of disabled applicants for employment last year. For another year this appears to indicate that confidence in working for the hospital and disclosing a disability is increasing in the disabled community % of people short-listed were disabled but only 2.36% of people appointed. In line with the Disability Two Ticks Scheme practiced by the Trust, those people who met the essential criteria for a post and requested that they were considered under the guaranteed interview scheme were automatically offered an interview, however not all disabled applicants wish to have a guaranteed interview. Page 8
11 Of all the disabled applicants 24.71% were short-listed and 22.13% of the non-disabled applicants this appears to demonstrate that the guaranteed interview process is working in the hospital % of all shortlisted disabled applicants were appointed and 15.78% of non-disabled short-listed applicants were appointed. HR Services have guidance on managing disabled applicants in the recruitment process they also have access to the Employers Forum on Disability advice line, Disability Directions, for specialist advice and support if required. It may help to ensure that disabled staff are included and represented on interview panels in the hospital. From the information above it appears that although disabled people are slightly more likely to be interviewed (possibly due to the use of the guaranteed interview scheme) non-disabled shortlisted people are almost twice as likely to be appointed as short-listed disabled people. This issue is being investigated by the HR policy group to explore short-listing and interview processes in the hospital. It may help to ensure that disabled staff are included and represented on interview panels. We are unable to report on the number of disabled applicants at each stage who were considered on the guaranteed interview scheme, we have requested that the national NHS jobs website reporting facility is amended to enable us to extract this reporting detail for future years. Ethnicity All ethnic groups were represented in our applicant, short-listing and appointed breakdowns, of which the highest number of applicants were White British (64.52%) which represents a slight increase from 63% in 10/11. This is followed by 793% Asian or Asian British Indian applicants and 5.58 % Black or Black British applicants. The percentage of Asian Indian, & Black British applicants has decreased slightly in the last year. BME applicants accounted for 32.8% of all job applications (an increase from 194% in 09/10) or excluding white other 27.34%, this is a good representation in relation to the ONS estimated population of 9% BME in Liverpool (this excludes white other). BME applicants made up 16.4 % of people short-listed and 8.39 % of all applicants appointed. The number of BME applicants shortlisted and appointed has decreased from 10/11. White British and White Irish applicants made up 66.23% of all job applications, % of applicants shortlisted and % of applicants appointed. From the short-listed BME candidates 7.9% were appointed and % of the short listed White British/ White Irish short-listed applicants were appointed. From the data analysis it would appear to demonstrate again that non-bme people are more likely to be short-listed and appointed than BME applicants. The Commission for Racial Equality s code of practice advises that, in order to be able to draw reasonable conclusions from monitoring data, the ethnic coding should normally be a minimum of 90%, we have 99.03% of ethnicity data for recruitment applicants. Page 9
12 Further work is underway through the HR policy group to explore this in terms of ethnicity impact in completing the NHS application forms, short-listing and interview processes in the hospital. It may help to ensure that BME staff are included and represented on interview panels. Age All age groups were represented throughout the recruitment and selection process. The largest group of applicants were again from the age group (22.8%) followed by 21.6% in age group Almost 60% of applicants, 43% of short-listed and 63% of appointed staff were from the age group A small number of applicants 2.76% were from age group 16-20, this is a slight increase from last year. As the trust is under represented at this age this is unlikely to change unless the trust can increase the number of young applicants for employment. Less than 1% of applicants in total were received from age groups over 60. The age group 60+ is underrepresented in the Trust and the level of recruitment activity for these groups means that this is not likely to change in the near future without a concerted targeted recruitment programme to recruit older people. Religion and Belief % of applicants declared their religion and belief and 7.59% did not wish to disclose this is an increase in disclosure and provides a benchmark of an increase in general confidence in the public in disclosing religion and belief when applying for a new job. Within the trust there are still a number of staff who do not wish to disclose their religion which needs to be addressed through building trust and confidence in the use of this sensitive information. Applicants from all religions were included in the applicant breakdown. The majority 60% declared a religion of Christianity, % of short-listed applicants were Christian and 76.9% of appointments, this appears to be over representative. 10% of applicants were Islam, 3.48% of short-listed and 2.1% appointed this appears to be under representative of applicants were Atheist, 9.96% of short-listed and 9.19 % appointed this appears to be representative and 8.61% Atheist % of short-listed applicants were Christian 76.9% of appointments, this is higher than would be expected. 25% of the Christian applicants were short-listed and 17.45% of shortlisted Christians were appointed. 25.7% of Atheist applicants were short-listed and 14.2% of this short-listed were appointed. 7.71% of Islam applicants were short-listed and 9.3% of those short-listed were appointed. This appears to demonstrate that Christian applicants are more likely to be short-listed and appointed and will need to be investigated further and monitored over time. Page 10
13 Sexual Orientation Over 94.36% of applicants declared their Sexual Orientation; this gives us a benchmark of public confidence in disclosing sexual orientation when applying for a new job and has increased again from 10/11. Within the Trust there are still a high number of staff who do not wish to disclose sexual orientation. Through work with Stonewall and awareness raising of LGB issues via the staff network hopefully the Trust will be able to further increase our disclosure rates for this sensitive information. The majority of applicants (92.16%) declared their sexual orientation as heterosexual and this is slightly higher than in 10/11, where 91.29% of short-listed applicants were heterosexual. Less than 2 % of overall applicants (136 people) declared that they were LGB (a reduction from last year) this is low in consideration that Stonewall estimate that circa 6% of the population are LGB, however not all LGB people will disclose their sexual orientation. 2.15% of all short-listed applicants were LGB and 3.15% of all appointed staff. Of all the LGB applicants short-listed and 92.3 % were appointed. Of all heterosexual staff applicants 22.4% were short-listed, and 15.77% of short-listed were appointed. This appears to show that heterosexual applicants are more likely to be short-listed, but short-listed LGB applicants are significantly more likely to be appointed at interview. Positive action is taken to promote the trust as an LGB positive employer via recruitment advertisements, supporting Liverpool Pride and Stonewall Diversity Champion status. Page 11
14 Applicants for Flexible Working Eleven formal requests for Flexible Working in total were received in the last year. The small number of requests makes it difficult to make any meaningful interpretation of the data. The breakdown of Flexible working requested is attached at Appendix Flexible Working Requests. Ten of the requests received were from female staff and one from male staff, none of the applicants declared that they have a disability or were from a BME background, approximately half of the applicants were full-time and half part-time, Seven requests (63%) were from married staff and 4 (36%) from single staff. No requests for flexible working were received from staff that have declared that they are LGB. Applications came from staff employed in admin and clerical, nursing and midwifery and allied health professionals & additional professional technical other occupational groups were not represented. Two thirds of applicants (6) were in the age group 35-44, no applicants were aged over 49, 45% of requests were the age group 30-34, followed by 27% in age group % of applicants were from Christian staff and Six of the applicants had less than a years service (54.5 %) and 54.5 % (5) had between 1 and 5 years service. Two the request were from staff that had been on maternity in the last 12 month period (18%) It is expected that many more requests for flexible working were made and agreed in the hospital outside of the policy. Work is being done through policy group to further publicise the policy and train Managers to complete the associated documentation and ensuring that an equal opportunities monitoring form is completed at the time of the application to be able to monitor the application of this policy across all protected characteristics effectively in the hospital. Page 12
15 Maternity Leave In the last year 193 staff returned from Maternity leave, 96 % returned on the same pay scale after maternity leave. 8 staff (4.14 %) returned from maternity on a different pay scale. In each of these instances the staff had applied for and returned to a different role on a higher pay band. Page 13
16 Paternity Leave In the last year 40 members of staff took paternity leave this is double the amount taken last year. A detailed breakdown of applicants for Paternity Leave is detailed at Appendix Paternity. No applicants declared that they were disabled, all applicants were male, 37.5% of requests were from married staff, 2.5% divorced and 47.5% from single staff. 95% of requests were from full-time staff and 5 % part-time. 52.5% of requests were from staff with less than a years service and the other 47.5% were from staff with between 1 and 5 years service. No requests were received from staff with over 5 years service. Age 100% of the applicants for Paternity Leave were in the age bracket 645 this is an expected age range for parental responsibilities. Ethnicity 92.5% of paternity leave applications were from White British staff (an over representation compared the workforce) and 5% of applicants were BME (less than would be expected with an 11% BME workforce), and is a reduction from 35% from BME staff last year. 7.3 Religion or Belief. 40% of staff taking paternity leave did not wish to disclose their religion or belief this is an increase from last year, 47.5% were Christian and 10% atheist (slightly more than would be expected with the workforce employed in these categories. Other religions did not use the paternity leave policy at all and this may need to be explored further. Sexual Orientation The majority of staff declaring their sexual orientation that took Paternity leave were heterosexual (60%) same as last year. One applicant for paternity leave declared that they were bisexual (2.5%) and 60% heterosexual 37.5% of applicants did not disclose their sexual orientation. No individuals declaring themselves to be gay or lesbian accessed paternity leave. This may mean that we need to do some awareness raising of the availability of paternity leave for same sex couples in the Trust with staff and the staff network. Page 14
17 Career Breaks In the last year 23 staff applied for Career Breaks which is more than 5 times as many as last year when only 4 were taken and may be indicative of the current economic climate. This is a small number in relation to the workforce and makes it difficult to make any meaningful interpretation of the data. However the following is noted all staff were aged between 21 and 55, no applicants declared that they were disabled. 39% were Christian and no other religions were disclosed % of the applicants were female and 26.09% male. 4.35% of applicants were gay and 39% heterosexual 82.6% were white British and 17.4% were BME (this is a good representation of staff) applicants were White British,. 52% of applicants were married and 37% were single % were full-time staff and 34.78% were part-time. The highest number of career breaks (39%) were requested from staff with between 1 and 5 years service, followed by 30% with between 6 and 10 years and 26% with between 11 and 20 years, 4.35 % were for staff with over 30 years service. No requests were received from staff that have been on maternity in the last 12 months. Page 15
18 Promotions 152 staff were promoted in the last year, a promotion is defined as a member of staff moving up to a new pay band/pay scale. The Trust is unable to monitor applicants for promotion and shortlisted for promotion. Age The highest number of promotions % was again in the age band which is higher than expected with the percentage of staff employed in this age group. This seems to indicate that staff in the age group are much more likely to be promoted in the trust than older staff. This could be due to ambition or a number of reasons and needs to be explored further. Disability 1.97 % of promotions were from staff that have declared that they are disabled; this is similar to what would be expected with the known percentage of disabled staff employed of 2.24 % in the Trust. 60% of staff promoted declared that they do not have a disability (this is slightly higher than expected with 55% non-disabled staff) Religious Belief Over 40% of staff that have been promoted did not wish to disclose their religion, 53.29% of the promotions were from staff that have declared that they are Christian (this is an increase from last year and is more than would be expected with the percentage declared Christian workforce % of promotions were from Atheist staff and this is less than would be expected. Other declared religions were not evident in promotions in the hospital. Sexual Orientation 63% of staff promoted were heterosexual this is an increase from 55% last year and just slightly higher than the known percentage of heterosexuals employed in the Trust of 52%. 1.32% of promoted staff declared that they are lesbian, gay or bisexual and this is a good representation in terms of less than 1% declared LGB staff in the workforce. Bisexual staff were not represented in promotion in the last year. It is difficult to make comparisons to the workforce as a whole as we still have a large number of staff who do not wish to disclose their sexual orientation. Page 16
19 Gender 68.4 % of promotions were female staff, and 31.5 % were male this is a slight under representation of females and over representation of males in relation to the gender breakdown of the workforce profile. Other 58% of staff that were promoted were single, and 26.9% were married % of promotions were fulltime staff and only 7.24% were part-time, this is an over representation of full-time staff in promotions. The highest proportion of promotions was in staff with between 1 and 5 years service (40.13%), followed by staff with 6-10 years service (25 %), and 18% with years service. Staff with less than a years service, and over 20 years service make up less than 15% of promotions. Two of the staff promoted had been on maternity leave in the last 12 months. 57% of promotion were from single staff and 26.97% from married staff. Page 17
20 Grievances 28 staff raised formal grievances in the last year; this is again an increase from the previous year (0.5% of the overall workforce) and appears to be indicative of a climate in which employee issues are resolved at an informal stage before the formal process is invoked. Some work has been undertaken to ensure that staff are aware of the policy and are confident in the process. The small numbers make it difficult to draw conclusions but does allow some interpretation of the data. A detailed breakdown of grievances by protected characteristic is attached at Appendix Grievances Age Again no grievances were lodged by younger staff (aged under 26) or staff aged over 61 this is under representative of the workforce employed in this age group (circa 5% in each age group). The age group had the highest number of grievances (28.57%) and this is more than double what is expected what 14% of the workforce in this age range. The age group was also slightly over represented with % of grievances from this group. Further work is required to investigate the disparities as it is known that there is an over representation of younger leavers in the hospital this could demonstrate that younger staff do feel aggrieved but are making decisions to leave the employment of the Trust rather than resolve issues through Trust policy. Disability 39.29% of the staff that were involved in grievances disclosed their disability status this year and this makes it difficult to interpret the data. 35.7% of the grievances lodged were from non-disabled staff, 1 grievance (3.57 %) was from a disabled staff member and 60.7% from staff that have not declared their disability status. The percentage of disabled staff is slightly high in comparison to the workforce profile of 2.2% disabled however the percentages are unreliable due to the small number of grievances. Religion and Belief % of staff with grievances did not disclose their religion or belief this is disappointing in comparison to last year 47% and makes the date unreliable to interpret. Page 18
21 Sexual Orientation 67.8% of staff involved in grievances did not declare their sexual orientation, this is disappointing in comparison to last year 48% and makes the data unreliable to interpret. No staff that declared that they are gay, lesbian or bisexual lodged any grievances Improvement is required to increase confidence in disclosure of sexual orientation to be able to make any meaningful analysis and promote the Grievance policy to LGB staff via the Staff Network. Gender Over three quarters (85.7%) of grievances were from female staff and 14.29% from male staff. This is an increase in the percentage of females lodging grievances and slightly more than expected with a 75% female workforce and a decrease of half of the percentage of males lodging grievances from last year (less than would be expected with a quarter of the staff being male ). Ethnicity Over three quarters of grievances (85.71 %) lodged were from White British staff, this is an increase from last year 78,9% and is approximately what would be expected in terms of the workforce profile of % White British % of grievances were lodged by BME staff and this is only very slightly less than would be expected in terms of comparison to an % BME staff in the workforce. Other About half of the grievances were lodged from full-time staff (this is low in comparison to a workforce that is??% full-time) and % from part-time staff (high in comparison to p/t workforce of x%?). The highest number of grievances for a further year were lodged by nursing and midwifery staff (60.7%%) and this has increased significantly from 36.84% last year and is double what would be expected in comparison to % of the workforce being employed in nursing and midwifery, this figure needs to be explored further, followed by 17.86% in admin & clerical and 14.29% in additional clinical services, these are both slightly less than would be expected in terms of the workforce profile. No grievances were lodged by Allied Health professionals or medical and dental staff. No grievances were lodged by staff with less than a years service. Almost 93% of grievances were lodged by staff with between 1 and 30 years service, only 7% of grievances were lodged by staff with over 30 years service. Circa a 3rd of grievances (35.71%) were lodged by married and single staff and 14% from divorced staff. No grievances were raised by staff that had took maternity leave in the last 12 months. Page 19
22 Disciplinaries 38 staff were involved in disciplinaries in the last year; this is a reduction in the number of disciplinaries in the previous year (60) but is still a relatively small number (less than 1 % of the overall workforce) and appears to be indicative of a climate in which employee relations issues are resolved at an informal stage before the formal process is invoked. A detailed breakdown of Disciplinaries by protected characteristic is attached at Appendix Disciplinaries. Age 90 % of staff that were disciplined fell between the age ranges and this is high in comparison to 75% of the workforce in the age groups. The age group under 26 was not represented in disciplinary cases, this is less than expected with 5.1% of the workforce employed in this band % of disciplinaries were in the age group over 61, this is high in comparison to 5.36% of the workforce in this band. The age group had 21% of disciplinaries and the age group had 23% these are high in comparison to circa 12-14% of staff being employed in each of these age bands respectively. These differences should be monitored over time and investigated further. The representation of other age bands in disciplinaries is roughly representative of the workforce. Disability (4.74%) of staff involved in disciplinaries declared that they were not disabled, this is less than would be expected with a known non disabled workforce of % of the staff involved stated that they do not wish to disclose or have not declared their disability status and this has not changed much since last year. Two disciplinaries (5.26%) involved staff that have declared that they are disabled. The percentage of disciplinaries for disabled staff has reduced since last year but is still high in comparison to the known percentage of disabled staff in the overall workforce of 2.2 % of disabled staff. This needs to be monitored further and explored in the Trust to ensure that disabled staff are receiving appropriate support to be able to perform in their roles through the Supporting Staff who are Disabled policy. Page 20
23 Religion and Belief 47.37% of staff involved in disciplinaries chose not to disclose their religion or belief and this makes it difficult to make meaningful interpretation of the data for this characteristic. Of those that declared their religion and belief the highest percentage (50%) of cases were Christian (this is slightly higher than expected with 44.3% Christian employees in the workforce). 2.63% were Other. We need to increase disclosure of religion and belief to be able to monitor more effectively. Sexual Orientation 55.26% of staff involved in disciplinaries did not wish to disclose their sexual orientation which is disappointing as it is higher than the number that did not disclose last year. All of the staff involved in disciplinaries that disclosed their sexual orientation were heterosexual and this is relative to 52.1% of the workforce being heterosexual. No lesbian, gay or bisexual staff were involved in disciplinaries. There needs to be an increase in the disclosure of sexual orientation to be able to make any meaningful analysis of the data however currently the data shows slightly more heterosexual staff are involved in disciplinaries than are employed in the workforce, and less declared lesbian, gay and bisexual staff than employed overall in the workforce are involved in disciplinaries. This needs to be monitored and explored further. Gender Over two thirds (68.42%) of disciplinaries involved female staff (a reduction from 71.67% last year) and 31.5% involved male staff an increase from 28% last year. For a further year more males but less females than would be expected from the overall workforce profile of 75% females and 25 % males were involved in disciplinaries in the last year and the proportionately has not improved. This appears to show that males are very slightly more likely to be disciplined than females and needs to be explored further and monitored on an ongoing basis. Ethnicity National research published in 2010 The involvement of black and minority ethnic staff in disciplinary proceedings Centre for inclusion and Diversity, University of Bradford found that BME staff were almost twice as likely to be disciplined as white staff, the picture in the trust last year did not reflect the national findings. In the trust 15.79% of disciplinaries included BME staff (any other stated ethnicity other than White British/ White Irish) this has reduced year on year over the last couple of years and but is slightly more than would be expected in terms of the workforce profile % BME % of disciplinaries related to White British staff which is very slightly less than would be expected with a staff populations who are White British. This appears to demonstrate statistically that BME staff are more likely to be disciplined than other staff. Disciplinaries should be monitored on an ongoing basis and further work undertaken to investigate the statistical slight over representation of BME staff in disciplinaries in the hospital. Page 21
24 Other The disciplinaries were % full-time and 18.42% part-time staff. Staff employed in nursing and midwifery posts made up 47.7% of the disciplinaries this is higher than would be expected with only 32% of the workforce in this occupational group % of disciplinaries were in admin and clerical (less than expected with 24.4% of staff A & C) and 26.32% of disciplinaries were in additional clinical services (higher than expected with 15.75% of the workforce in this group. No disciplinaries were for Healthcare Scientists and Medical and Dental for the third year running. The highest number of disciplinaries were for staff with between 1 and 5 years service (36.84%), with staff with 6-10 and years having roughly 22% each; staff with less than a years service and with over 30 years service both made up 5.26 % of disciplinaries and those with between 20 and 30 years 7.89 %. One disciplinary related to a member of staff that has been on maternity leave in the last 12 months. Medical Disciplinaries There was only 2 disciplinaries for medical staff, this very small number makes it difficult to draw any conclusions from the data. However both were full-time staff, male, had between 6 and 20 years service, were over 50 years old, neither had declared that they were disabled, 1 was Islamic, none were lesbian, gay or bisexual, one was white and the other Black British. Page 22
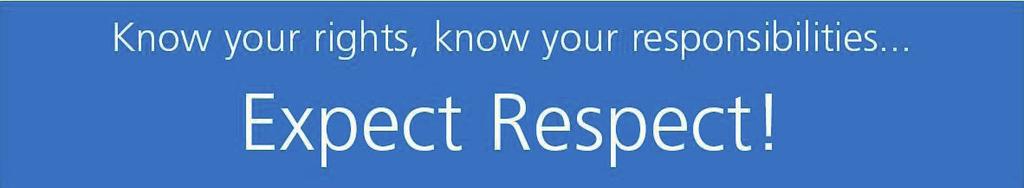
25 Bullying and Harrassment Six staff lodged bullying and harassment cases in the last year; this is less than half of the number of cases last year when 13 cases were lodged and is a relatively small number (Less than 0.2% of the overall workforce) and appears to be indicative or a climate in which employee relations issues are resolved at an informal stage before the formal process is invoked. The staff survey results still show issues with bullying and harassment and the HR team have implemented a safe haven initiative to address this in the hospital. Bullying and harassment is included in mandatory equality and diversity training. The Expect Respect campaign has been relaunched and a Say something about Bullying leaflet produced to aid staff in understanding what bullying and harassment is and how to address it. An event was held on Ban Bullying at Work Day on the 7th November A detailed breakdown of Bullying and Harassment Cases by protected characteristic is attached at Appendix Bullying. Age Half of the bullying cases & age group and 16 % respectively fell in the age groups 41-45, & 61 plus. The number of cases in these age groups are over-representative in terms of the percentage of the workforce employed. The age ranges 16-40, were not represented in bullying cases. This appears to show that older staff are more likely to perceive that they are being bullied and to lodge bullying cases, this needs to be monitored and explored further in the hospital. The policy needs to be promoted to all staff. Disability Over three quarters of the staff involved in bullying cases declared that they were not disabled and this is higher than expected with the number of non disabled staff in the workforce, the rest did not disclose their disability status. Disabled staff were not represented in bullying cases at all. We need to ensure that disabled staff are aware of the bullying and harassment policy. Page 23
26 Religion and Belief 33% of staff involved in bullying chose not to disclose their religion or belief. Of those that declared their religion and belief the highest percentage (50%) were Christian and % Atheist. Christian & Atheist staff are over represented in bullying cases in comparison to the workforce profile. Sexual Orientation Only % of staff involved in bullying did not wish to disclose their sexual orientation and this is the same as last year when % did not disclose % of staff involved in bullying cases were heterosexual and this group are over represented in bullying cases in comparison to the workforce profile. No lesbian, gay or bisexual staff were involved in bullying cases. We need to promote the Trust Bullying and Harassment Policy to LGBT staff and encourage confidence in disclosure. Gender 66.67% of bullying cases involved female staff this is slightly more than last year but is less than would be expected with a workforce of three quarters female. 33.5% of bullying cases involved males this is a reduction from 38.5% last year but is higher than would be expected with only 25% of the workforce being male. This appears to show that males are more likely to perceive that they are being bullied or to be bullied and to take out bullying cases than females and needs to be explored further and monitored on an on-going basis. Ethnicity All of the bullying cases in the last year for the second year running were lodged by White British staff; this is higher than expected with a White British workforce of 83% and for the third year White British are over represented in the number of bullying cases. No bullying cases were lodged by BME staff in the last year. This appears to indicate that White British staff are more likely to perceive that they are being bullied and to take out bullying cases. Awareness of the policy needs to be raised with BME staff and bullying cases should be monitored on an ongoing basis to identify any trends and patterns around ethnicity. The 2009 national staff survey found that nationally 16% of Black/black british staff, 20% of other asian and 18% of black british staff experienced bullying in acute settings. Our monitoring statistics do not reflect the national picture in this respect. Page 24
27 Other 83.33% % of bullying cases involved full-time staff and 16.67% involved part-time staff. Over three quarters of bullying cases (83.33%) were raised in admin & clerical and this is almost three times what would be expected with a 24.4% A & C workforce. This significant figure needs to be explored further to identify any underlying reasons % of cases were in estates & ancillary, no other occupational groups are represented in B & H cases and are under-represented. 67% of the staff had over 20 years service and a third had between 1 and 5 years service. No staff that had been on maternity leave in the last year reported bullying or harassment. Half of the staff that lodged bullying cases were married and none of these staff have taken maternity leave in the last 12 months. Page 25
28 Violence and Agression 115 staff in total were reported as being involved in incidents of violence and aggression in the last year. This is a relatively small number of staff in comparison to the overall workforce. A detailed breakdown of incidents of Violence and Aggression by equality protected characteristic is attached at Appendix Violence and Aggression. Age 20% of incidents were in the age group this is more than would be expected with the number of staff employed in this age group. The age group had 12% incidents. No staff aged were involved in reported incidents of violence and aggression however only a small percentage of the workforce is employed in this group. Disabled 2.61% of staff involved in incidents declared that they are disabled this is almost comparative to the percentage of staff that have declared that they are disabled in the workforce 2.24% % declared that they are non-disabled and over 50% have not disclosed their disability status. Religion and Belief The majority of the staff involved in incidents (over half) did not wish to disclose their religion and belief (50%), 37% declared that they are Christian and 3.48% atheist. Christian & Atheist staff are under represented in incidents of violence and aggression in comparison to the known percentage of atheist staff we have working for the hospital. Page 26
29 Sexual Orientation 54.7% of staff involved in incidents did not wish to disclose their sexual orientation % of incidents involved heterosexual staff. Lesbian, Gay and Bisexual staff were not involved in any reported incidents of violence and aggression. More work is required to increase disclosure of sexual orientation in the Trust to enable meaningful interpretation of the data and to promote incident reporting to LGBT Staff possibly via the LGBT Staff network. Gender % of incidents involved female staff this which is even higher than the representation of female staff in the workforce and 14.78% involved male staff which is less than expected in the workforce. This appears to show again that female staff are more likely to be involved in incidents of violence and aggression in the workforce and needs to be explored further. Ethnicity 80.87% of incidents involved staff that have declared that they are White this is representative of the the representation of white staff overall in the workforce % of incidents involved BME staff and this again is very slightly higher than the overall representation of BME staff in the workforce. The differential here would not warrant further investigation at this time however it needs to be monitored over time to identify any trends. Other 81% of incidents involved full-time staff and 18% part-time staff. 64% of incidents involved nursing and midwifery staff this is more than double the representation of nursing and midwifery staff in the overall workforce. Again additional clinical services were also over-represented in incidents reported 20% of incidents. This over-representation is being investigated further to identify any underlying reasons however it could be attributable to the nature of the patient-facing role. 51% of those involved incidents were single and 38% were married. None of the staff had been on maternity leave in the last 12 months. The majority of staff involved in incidents had between 1 and 20 years service 87.83%). Page 27
30 Leavers Analysis During , 426 staff left the Trust, this equates to 7.63% of the workforce. The breakdown of Leavers is attached at Appendix Leavers. Age A quarter of all leavers were in the age group 26-30, almost twice as many as would be expected with 13% of the overall workforce employed in this group. 18% of all leavers were in the age group 21 to 25 and this is more than three times the proportionate percentage of staff in this age group in the workforce (4.91%). This appears to be indicative of a retention issue with younger workers in the Hospital, this statistic needs to be explored further, compared to staff survey findings and monitored over time. Age groups 36-40, 41-45, & are significantly under represented in leavers in comparison to the percentage of the workforce employed in this group of leavers are aged 61 plus and this is twice as many as would be expected with 5.36% of staff employed in this group, however this age group includes retirement age. Disability 55.4% of leavers did not wish to declare their disability status this is an improvement on 64& in but still makes it difficult to make meaningful analysis. 42% of leavers were non-disabled and this is less than expected with a 55% non disabled workforce. 2.58% of leavers declared that they were disabled. The percentage of disabled leavers more or less reflects the percentage of employed disabled staff in the workforce. Religion and Belief We did not have the data relating to religion or belief for over 50% of leavers (18.5% unknown and 38% did not wish to disclose) this is an improvement in disclosure from last year but still makes it difficult to make any meaningful interpretation of the data. The highest number of leavers that declared their religion were Christian (32.68%) and this is less than expected with a known Christian workforce of 44% followed by 4.69% atheist.(roughly representative of the Atheist workforce). Page 28
31 Sexual Orientation We do not have the sexual orientation for 57% of leavers (38% did not wish to disclose and 19% undefined). This is an improvement from last year but still makes it difficult to make any meaningful interpretation of the data. 42% of leavers declared that they were heterosexual this is less than would be expected with a workforce that is 52% heterosexual, 0.94% were gay (slightly more than expected with 0.64% gay workforce)and 0% lesbian or bisexual these are relatively small numbers. Gender Over two thirds of leavers (68%) were female and 32% male, the percentage of female leavers was less than would be expected in a workforce of over 74% female but the significance of the under representation has decreased slightly since last year. Again the percentage of males that left is higher than would be proportionate for the proportion of males (25.5%) in the workforce though this over representation has decreased by 4% since last year it is still 7% more than would be expected. We did not have any staff that have declared that the gender they identify with now is not the gender that that were born with. This appears to demonstrate that again a higher proportion of males than would be expected are leaving the workforce and this needs to be explored further as it may be indicative of a problem with retaining male staff. Ethnicity Over two thirds of leavers were White British 69%. 13% were from BME staff, white British leavers are under represented and BME leavers over represented in relation to the diversity of the workforce. Other Over three quarters 81.2% of leavers have between 1 and 5 years service this is high and could be indicative of a retention issue % of leavers have less than 1 years service again this is high and could reflect retention issues for new staff. Only 3% of leavers have over 6 years service. Three leavers had took maternity leave in the last 12 months. Page 29
32 Leaver Reason Over a 3rd of staff resigned voluntarily (38.5%) and 20.19% TUPE transferred to another organization due to organizational change (slight reduction from 23% in the last reporting year). 8.92% of staff left for `other reasons this is a third of the other reasons recorded last year and may be due to improved recording of leaver reasons. The statistics of fixed term contracts ending was 11.5% and this has halved since the last report. 23% of leavers were transferred, % retired and 5.4% flexi-retired (in line with the Flexible retirement policy) (reduction from 16% last year) and 14 staff (3.29%) were dismissed. Four staff died in service (0.94%). Page 30
33 Sickness Absence The amount of time lost through sickness absence as a proportion of staff time available broken down by equality indicator is attached at Appendix Sickness Absence Breakdown. The overall sickness absence for the year was hours hours lost and this is a decrease from lost in 10/11. 75% of absence was reported by full time staff and 24.72% by part time staff (consistent to last year). 96 % of absence was reported by staff that have not declared that they are disabled and 3.99% by disabled staff. 83% of absence was again from female staff and this is higher than expected with a 75% female workforce % of absence was reported by males and this is less than expected with the male workforce. 87% of absence was White / White Irish staff and this is higher than expected with the workforce profile. 8.87% of absence was for BME staff and this is less than expected with the workforce profile of BME staff. The majority of sickness 29% was recorded in Admin and clerical and this is higher than expected with Nursing and midwifery and this is expected with 24% of the workforce in this group, 28.69% of absence is in nursing and midwifery and is lightly less than expected with circa 30% of the workforce in this group. Additional clinical services have a high sickness rate of 25% (an increase from last year) of the sickness absence with only % of the workforce employed in this occupational group and this needs to be investigate further to identify any underlying reasons. We are currently unable to report on sickness absence by length of service, age and maternity this is because the data comes from ESR it can not be run against fields that are calculated outside of ESR. Page 31
34 Attendance at Training The Trust has a duty to report on applicants for and in receipt of training. The Trust does not currently have the ability to report on applicants for training as Study leave forms are not in use in the hospital we are aiming to implement a process to meet this requirement for the next reporting period. The Trust does have the ability to report on staff that accessed formal training and development through our training records, a breakdown of staff that have attended training is detailed at Appendix Receipt of Training. We have 11, 748 records of staff attending training in the period and this is a reduction from records in Age Over % of staff attending training were in the age group with a relatively even spread of between 11 & 13%. A high number of age group accessed training compared to the makeup of the workforce. 13% of all training accessed was by staff aged over 55 however this is slightly less than would be expected with approximately 16% of the workforce being in this age group. Disability 57.86% of staff that accessed training were not disabled, 39.73% did not declare their disability status and 2.42% of staff declared that they were disabled; this is a good representation of disabled staff in training as 2.24 % of the workforce have actually declared that they are disabled. Effort is needed to increase disclosure to improve monitoring. Religion and Belief Over 44% of the staff attending training courses did not wish to disclose their religion or belief and this makes it hard to make any meaningful interpretation of the data. Of staff that did disclose their religion just under half 47.13% were Christian which is more than would be expected with a known Christian workforce of circa 44%. 4.49% were Atheist which is as would be expected in terms of the known atheist workforce. Buddhism, Jainism, and Sikhism were not represented in attendance at training. Page 32
35 Sexual Orientation For 44.71% of the training staff did not disclose their sexual orientation, 54% were heterosexual and this is an increase from 53% in this is slightly higher than would be expected with a workforce were 52% of staff are known heterosexuals. Lesbian, gay and bisexual staff made up 1.13% of attendees at training but this is representative as LGB staff make up less than 1% of the workforce overall. Gender More than three quarters of staff attending training were female (78.4%), this is a slight decrease from last year but is slightly higher than the percentage of female staff in the workforce overall (75%) Only 21.56% of staff accessing training were male, this is an increase from 19.98% last year however it is still an under-representation of male staff in accessing training (25.5% male workforce). This appears to demonstrate as in and that males are not receiving proportionally as much training as females in the workforce and needs to be investigated further. Ethnicity The majority of staff accessing training were White (85%) % were BME this is an increase from 8.5% if but is still slightly less than would be expected with an 11.32% BME workforce. This appears to demonstrate that BME staff are receiving less training than proportionate to the workforce this pattern was also evident in 09/10 and 10-11, the significance of the gap has narrowed however this should continue to be monitored on an ongoing basis. Other Circa three quarters (72%) of the staff attending training were full-time and 27.43% part-time. Staff attending training by occupational group nursing and midwifery and additional clinical services are over represented with 37% of training in this group, the number of medical and dental staff accessing training has doubled from last year to 7%. Staff in all groups need to be encouraged to access training. Almost half of the staff accessing training are married and 38% single. A third of staff receiving training have between 1 and 5 years service, and a quarter have 6-10, or years service. Only 12 % of staff accessing training have over 20 years service. Less than 5% of staff receiving training have less than a years service. Page 33
36 Personal Development Plans and Band Breakdown Personal Development Plans The Trust is required to report on the number of staff having personal development plans. We do not currently have the reporting systems in place to be able to meet these requirements by protected characteristic however this is being addressed to enable us to report on this in future equality monitoring reports. Band Breakdowns The workforce breakdown of staff by agenda for change band is attached at Appendix by band. The band breakdown shows that part-time staff are under-represented in the workforce from band 8a and above. Disabled staff are represented throughout the workforce at a level of approximately 2.25% of the workforce but not at band 1 or at the very senior levels of band 8d and band 9. It is recognised that there are only a small number of jobs at this level and we still have a high level of staff that have not disclosed their disability status. Disabled staff are under-represented in Band 3 only 1.37% and in non-afc less than 1%. Disabled staff are under represented throughout the trust in comparison to the community that we serve. LGB staff are under represented at band 7 and in non-agenda for change jobs. LGB staff are not represented at all in senior jobs band 8a, 8b and 9. There is still a high level of undisclosed data. Males are under-represented in all pay bands except pay band 8c, 8d and non-afc were females are under-represented. The band breakdown by ethnicity demonstrates that BME staff are well represented in non-a4c bands at 17.4% of the workforce and are well represented in band 5 jobs at 20%, Band 6 almost representative of the community however all other bands are under-represented in terms of comparison to representation in the local demography of 9%. Positive action should be undertaken to address the disparity. Page 34
37 Recommendations In line with our Single Equality and Human Rights Scheme the annual equality monitoring report will be reported to the Equality and Diversity Sub-Committee. The monitoring results will be reviewed and an action plan put in place to further investigate and redress any indications of potential disadvantage and to inform improvements to our workforce practice and employment monitoring processes. Page 35
38 Page 36
39
Annual Workforce Equality Monitoring Report
 Annual Workforce Equality Monitoring Report April 2012 - March 2013 Contents Introduction 2 Purpose 3-4 Staff in Post 5-7 Applicants for Employment 8-11 Applicants for Flexible Working 12 Maternity Leave
Annual Workforce Equality and Diversity Report 2016/2017. (Incorporating Workforce Race Equality Standard)
") Annual Workforce Equality and Diversity Report 2016/2017 (Incorporating Workforce Race Equality Standard) August 2017 1 1.0 Introduction This report is published to ensure that Chelsea and Westminster
Annual Workforce Equality and Diversity Report 2016/2017 (Incorporating Workforce Race Equality Standard) August 2017 1 1.0 Introduction This report is published to ensure that Chelsea and Westminster
Statutory Equality and Diversity Report: Workforce Equality Compliance Report January 2013
 Statutory Equality and Diversity Report: Workforce Equality Compliance Report January 2013 Page 1 of 35 Contents Executive Summary 4 1. Introduction 6 2. Workforce Overview 6 3. Workforce 7 3.1 Workforce:
We support providers to give patients safe, high quality, compassionate care within local health systems that are financially sustainable.
 Equality in our workforce: Monitor workforce at 31 March 2017 We support providers to give patients safe, high quality, compassionate care within local health systems that are financially sustainable.
NHS Bury CCG Equality Workforce Final
 NHS Bury CCG, AEP 2017: Appendix A NHS Bury CCG Equality Workforce Final Using data as at 31 st August 2016 Page 1 Document Control Date Amendment Version Comments/Author 12/12/2016 Samina Arfan Draft
EQUALITY & DIVERSITY ANNUAL EQUALITY WORKFORCE REPORT. 1st APRIL st MARCH 2014
 EQUALITY & DIVERSITY ANNUAL EQUALITY WORKFORCE REPORT 1st APRIL 213-31st MARCH 214 1 P a g e CONTENTS TITLE PAGE Introduction 3 Section 1 Workforce Overview 4 Section 2 Gender Identity 4-7 Section 3 Ethnicity
Workforce Sub-Committee
 Workforce Sub-Committee 12 th February 215 Statutory Annual Workforce Diversity Monitoring Report 214/15 Status: History: A paper for information Annual report Ann Macintyre Director of Workforce & Organisational
Diversity and Equality Annual Monitoring Report
 Diversity and Equality Annual Monitoring Report Agenda item This report is for: Decision Discussion To Note History Title Annual Equality and Diversity Data 2015 Executive Director lead and presenter Director
Appendix 1. Equality Information Report Workforce and Governing Body Members Equality Information (incorporating 2017 WRES data)
") Equality Information Report 2016-17 Appendix 1 Workforce and Governing Body Members Equality Information (incorporating 2017 WRES data) For further information please contact: Emdad Haque Senior Equality,
Equality Information Report 2016-17 Appendix 1 Workforce and Governing Body Members Equality Information (incorporating 2017 WRES data) For further information please contact: Emdad Haque Senior Equality,
Workforce Equality Information Report. January 2012
 Workforce Equality Information Report 1.0 Introduction Norfolk Community Health and Care NHS Trust is a public authority under the terms of the Equality Act 2010, the Trust has a legal duty to promote
Equality in our workforce
 Equality in our workforce Equality data about the Care Quality Commission's January 2012 Contents Page 1. Introduction 2 2. Staff profile 3 3. Staff joining CQC 7 4. Staff leaving CQC 10 5. Staff profile
Workforce Equality Monitoring Report
 Workforce Equality Monitoring Report 2015-2016 Page 1 Workforce Equality Content Section Page 1 Introduction 3 2 General context 5 3 Actions taken and next steps 7 4 Improving our diversity profile 11
Workforce Compliance Report January 2015
 Workforce Compliance Report January 2015 1 CONTENTS Page Executive Summary 3 Introduction 4 Current Position 4 Summary Workforce Profile November 13 October 2014 5 Ethnicity 5 Gender 6-8 Age 8 Disability
Equality Workforce Monitoring Report
 Equality Workforce Monitoring Report July 2011 Equality Workforce Monitoring Report Contents 1. Foreword... 3 2. Introduction... 4 3. Workforce Information... 5 4. Gender breakdown... 7 5. Disability breakdown...
Workforce Sub-Committee
 Workforce Sub-Committee 19th October 2011 Statutory Annual Workforce Diversity Monitoring Report 2011/12 Status: History: A paper for discussion Annual report Ann Macintyre Director of Workforce & Organisational
Workforce Equality Monitoring Annual Report
 Workforce Equality Monitoring Annual Report 2010-2011 CONTENTS 1. INTRODUCTION...3 1.1 FOREWORD...3 1.2 LEGAL REQUIREMENTS...3 1.3 WORKFORCE DATA...4 1.4 POLICIES AND PROCEDURES...5 1.5 SUMMARY OF MONITORING...5
Report on the diversity profile of Ofcom colleagues
 Report on the diversity profile of Ofcom colleagues Publication date: 2014 About this document This document is a report on the diversity profile of Ofcom colleagues. It provides analysis on the age, disability,
Equality in our Workforce Annual Workforce Report 2013
 Avon and Wiltshire Mental Health Partnership NHS Trust Equality in our Workforce Annual Workforce Report 2013 The Annual Workforce Report includes the following: 1. Introduction 2. Equality Information
Countess of Chester Hospital NHS Foundation Trust Annual Workforce Equality Analysis (2017)
") Countess of Chester Hospital NHS Foundation Trust Annual Workforce Equality Analysis (2017) - 1 - Contents 1. Introduction.....3 1.1 About this report...........3 1.2 About the organisation........3 1.3
Countess of Chester Hospital NHS Foundation Trust Annual Workforce Equality Analysis (2017) - 1 - Contents 1. Introduction.....3 1.1 About this report...........3 1.2 About the organisation........3 1.3
Workforce Diversity Report
 Workforce Diversity Report 15-16 Creating a fairer Britain Contents 1. Introduction... 4 1. Background... 5 1.3 Scope... 5 1.4 Data quality... 5 1.5 Staff diversity declaration rates 5 1.6 Interpreting
Equality Workforce Monitoring Annual Report
 Equality Workforce Monitoring Annual Report 217 Commissioned by: Claire Hartland HR Business Manager March 217 Report Produced by: Nathalie Likutu Workforce Planning Department Workforce Monitoring 216
The Health Board objective of delivering the highest quality services possible can only be achieved by a workforce that is sufficiently skilled,
 Section A: Assessment Name of Policy Partnership and Recognition Agreement Person/persons conducting this assessment with Contact Details Rachel Pressley, Workforce Governance Manager Andrew Crook, Head
Statutory Equality and Diversity Report
 Statutory Equality and Diversity Report for employees at Kingston Hospital NHS Trust 2014-2015 Carolyn Floyd Workforce Information & Systems Manager 1 1. Introduction The following report analyses the
Annual Equality Report
 Annual Report 2016 Annual Report 2016 Version 1 Author: Jo Petch Head of Staff Engagement and 1 Director of Workforce Foreword Maidstone and Tunbridge Wells NHS Trust (MTW) has a legal and moral obligation
Workforce Equality Monitoring Report 2017
 Workforce Equality Monitoring Report 2017 Staff Summer Garden Party Bake off" 2017 If you require this information in an alternative format or language, please contact Diana Nowak by email: diana.nowak@christie.nhs.uk
NHS Shetland Equality and Diversity Workforce Monitoring Report Update 2017
 NHS Shetland Equality and Diversity Workforce Monitoring Report Update 2017 Date: April 2017 Version number: 1 Authors: Lorraine Allinson HR Services Manager Review Date: April 2018 If you would like this
Equality & Diversity Workforce Profile Report
 Equality & Diversity Workforce Profile Report January 2012 Aspire Achieve Succeed Compiled by HR March 2012 Equality and Diversity Workforce Report January 2012 Contents Policy Statement... 3 The Wider
Strathclyde Partnership for Transport. Equality and Diversity Monitoring Report 2017
 Strathclyde Partnership for Transport Equality and Diversity Monitoring Report 2017 List of Figures Figure 1 Age profile by year 2012/2015/2016 Figure 2 Employee profile by Age group and Job Grade Table
Cardiff and Vale University Health Board. Rachel Pressley, Senior HR Policy & Compliance Officer Rebecca Marsh, Assistant HR Manager
 Section A: Assessment Cardiff and Vale University Health Board Name of Policy Person/persons conducting this assessment with Contact Details RECRUITMENT AND SELECTION POLICY Rachel Pressley, Senior HR
Appendix 1 Workforce Equality Monitoring Report 2015/16
 Workforce Equality Monitoring Report 2015/16 This report is produced in accordance with the Trust s responsibilities under the Public Sector Equality Duty. It contains the workforce equality data that
PRESTON S COLLEGE WORKFORCE EQUALITY AND DIVERSITY STRATEGY
 PRESTON S COLLEGE WORKFORCE EQUALITY AND DIVERSITY STRATEGY 2016-2019 1 2016-2019 1. The College Preston s College is a large and diverse General Further Education College providing teaching, learning
Equal Pay Statement and Gender Pay Gap Information
 Equal Pay Statement and Pay Gap Information April 2017 1 Accessibility If you would like this document in alternative formats such as Braille, large print, audio or in a language of your choice, please
Equality Update and Employment Monitoring Report
 Equality Update and Employment Monitoring Report 2016 Date: April 2016 Version number: Authors: 1b Emilie Gray, Senior HR Advisor Review Date: April 2017 If you would like this document in an alternative
GRIEVANCE POLICY AND PROCEDURE Dealing with Employee Concerns
 GRIEVANCE POLICY AND PROCEDURE Dealing with Employee Concerns Responsible Approved By Equality Assessed of Human Resources Area Partnership Forum We are working to ensure that no-one is treated in an unlawful
Monitoring for equality and diversity: what healthcare employers need to know and do
 January 2009 Briefing 58 what healthcare employers need to know and do NHS organisations need to know who their patients and staff are, and understand their needs, in order to improve services and employee
Valuing difference. College of Policing workforce summary October 2017
 Valuing difference College of Policing workforce summary October 2017 Contents Page Foreword 3 Introduction 4 Caveats 4 Representation 6 Recruitment 16 Retention 18 Reward, recognition and pay 20 Review
Human Resources People and Organisational Development. Equality of Opportunity Policy
 Human Resources People and Organisational Development Equality of Opportunity Policy May 2016 Contents 1 Introduction and scope... 3 2 Responsibility for the policy... 3 3 Recruitment and selection...
WORKFORCE RACE EQUALITY STANDARD
 WORKFORCE RACE EQUALITY STANDARD Annual Report June 2015 1 Contents Page Item Description Page Number 1 Introduction 3 2 Summary 3 3 Background 3 4 Why is the standard important to our business? 3-4 5
COMMUNITY FIRST RESPONDER APPLICATION FORM
 www.nhs.uk/jobs COMMUNITY FIRST RESPONDER APPLICATION FORM APPLICATION PART A Department Community First Responder Voluntary Personal Details * Surname/Family Name * First Names Name in which you are registered
Controlled Document Number: Version Number: 002. On: October Review Date: October 2020 Distribution: Essential Reading for: Page 1 of 12
 Equality and Diversity in Employment Policy CONTROLLED DOCUMENT CATEGORY: CLASSIFICATION: PURPOSE Controlled Document Number: Policy Version Number: 002 Controlled Document Sponsor: Controlled Document
WORKFORCE EQUALITY AND DIVERSITY REPORT
 WORKFORCE EQUALITY AND DIVERSITY REPORT For the period April 2015 March 2016 Produced by: Liz Case-Green - Employment Services Manager Graphs kindly supplied by Jay Tyrrell ABBREVIATIONS USED WITHIN THE
Basingstoke & North Hampshire NHS Foundation Trust Initial Equality Impact Assessment Screening Template
 PART 1 WORK DESCRIPTION: TO BE COMPLETED BY LEAD PERSON What is the name of this Function/Policy, Procedure/Facility? Who is the owner of this Function/Policy/Procedure/ Facility? Tell us about this area
Workforce Race Equality Standard
 Workforce Race Equality Standard 2016 2021 Part of our Trust Strategy to Promote and Improve Equality Diversity and Inclusion for Black Asian and Minority Ethnic Service Users and Staff 2 Contents Introduction
Diversifying Our Workforce: Employee Equality Information
 Diversifying Our Workforce: Employee Equality Information At the core of the BBC s role is something very simple, very democratic and very important to bring the best to everyone. Wherever you are whoever
Equality & Diversity Policy
 Equality & Diversity Policy The Equality Act 2010 is the law which bans unfair treatment and helps achieve equal opportunities in the workplace and in wider society. The act replaced previous antidiscrimination
CIH Northern Ireland Board Recruitment information pack
 CIH Northern Ireland Board Recruitment information pack July 2016 Page 1 of 7 Foreword Thank you for your interest in becoming a member of the Northern Ireland Board of the Chartered Institute of Housing
CHANNEL FOUR TELEVISION CORPORATION 2014 REPORT ON COMPLIANCE WITH THE GENERAL EQUALITY DUTY
 CHANNEL FOUR TELEVISION CORPORATION 2014 REPORT ON COMPLIANCE WITH THE GENERAL EQUALITY DUTY Background Channel 4 s public service remit makes us a different kind of broadcaster, one that broadcasts different
The WRES is intended to provide a platform and direction to encourage and help NHS organisations to:
 Workforce Race Equality Standard Progress Report 2017 1.0 Introduction Almost one in five of the staff working in the NHS is from a black and minority ethnic (BME) background. The WRES has found that the
Volunteer Registration Form
 Volunteer Registration Form To be used by all people wishing to volunteer in NHS Lanarkshire PERSONAL DETAILS Title: Name: Address: Postcode: Tel: (Home) Tel: (Mobile) E-mail Preferred contact method What
Equality and Diversity policy
 Equality and Diversity policy Document Reference No. KCHFT HR012 Status Final Version Number 2.5 Replacing/Superseded policy or Equality and Diversity Policy v2.4 documents Number of Pages 13 Target audience/applicable
Equality and Diversity Policy
 Equality and Diversity Policy Hertfordshire, Bedfordshire and Luton Clinical Commissioning Groups Page 1 of 15 DOCUMENT CONTROL SHEET Document Owner: Director of Workforce Document Author(s): Louise Thomas,
Accessible Information Standards (AIS)
") Equality and Diversity Quarterly Assurance Report For submission to: Equality and Diversity Business Partner GM Shared Services (Oldham CCG) November 2016 Progress on implementing: Workforce Race Equality
Equality and Diversity Quarterly Assurance Report For submission to: Equality and Diversity Business Partner GM Shared Services (Oldham CCG) November 2016 Progress on implementing: Workforce Race Equality
Equality, Diversity & Inclusion Policy and Framework Version 1.2 Owner: Diversity & Inclusion, HR Approved by Ian Iceton, Group HR Director
 Equality, Diversity & Inclusion Policy and Framework Version 1.2 Owner: Diversity & Inclusion, HR Approved by Ian Iceton, Group HR Director Date issued 31.01.2017 Reference NR/HR/POU024 1. Policy Statement
Equal Pay Statement and. Gender Pay Gap Information
 Equal Pay Statement and April 2017 Doc: 2016-07-26 Equality Pay Statement & Page 1 Equal Pay Statement and Content Page 1. Our Service 3 2. Equality and the equal pay gap 3 3. Legislative framework 4 4.
Workforce Race Equality Standard (WRES) Data and Action Plan
 Data and Action Plan") Workforce Race Equality Standard (WRES) Data and Action Plan 2017-2018 No WRES Indicator Metric and data set (UNIFY2: 2017) 1. Percentage of BME staff in bands 8-9 and Very Senior Managers (VSM) including
Workforce Race Equality Standard (WRES) Data and Action Plan 2017-2018 No WRES Indicator Metric and data set (UNIFY2: 2017) 1. Percentage of BME staff in bands 8-9 and Very Senior Managers (VSM) including
General Optical Council: Equality and Diversity Monitoring Report 2016
 2016 General Optical Council: Equality and Diversity Monitoring Report Contents Page Contents... 1 1. Executive Summary... 2 2. Who are the GOC?... 9 3. Our Equality Scheme... 10 4. Our Registrants...
MacIntyre Academies Equality Objectives
 MacIntyre Academies 2016-2020 MacIntyre Academies publishes this document in accordance with The Public Sector Equality Duty 2011. The Equality Duty sets out three aims under the general duty for schools/academies
Workforce Race Equality Standard (WRES) 2017 Reporting
 2017 Reporting") Workforce Race Equality Standard (WRES) 2017 Reporting 1. Name of organisation Northampton General Hospital NHS Trust 2. Date of report August 2017 3. Name and title of Board lead for the Workforce Race
Workforce Race Equality Standard (WRES) 2017 Reporting 1. Name of organisation Northampton General Hospital NHS Trust 2. Date of report August 2017 3. Name and title of Board lead for the Workforce Race
January Equality Data Analysis Report The NHS Equality Delivery System. In compliance with the Public Sector Equality Duty (Equality Act 2010)
") West Midlands Ambulance Service NHS Trust Equality Data Analysis Report The NHS Equality Delivery System In compliance with the Public Sector Equality Duty (Equality Act 2010) January 2012 1 Table of contents
West Midlands Ambulance Service NHS Trust Equality Data Analysis Report The NHS Equality Delivery System In compliance with the Public Sector Equality Duty (Equality Act 2010) January 2012 1 Table of contents
Killinghall Primary School. Equality Policy adopted from Bradford PACT HR
 Killinghall Primary School Equality Policy adopted from Bradford PACT HR Contents A whole school equality policy Introduction... 3 Scope of the Policy... 3 Statement Of Intent... 4 Roles and Responsibilities...
RECRUITMENT AND SELECTION POLICY
 RECRUITMENT AND SELECTION POLICY Reference No: UHB 220 Version No: 1 Previous Trust / LHB Ref No: TR56 Documents to read alongside this Policy, Procedure etc (delete as necessary) Recruitment & Selection
KENT COUNTY COUNCIL. Application for Employment. Job Applied for: Reference No.: Closing Date: Title and Last Name/Family Name: Previous Last Name:
 KENT COUNTY COUNCIL Application for Employment This form is also available on computer disk, audio tape and Braille. Please complete using black ink or type. Job Applied for: Reference No.: Closing Date:
EQUALITY, DIVERSITY AND HUMAN RIGHTS POLICY
 EQUALITY, DIVERSITY AND HUMAN RIGHTS POLICY 1.0 STATEMENT OF INTENT Equality, diversity and human rights are integral to the work of PBHA, and form a key part of our vision and mission. Our principles
Equality of Opportunity in Employment Policy
 Equality of Opportunity in Employment Policy DOCUMENT INFORMATION CATEGORY: THEME: Policy Workforce Inclusion, Equality and Diversity DOCUMENT REFERENCE: 3.12 POLICY LEAD: DIRECTOR LEAD: Associate Director
Supplier s guide to Diversity&Inclusion
 Supplier s guide to Diversity&Inclusion Diversity is what makes us the we are. That could be nationality, education, religion, sexual orientation, life experience, gender, ethnicity, race, age, or even
EQUALITY OF OPPORTUNITY POLICY
 EQUALITY OF OPPORTUNITY POLICY Updated: June 2013 Version History Date Version Author/Editor Comments 17 Sept 2012 1.1 Draft Anthony Vage 25 Sept 2012 1.2 Draft Anthony Vage 20 March 2013 Initial first
Workforce Race Equality Standard (WRES) Progress Report 2016
 Progress Report 2016") Workforce Race Equality Standard (WRES) Progress Report 2016 Approved by the Haringey CCG Quality Committee in October 2016 Haringey Clinical Commissioning Group River Park House 225 High Road Wood Green
Workforce Race Equality Standard (WRES) Progress Report 2016 Approved by the Haringey CCG Quality Committee in October 2016 Haringey Clinical Commissioning Group River Park House 225 High Road Wood Green
EQUALITY AND INCLUSION STRATEGY
 EQUALITY AND INCLUSION STRATEGY 2016-2020 Version: 8 FINAL Director: Bev Searle, Director of Corporate Affairs Author: Stef Abrar, Equality & Diversity Manager Date: August 2016 Contents 1. PURPOSE...
Equality and Diversity Policy
 Equality and Diversity Policy 1 Reader Information Reference Title Equality and Diversity Policy Document purpose To set out and confirm our commitment to promoting equal opportunities and to recognise
Single Equality Scheme and Action Plan
 Single Equality Scheme and Action Plan 2009-2012 To create the right conditions for our staff to put our patients needs at the heart of everything we do Contents Page Chapter Contents Page 1. Introduction
Redeployment Policy and Procedure
 Redeployment Policy and Procedure 1. Scope This policy sets out a framework for managers to manage redeployment in a fair and effective manner, in line with the School s policy statement on equality and
Equality Impact Assessment Screening Template Please refer to EIA framework to assist you in the completion of this template.
 Equality Impact Assessment Screening Template Please refer to EIA framework to assist you in the completion of this template. School or Department Graduate Research School Title of strategy, policy, service,
Equality and Diversity in Employment Policy
 RCCG/GB/16/163 v. Equality and Diversity in Employment Policy Version No Author Date Comments Approved by V1.0 Lynne Sharp 8-9-16 First draft for comments AGEM HR BP November HR Comments 2016 17-11-16
Equality, Diversity & Human Rights Annual Report
 Equality, Diversity & Human Rights Annual Report 2011-2012 County Durham & Darlington NHS Foundation Trust Jillian Wilkins, Equality and Diversity Lead 0 Table of Contents Executive Summary... 3 1. Introduction...
DIVERSITY AND EQUALITY OF OPPORTUNITY POLICY
 DIVERSITY AND EQUALITY OF OPPORTUNITY POLICY Document Title Diversity and Equality of Opportunity Policy Document Number 2011/47 v1 Authors Viv Stirrup/Claire Matthews Author s Job Title Independent Advisor/Assistant
Workforce Race Equality Standard 2017
 Workforce Race Equality Standard July Introduction The purpose of this report is to provide the key findings for The Royal Marsden in relation to the Workforce Race Equality Standard (WRES) in. The Equality,
Mind Equalities Statement
 Mind Equalities Statement Equalities Statement Equality and diversity are essential to Mind s mission. As a whole organisation, we will seek to implement this priority in all our work. We are committed
Talent Management & Maximising Potential Conversation Tools: Research Evaluation Questionnaire
 Talent Management & Maximising Potential Conversation Tools: Research Evaluation Questionnaire Staff Member Version (v0.9 for Cohort 2 Pilots) Research Evaluation Questionnaire What are Talent Management
Equality and Diversity Policy
 RCCG/GB/14/176i Equality and Diversity Policy Version No Author Date Comments Approved by V1.0 Becky Jones 2-10-14 APPROVED Quality and Risk Committee 1 Reader Information Reference Title ED001 Equality
Yorkshire Wildlife Park Job Application Form
 Yorkshire Wildlife Park Job Application Form Title of post applied for: Job Ref: Please refer to the accompanying guidance notes before completing this form. Please write clearly in black ink or type.
Equality & Diversity Policy and Procedure
 Equality & Diversity Policy and Procedure Contents 1. Policy Statement 2. Purpose and Scope 3. The Definition of Equality and Diversity 4. Forms of Discrimination 5. Legislative and Regulatory Context
Workforce Race Equality Standard Progress Report July 2017
 Purpose Workforce Race Equality Standard Progress Report July 2017 This report provides the information which will be included in the Trust s published WRES report this year. It includes the data for the
APPLICATION FOR EMPLOYMENT
 APPLICATION FOR EMPLOYMENT Please return your completed form to the recruiting school. If you have not received an invitation to the next stage of the recruitment process within 6 weeks of the closing
Equality and Diversity Policy
 Equality and Diversity Policy Version No Author Date Comments Approved by V1.0 Becky Jones 2-10-14 APPROVED Quality and Risk Committee V2.0 Craig Sharples 20-07-16 Draft updated to reflect current structures
Workforce Race Equality standard Royal Cornwall Hospital Trust Baseline assessment for April 2015
 Workforce Race Equality standard Royal Cornwall Hospital Trust Baseline assessment for April 2015 Page 1 of 26 Introduction What is the Workforce Race Equality Standard? The Workforce Race Equality Standard
Catch22 policy Equality and Diversity
 Catch22 policy Equality and Diversity Contents 1. What is the Equality & Diversity policy statement about? 2 2. What is the policy for? 2 3. Policy statement 2 4. Definitions 3 5. Legislation 4 6. How
EQUALITY & DIVERSITY. CORE POLICY In accordance with its statement of intent, the company commits itself to the following:
 EQUALITY & DIVERSITY KNIGHTS BROWN Knights Brown recognises that its underlying success depends on recruiting and retaining the right people and encouraging them to reach their full potential. We recognise
osborneclarke.com The Equality Act 2010
 As the election dust settles and the new Government begins to deliver in practice on its coalition agreement, the Equality Act 2010, which seems to have been hovering over employers for an eternity, will
SAXON WEALD EQUALITY AND DIVERSITY POLICY
 SAXON WEALD EQUALITY AND DIVERSITY POLICY First Approved: May 2002 Author: Tom d Auvergne Last Revision: September 2014 Next Review: September 2017 1.0 Introduction and aims 1.1 This policy sets out our
Hamp Academy. Equal Opportunities Policy. Version 2.0. Policy Created Date: 1 st September Andy Berry on behalf of the Sponsor.
 Hamp Academy Equal Opportunities Policy Version 2.0 Written By: Policy Created Date: Peter Elliott 1 st September 2012 Signature Andy Berry on behalf of the Sponsor Signature Chief Executive Officer Bridgwater
Derbyshire County Football Association Inclusion Advisory Group Information Pack January 2018
 Derbyshire County Football Association Inclusion Advisory Group Information Pack January 2018 What is an Inclusion Advisory Group (IAG)? The Derbyshire County FA IAG will support and advise the County
Recruitment and Selection Policy and Procedure
 Recruitment and Selection Policy and Procedure Date Impact Assessed: March 2014 Version No: 1 No of pages: 14 Date of Issue: Date of next review: April 2015 Distribution: All employees Published: Recruitment
NCHA Equality, Diversity and Inclusion Strategy 2015/16
 NCHA Equality, Diversity and Inclusion Strategy 2015/16 Diversity Supporting NCHA 1 EQUALITY, DIVERSITY AND INCLUSION STRATEGY RESPONSIBLE DIRECTOR: CHIEF EXECUTIVE RESPONSIBLE OFFICER: HEAD OF HR LAST
EQUALITY, DIVERSITY AND INCLUSION POLICY
 EQUALITY, DIVERSITY AND INCLUSION POLICY 1. POLICY STATEMENT Live & Local helps our community breathe Live & Local volunteer promoter. 1.1. Live & Local respects, values and embraces diversity and difference.
Annual leave and bank holiday policy
 Document level: Trustwide (TW) Code: HR2.6 Issue number: 3 Annual leave and bank holiday policy Lead executive Director of Nursing Therapies Patient Partnership Author and contact number Head of Human
Application Form PERSONAL DETAILS CONTACT DETAILS
 Application Form Please complete in black pen. Do not enclose a C.V or additional documents as these will not be considered. All sections of the form must be completed. You may attach continuation sheets
Workforce Equality and Diversity Policy
 Type of Document Code: Policy Sponsor Lead Executive Recommended by: Workforce Equality and Diversity Policy Policy STHK0088 Deputy Human Resources Director Human Resources Director Policy Sub-Group Date
Cumbria County Council Job application form. including guidance notes. Helpful tips
 Cumbria County Council Job application form including guidance notes Helpful tips Use a black pen and write in CAPITAL LETTERS. Write as clearly as you can. Check that you have enclosed all the evidence
National Services Scotland (NSS) Pay Gap Report April 2017
 Pay Gap Report April 2017") National Services Scotland (NSS) Pay Gap Report April 2017 1 CONTENTS 1. Introduction 4 2. NSS Workforce Profile 4 2.1 Gender Profile 4 2.2 Part-time/ Full-time Workforce Profile 5 3. NSS Gender Profile
National Services Scotland (NSS) Pay Gap Report April 2017 1 CONTENTS 1. Introduction 4 2. NSS Workforce Profile 4 2.1 Gender Profile 4 2.2 Part-time/ Full-time Workforce Profile 5 3. NSS Gender Profile
Equality and Diversity Policy
 Equality and Diversity Policy Policy Statement BIC Innovation is committed to encouraging diversity and eliminating discrimination in both its role as an employer and as a provider of services. BIC Innovation