The Micro and Macro of Job Polarization
|
|
|
- Leon Gabriel Hardy
- 5 years ago
- Views:
Transcription
1 Matias Cortes (University of Manchester) Nir Jaimovich (Duke University) Christopher J. Nekarda (Federal Reserve Board) Henry E. Siu (University of British Columbia) IZA Workshop on the Future of Labor February, 2013
2 Goals of the paper: Understand the micro-level dynamics underlying the process of labor market polarization. Use matched data from the monthly CPS to study the transitions of individuals across occupations and employment states during different phases of the business cycle. Determine the extent to which the aggregate fall in routine employment per capita is due to changes over time in: 1. Occupational switching of employed workers (with or without intervening spells of unemployment). 2. Exit from the labor force of workers previously in routine employment. 3. Changes in the occupational choices of labor market entrants and re-entrants. Study the extent to which changes in switching rates can be attributed to demographic composition changes or to changes in the switching behavior of particular demographic groups.
3 Motivation Labor market polarization: Employment share in high-skill, high-wage occupations and in low-skill, low-wage occupations increasing relative to share in middle-wage occupations (Acemoglu and Autor (2011), Dustmann, Ludsteck, and Schönberg (2009), Goos, Manning, and Salomons (2009)). Occupations in the middle of the wage distribution have a high content of routine tasks (Autor, Katz, and Kearney (2006) and Goos and Manning (2007)). The disappearance of routine jobs occurs mostly during recessions, and is tied to the phenomenon of jobless recoveries (Jaimovich and Siu, 2012). Graph
4 Motivation Polarization literature has focused on changes over time in aggregate employment shares. Some work at the local labor market level: Autor and Dorn (2009). Some work on occupational mobility patterns for routine workers, conditioning on employment: Cortes (2012). Contributions of this paper: Study worker flows underlying process of disappearing routine employment, considering both occupational mobility of employed workers, and transitions in and out of employment. Study how transition rates interact with the business cycle and can help explain polarization. Determine whether changes in switching patterns are due to compositional shifts or changes in switching propensities.
5 Motivation Why study different phases of the business cycle separately? Much of the cyclical fluctuation in unemployment is due to fluctuations in the job finding rate (JFR): Hall (2006), Shimer (2012). Aggregate employment fluctuations are almost fully driven by fluctuations in routine employment: Jaimovich and Siu (2012). Therefore understanding the disappearance of routine employment requires an understanding of the cyclical properties of the switching rates in and out of different occupations (particularly JFRs), and how those cyclical properties have changed over time. Example
6 Findings: Routine Manual For routine manual workers, we find that, after 1990: We observe a significant fall in the return job finding rate for unemployed routine manual workers. This fall in return job finding rates is not observed for unemployed non-routine workers. Fall is not due to changes in the composition of the pool of unemployed routine manual workers, but rather due to changes in the return job finding rates for all demographic groups. Unemployed routine manual workers are more likely to leave the labor force. Employed routine manual workers are more likely to separate (and to leave the labor force) during recoveries. This change in propensities to leave the labor force is not observed for workers in any of the other occupation groups. It is not due to changes in the composition of the pool of employed routine manual workers along observable characteristics, but rather due to a change in the propensities to leave the labor force, particularly for male and married routine manual workers.
7 Findings: Routine Manual There is also a fall in the entry rate from NLF towards routine manual employment. Driven by a fall in the propensities to enter routine manual employment, particularly for the young.
8 Findings: Routine Cognitive For routine cognitive workers, we find that, after 1990: We observe a significant fall in the return job finding rate for unemployed routine cognitive workers. This fall in return job finding rates is not observed for unemployed non-routine workers. The fall is not due to changes in the composition of the pool of unemployed routine cognitive workers, but rather due to changes in the return job finding rates for all demographic groups. Unemployed routine cognitive workers have higher probabilities of remaining unemployed. They are also more likely to leave the labor force in recessions and expansions. Employed routine cognitive workers experience essentially no change in their separation rates.
9 Data Matched monthly data from the Current Population Survey (CPS). January March 2012 (with a few breaks). Group all individuals into 10 non-overlapping categories, according to their labor force status and their current or most recent occupation: Table : Employment/Occupation categories and fraction of sample Category % Category % Emp: Non-Routine Cognitive 20.1% Unemp: Non-Routine Cognitive 0.5% Emp: Routine Cognitive 16.1% Unemp: Routine Cognitive 0.9% Emp: Routine Manual 16.0% Unemp: Routine Manual 1.4% Emp: Non-Routine Manual 9.1% Unemp: Non-Routine Manual 0.8% Not in the labor force 34.7% Unemp: No Occupation Reported 0.4% Note: Workers in Farming, Fishing, Forestry and Military occupations excluded from the sample.
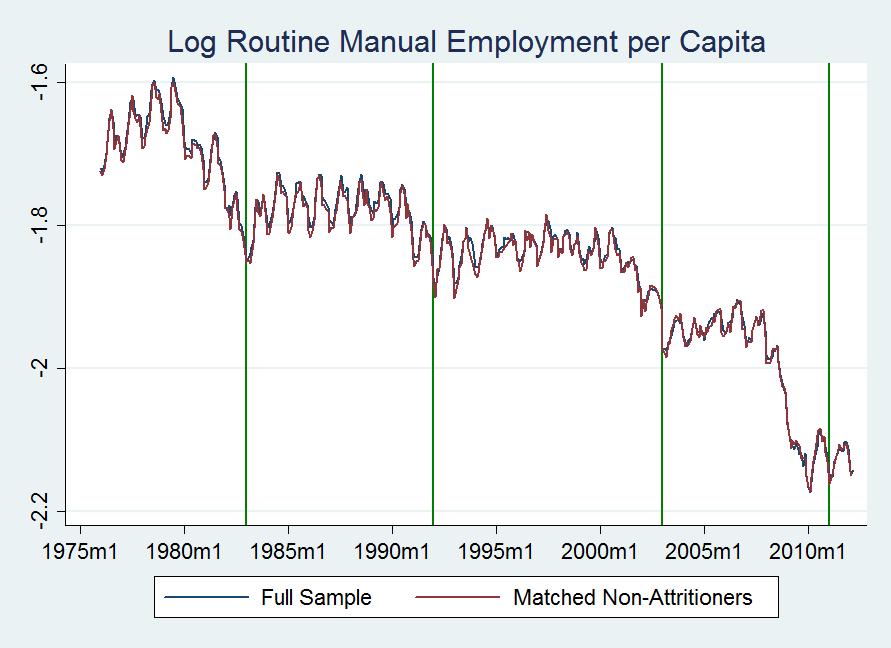
10 Data We use information on an individual s labor force status and occupation in two subsequent months to construct switching rates. Therefore, we do not include: Individuals who cannot be matched. Individuals who are scheduled to leave the sample (due to rotating panel). Attritioners. Full vs Matched Sample
11 Switching Rates We split the sample into three business cycle phases: 1. Recessions: Peak to trough based on NBER Recession Dates. 2. Recoveries: 12 months from the recession trough. 3. Expansions: All other months.
12 Empirical Strategy Consider two employment/occupation states A and B, for example A could be Employed Routine Manual and B could be Not in the Labor Force. Let Yi,t AB be a dummy equal to 1 if individual i switches from state A to state B between month t and month t + 1. We estimate the following linear probability models using data for all individuals in state A in month t: Y AB i,t = X A i,t β AB + ɛ i,t (1) Xi,t A includes controls for age, education, gender, race, marital status, seasonal effects and GDP growth. By construction, averaging across individuals and over time, Y AB is equal to the average switching rate between states A and B over the whole sample period.
13 Oaxaca Decomposition We estimate Equation (1) separately for two broad time periods: before 1990 ( before polarization ) and from 1990 onwards ( during polarization ) using data from a particular phase of the cycle (i.e. recessions, recoveries or expansions). We can then perform a Oaxaca decomposition as follows: ( ) Y AB 0 Y AB 1 = X A 0 X A ( ) βab X A ( βab 1 0 ) AB β 1 (2) where 0 and 1 denote the pre-1990 and post-1990 time periods, respectively.
14 Oaxaca Decomposition This Oaxaca decomposition will tell us the extent to which changes in the average switching rate between the two periods for a particular phase of the cycle: Y AB 0 Y AB 1 are due to: Changes in composition: X A 0 X A 1, or Changes in the propensities to switch: βab AB 0 β 1. For example, how much of the change over time in the recovery-phase switching rate from Routine Manual Employment to Not in the Labor Force is due to: Changes in the characteristics of the pool of routine manual employees in recoveries. Changes in the propensities of routine manual employees of particular demographic groups to leave the labor force during recoveries.
15 Oaxaca Decomposition Results: Return Job Finding Rates For expansion periods (switching rates from unemployment back to original occupation): Occ group 1 group 2 difference explained unexplained Obs. RM ,645 (0.0013) (0.0012) (0.0018) (0.0008) (0.0020) RC ,197 (0.0016) (0.0012) (0.0020) (0.0009) (0.0022) NRM ,475 (0.0016) (0.0013) (0.0021) (0.0009) (0.0022) NRC ,250 (0.0022) (0.0015) (0.0027) (0.0013) (0.0030)
16 Oaxaca Decomposition Results: Outflows from the Labor Force for Employed Workers For recovery periods (switching rates from employment to out of the labor force ): Occ group 1 group 2 difference explained unexplained Obs. RM ,858 (0.0003) (0.0003) (0.0004) (0.0004) (0.0005) RC ,356 (0.0003) (0.0003) (0.0005) (0.0004) (0.0006) NRM ,353 (0.0007) (0.0005) (0.0008) (0.0009) (0.0011) NRC ,109 (0.0003) (0.0002) (0.0003) (0.0003) (0.0005)
17 Oaxaca Decomposition Results: Outflows from the Labor Force for Unemployed Workers For recovery periods (switching rates from unemployment to out of the labor force ): Occ group 1 group 2 difference explained unexplained Obs. RM ,517 (0.0018) (0.0021) (0.0027) (0.0024) (0.0035) RC ,462 (0.0033) (0.0028) (0.0043) (0.0047) (0.0062) NRM ,903 (0.0036) (0.0034) (0.0049) (0.0048) (0.0067) NRC ,262 (0.0042) (0.0029) (0.0051) (0.0062) (0.0077)
18 Oaxaca Decomposition Results: Inflows from Inactivity For expansions periods (switching rates from out of the labor force into employment): Occ group 1 group 2 difference explained unexplained Obs. RM ,275,911 (0.0001) (0.0001) (0.0001) (0.0000) (0.0001) RC ,275,911 (0.0001) (0.0001) (0.0001) (0.0000) (0.0001) NRM ,275,911 (0.0001) (0.0001) (0.0001) (0.0000) (0.0001) NRC ,275,911 (0.0001) (0.0001) (0.0001) (0.0000) (0.0001)
19 Conclusions The main drivers of the fall in routine manual employment are: 1. A fall in the return job finding rate for unemployed routine manual workers from all demographic groups. 2. An increase in the propensity to leave the labor force for employed and unemployed routine manual workers from all demographic groups, particularly males and married and particularly during recovery phases. 3. A fall in entry rate from NLF towards routine manual employment for all demographic groups, particularly the young. The main driver of the fall in routine cognitive employment is: 1. A fall in the return job finding rate for unemployed routine cognitive workers from all demographic groups.
20 Thank you!
21 Back
22 Back
23 Back
24 Acemoglu, D. and D. Autor (2011), Skills, tasks and technologies: Implications for employment and earnings. Handbook of Labor Economics, 4, Autor, D. and D. Dorn (2009), This job is getting old : Measuring changes in job opportunities using occupational age structure. American Economic Review, 99, Autor, D.H., L.F. Katz, and M.S. Kearney (2006), The Polarization of the US Labor Market. The American Economic Review, 96, Cortes, G.M. (2012), Where have the routine workers gone? a study of polarization using panel data. Technical report, Economics, The University of Manchester. Dustmann, C., J. Ludsteck, and U. Schönberg (2009), Revisiting the German Wage Structure. Quarterly Journal of Economics, 124, Goos, M. and A. Manning (2007), Lousy and lovely jobs: The rising polarization of work in Britain. The Review of Economics and Statistics, 89,
25 Goos, M., A. Manning, and A. Salomons (2009), Job polarization in Europe. American Economic Review, 99, Hall, Robert E (2006), Job loss, job finding and unemployment in the us economy over the past 50 years. In NBER Macroeconomics Annual 2005, Volume 20, , MIT Press. Jaimovich, N. and H.E. Siu (2012), The trend is the cycle: Job polarization and jobless recoveries. Technical report, National Bureau of Economic Research. Shimer, Robert (2012), Reassessing the ins and outs of unemployment. Review of Economic Dynamics, 15,