Urban Transport Modeling (based on these two sources)
|
|
|
- Leo Hubbard
- 5 years ago
- Views:
Transcription
1 Urban Transport Modeling (based on these two sources) A Transportation Modeling Primer May, 1995 Edward A. Beimborn Center for Urban Transportation Studies University of Wisconsin- Milwaukee UTS/primer.htm Modelling Transport: Theory and Practice Frank McCabe, Dublin Transportation Office ct/news/transport/mccabe.ht ml


2 What s in the Black Box? Beimborn, Edward A A Transportation Modeling Primer. Center for UrbanTransportation Studies, University of Wisconsin-Milwaukee: (last accessed 11/14/04).
3 Travel Demand Modeling First developed in the late 1950s Helps make decision on future development of (urban) transport systems Forecasts travel patterns years ahead Model is predictive, but used prescriptively A clear understanding of the modeling process and assumptions is essential to understanding transportation plans.
4 Beimborn, Edward A A Transportation Modeling Primer. Center for UrbanTransportation Studies, University of Wisconsin-Milwaukee: (last accessed 11/14/04).
5 Limitations of Urban Transport Modeling Only considers factors and alternatives explicitly included in the equations. If models are not sensitive to certain factors, they will not show any effect of them. This could lead to a conclusion that the factors are ineffective. E.g., bicycle or pedestrian It is therefore critical to consider the assumptions before decisions are made.
6 How do models fit in the transport planning process? Define problem Define goals and criteria Collect data Forecasting (modeling) Develop alternatives Evaluate Finalize an implementation plan
 Where will the trips go? (trip distribution) What modes will they use? (mode split) What routes will they take?")
7 How is Travel Modeled? 1. What will our community look like in the future? How many people? (population forecasts) What will they do? (economic forecasts) Where will they do it? (land use pattern) 2. What are the travel patterns in the future? How many trips? (trip generation) Where will the trips go? (trip distribution) What modes will they use? (mode split) What routes will they take? (traffic assignment) What will be the effects of this travel? (impact analysis) Beimborn, Edward A A Transportation Modeling Primer. Center for UrbanTransportation Studies, University of Wisconsin-Milwaukee: (last accessed 11/14/04).

8 Population Forecasts Birth rates Death rates Migration rates Ages Often use forecasts from other agencies

9 Economic Forecasts Employment levels Forecasted in conjunction with population Basic employment Economic multipliers used to estimate nonbasic employment Often use forecasts from other agencies

10 Land Use Forecasts Allocate population and economic growth 1. Establish land use goals and land use rates 2. Allocate to specific locations models can be used to predict nonbasic and residential from basic
11 Land Use Forecasting: Limitations No feedback with transportation plans Current development is fixed considers only vacant land Mixed-use benefits not considered
12 Study Area The area within which trip patterns will be significantly affected by the implementation of transport proposals.
13 Aggregate Modeling McCabe, Frank. Modelling Transport: Theory and Practice. Dublin Transportation Office: (last accessed 11/14/04).
14 McCabe, Frank. Modelling Transport: Theory and Practice. Dublin Transportation Office: (last accessed 11/14/04).
15 McCabe, Frank. Modelling Transport: Theory and Practice. Dublin Transportation Office: (last accessed 11/14/04).

16 McCabe, Frank. Modelling Transport: Theory and Practice. Dublin Transportation Office: (last accessed 11/14/04).
17 McCabe, Frank. Modelling Transport: Theory and Practice. Dublin Transportation Office: (last accessed 11/14/04).
18 Trip Generation Done separately for each trip purpose Two main methods: Multiple regression Cross-classification (a.k.a. category analysis)
19 Trip Generation by Multiple Regression, e.g.: Home-to-work trips (R = 0.99) O i = Population Employed Residents Number of Households Num Cars Trips to shopping (R = 0.95) O i = Area Res. Land Number of Cars Light Commercial Vehicle Trips: O i = Number HHs Total Empl Office Empl Industrial Empl
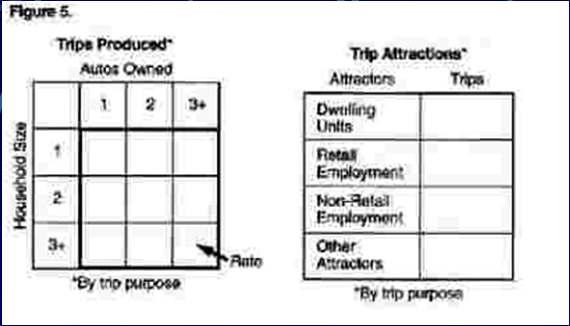
20 Trip Generation by Cross-Classification
21 Advantages Disadvantages Multiple Regression 1. Familiar methodology 2. Statistical significance 3. Estimates effect holding other variables constant 1. Assumes linearity 2. Aggregate data (ecological fallacy) 3. Coefficients not stable over time, or after improvements 4. Multicollinearity Category Analysis 1. Individual data good for predicting individual behavior. 2. Interaction effects 3. Doesn t assume linearity 1. Needs individual data 2. Hard to resurvey individuals for more variables 3. Best with naturally discrete variables.
22 Common Limitation of Trip Generation Models Independent decisions Limited trip purposes Limited independent variables Trip-chaining is ignored Lacks feedback with trip distribution, modal split, traffic assignment McCabe, Frank. Modelling Transport: Theory and Practice. Dublin Transportation Office: (last accessed 11/14/04).
23 McCabe, Frank. Modelling Transport: Theory and Practice. Dublin Transportation Office: (last accessed 11/14/04).
24 McCabe, Frank. Modelling Transport: Theory and Practice. Dublin Transportation Office: (last accessed 11/14/04).
25 McCabe, Frank. Modelling Transport: Theory and Practice. Dublin Transportation Office: (last accessed 11/14/04).
26 McCabe, Frank. Modelling Transport: Theory and Practice. Dublin Transportation Office: (last accessed 11/14/04).

27 McCabe, Frank. Modelling Transport: Theory and Practice. Dublin Transportation Office: (last accessed 11/14/04).
28 McCabe, Frank. Modelling Transport: Theory and Practice. Dublin Transportation Office: (last accessed 11/14/04).
29 Common Limitations of Trip Distribution Models Constant trip lengths (in minutes) into the future Use of car travel times in gravity model denominator Ignores socio-cultural-economic factors for O-D pairs Lacking feedback with trip generation, modal split, network congestion
30 McCabe, Frank. Modelling Transport: Theory and Practice. Dublin Transportation Office: (last accessed 11/14/04).
31 McCabe, Frank. Modelling Transport: Theory and Practice. Dublin Transportation Office: (last accessed 11/14/04).
32 McCabe, Frank. Modelling Transport: Theory and Practice. Dublin Transportation Office: (last accessed 11/14/04).

33 McCabe, Frank. Modelling Transport: Theory and Practice. Dublin Transportation Office: (last accessed 11/14/04).
34 McCabe, Frank. Modelling Transport: Theory and Practice. Dublin Transportation Office: (last accessed 11/14/04).
35 McCabe, Frank. Modelling Transport: Theory and Practice. Dublin Transportation Office: (last accessed 11/14/04).
36 Common Limitations of Modal Split Models Mode choice affected only by time and cost characteristics Omitted factors (amenities, crime, safety, security) have no effect No consideration of ease of walking and comfort of waiting for transit

37 Modal Split Ignores Pedestrian Friendliness Beimborn, Edward A A Transportation Modeling Primer. Center for UrbanTransportation Studies, University of Wisconsin-Milwaukee: (last accessed 11/14/04).
38 Traffic Assignment also known as Network assignment Route assignment Network loading Trip assignment
39 McCabe, Frank. Modelling Transport: Theory and Practice. Dublin Transportation Office: (last accessed 11/14/04).

40 McCabe, Frank. Modelling Transport: Theory and Practice. Dublin Transportation Office: (last accessed 11/14/04).
41 McCabe, Frank. Modelling Transport: Theory and Practice. Dublin Transportation Office: (last accessed 11/14/04).
42 Wardrop Equilibrium "Under equilibrium conditions, traffic arranges itself in congested networks in such a way that no individual trip maker can reduce his path costs by switching routes". All used routes between any Origin / Destination pair have equal and minimum costs, while all unused routes have greater or equal costs."

43 Algorithms A mechanistic iterative procedure with a: Starting rule Iteration rule Stopping rule
44 Wardrop Equilibrium Algorithm Starting rule: set all arc flows to 0, compute all arc costs from cost-flow curve. Iteration (for each O-D pair): Use shortest path algorithm to find the cheapest route for each O-D pair Shift a fraction of the flow from the old route(s) to the new cheapest route. Recalculate the new arc flows and arc costs. Check for convergence: high-cost route low cost route < ε (i.e., tolerance)
45 Common Limitations of Traffic Assignment Models Intersection delay is ignored Travel only on simplified network Intrazonal travel ignored (affects pollution estimates) Capacities are simplified as a function of number of lanes and type of road Model ignores time of day. Peak-hour adjustment factor is critical. Peak spreading is not considered.
46 Final Outputs from Traffic Assignment Amount of travel, congestion, speed per link Total transport cost, time, VMT By applying other coefficients: Accidents Air pollution
47 Improving UTMS Better data Biking and walking Auto occupancy Time of day factors More trip purposes Transit-friendly and bike/walk-friendly design Land use feedback Intersection delays
48 Other Critiques to UTMS Ignores non-transport impacts (energy, neighborhoods, etc.) Sequential 4-step model doesn t always match transport decision-making process. Ecological fallacy (of aggregate data)
49 McCabe, Frank. Modelling Transport: Theory and Practice. Dublin Transportation Office: (last accessed 11/14/04).
50 Disaggregate Methods Parcel-based microsimulation Household Activity Travel Simulation (HATS)