Indonesian Industrialization: Jobless Growth? Haryo Aswicahyono, CSIS, Jakarta Hal Hill, ANU Dionisius Narjoko, ERIA, Jakarta
|
|
|
- Leslie Francis
- 5 years ago
- Views:
Transcription

1 Indonesian Industrialization: Jobless Growth? Haryo Aswicahyono, CSIS, Jakarta Hal Hill, ANU Dionisius Narjoko, ERIA, Jakarta For presentation at 2010 Indonesia Update, September 24-25
2 Contents Introduction East Asian industrialization and poverty reduction Indonesian Industrial Employment The aggregate picture Regional comparisons The Record in Detail Conclusions and Implications
3 Introduction: East Asian industrialization and poverty reduction East Asian economic development two stylized facts : Rapid industrialization Rapid poverty reduction. Are they connected? Yes, through the transformative effects of labour-intensive, exportoriented industrialization, creating millions of jobs. Commencing in Japan, then Asian NIEs, then some of ASEAN, now China. Initially in standardized technology products ( TCF, etc), then increasingly sophisticated products and technologies. Combined with supply-side factors especially education and technology resulted in rising wages and living standards
4 INTRODUCTION (cont) Indonesia a late-comer to this process: late to industrialize, and late to adopt exportoriented industrialization. But starting from the mid 1980s, successful: emerged as a major industrial exporter, and industry became the engine of growth. AFC interrupted this process in three ways: slower economic and employment growth, tighter labour market regulation (Manning), different drivers of growth. Especially affected industrial exports in two main sectors: traditional labour-intensive goods TCF, etc; modern labour-intensive goods global factories, fragmentation trade (Athukorala). Both problems caused by a combination of domestic policy factors and intensified international competition, especially from China.
5 EMPLOYMENT: THE AGGREGATE PICTURE Employment growth is the result of a simple identity: N = Y( N/ Y) ie, the product of output growth and elasticity of employment growth wrt output growth. Two periods: : late Soeharto era, after the reforms, rapid industrialization : between the AFC and GFC, return to (slower) growth. Data: National accounts, labour force surveys, industrial statistics (SI), economic censuses (SE)
6 Sectoral M anufacruring GDP and Emplo ymen t Growth GDP Growth (%) Agriculture Mining and Utilities Manufacturing Construction W holesale T rade Transport Other Activities Employment Gro wth (%) Agriculture Mining and Utilities Manufacturing Construction W holesale T rade Transport Other Activities Implied Outpu t Elasticities Agriculture Mining and Utilities Manufacturing Construction W holesale T rade Transport Source: Other ADB Activities Statistical Database S ystem ( org/ sdbs /index.jsp) OUTPUT GROWTH Slower after the AFC. But not uniform slowdown: agriculture and transport/telecoms faster. Major slowdown in 4 sectors: mining, utilities, manufacturing, construction.manufacturing case is puzzling, harder to explain. Key factors: tradable goods (real exchange rate), greater competition, policy less supportive. EMPLOYMENT GROWTH Slowdown, but less than for output. And in context where labour supply growth also slowing. Major differences between periods: pick up in agriculture and collapse in manufacturing. Technological revolutions in other sectors trade, telecoms, transport.
7 Table 1 (cont) Sectoral M anufacruring GDP and Emplo ymen t Growth GDP Growth (%) Agriculture Mining and Utilities Manufacturing Construction W holesale T rade Transport Other Activities Employment Gro wth (%) Agriculture Mining and Utilities Manufacturing Construction W holesale T rade Transport Other Activities Implied Outpu t Elasticities Agriculture Mining and Utilities Manufacturing Construction W holesale T rade Transport Source: Other ADB Activities Statistical Database S ystem ( org/ sdbs /index.jsp) ELASTICITIES: Agriculture stopped shedding labour. But elsewhere, output growth has become less employment elastic. Elasticities fell sharply for 3 major employers of labour: manufacturing, trade and transport & telecoms. The latter two sectors understandable major technological changes. But not so in manufacturing. Manufacturing sector unique only sector to experience a more than halving of its growth rate and its outputemployment elasticity. A major change in Indonesia s development dynamics: manufacturing had been the fastest growing sector , and the largest sectoral source of employment growth
8 EMPLOYMENT: THE COMPARATIVE PICTURE Manufacruring GDP and Employment Growth GDP Growth (%) Indonesia Malaysia Philippines Thailand Korea Employment Growth (%) Indonesia Malaysia Philippines Thailand Korea Implied Output Elasticities Indonesia Malaysia Philippines Thailand Korea Source: ADB Statistical Database System ( Is this picture unique to Indonesia? pre and post-afc, manufacturing, for selected East Asian countries. Pre-crisis, Indonesia one of the fastest industrializers, output and employment. Post-crisis, output and employment growth slowed sharply. But so did the others. Thailand probably the best comparator: doing better than Indonesia, but not by much. The elasticities declined in all countries. Conclusion: Indonesia rather normal. So for explanations, we need to look at general factors as well as country-specific factors.
9 THE INDONESIAN INDUSTRIALIZATION RECORD IN DETAIL So far, an aggregate picture. What happens when we disaggregate, by sector and size group? What do we expect? Maybe small firms less affected by tighter labour market regulations. Maybe traditional labour-intensive (TCF) grow slower, because exports less competitive. Size: we only get a comprehensive picture of employment every decade, ie, 1986, 1996, 2006, from the SE. See Table 3. L = 100+, M = 20-99, S = Very difficult to enumerate accurately for <5 workers. Quite rapid employment growth, But sharp slowdown Consistent with earlier story.
10
11 Also, major compositional changes. 1986, 1996: L group the major employer. 2006: S group the major employer : L sector stopped hiring; almost no net growth. See Figure 1. But S sector growth held up, accounted for almost all the employment growth. Why? Some possible explanations: a. SME s survived the krismon better. Mixed evidence, no clear picture (Narjoko). b. Firms deliberately stayed small, to avoid the regulatory net (labour, tax, etc). c. Finance hard to get after the AFC; banks tend to prefer the larger firms, considered more safe (Rosengard). d. SME s in sectors that have done better (food products, resource-based, etc). Note also the rise in S share may be an overstatement. Need more research a nice PhD dissertation topic!
12 ln Employment Figure ln Value Added
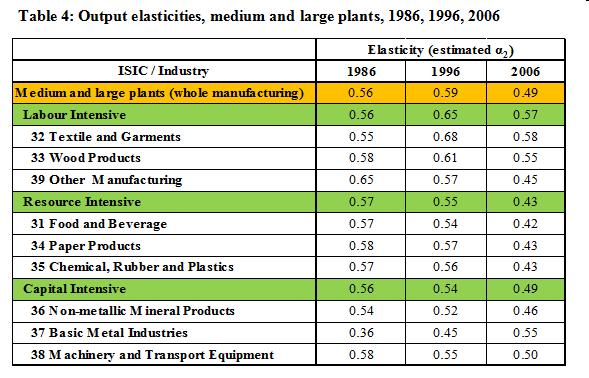
13 A GLIMPSE AT THE QUANTITATIVE ANALYSIS More detailed analysis possible for the L&M firms, have annual SI data. Focusing on how responsive employment has been to output growth. Do for major industry groups, within 3 broad categories labour-intensive, resource-based, and capital-intensive. See Table 4. Interpretation: the higher the figure, the more responsive employment is to output growth. Changes aren t as large; only L&M firms. But employment clearly less responsive It falls the most in labour-intensive industries, especially TCF (after rising in the reform decade, ). Also resource-based; these also generally labourintensive. Less impact as expected in the more capital-intensive industries. The changes occur among both L & M firms, separately estimated.
14
15 QUANTITATIVE ANALYSIS (cont) For S firms, we only have for 1996 and There is some decline in elasticity, but much less than L&M. Moreover, almost no change in the TCF group. We repeat the analysis for wage elasticities, that is the change in employment for a given change in wages. This might be expected to detect the impact of the increased labour market regulation. Results (not presented here) accord with a priori expectations : a stable coefficient. A decade of rapid output and employment growth, limited labour regulation, employment quite responsive to wage changes : a falling coefficient. Decade of slower growth, more regulation, employment less sensitive to wage changes. Labour has become a quasi fixed cost as a result of the regulations. For S sector, , no such pronounced change.
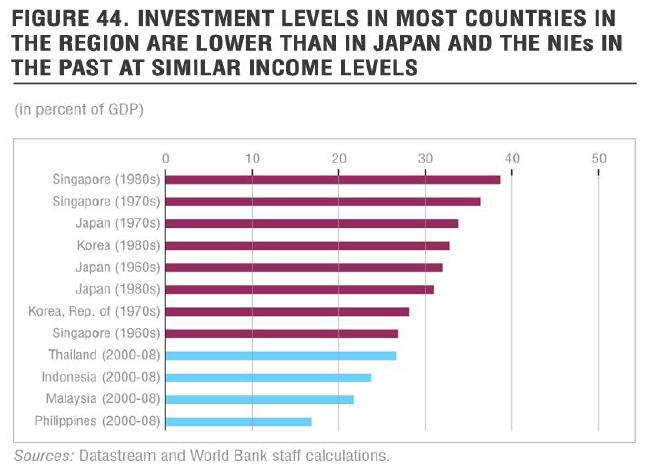
16 SUMMING UP, IMPLICATIONS Have a clear picture of industrial slowdown, and anaemic employment growth among L&M firms. Effects especially marked in labour-intensive sectors (TCF, etc). But S sector seems to be holding up better. Ambiguous interpretation: dynamic SME s, or escape from regulation, finance problems? Indonesia s overall growth slowdown similar to neighbours. Part of general Southeast Asian slowdown since the AFC (except for Vietnam). Investment also slowing down. Eg, compare I/GDP for SE Asia now with high-growth NIEs earlier. Figure 2.
17
18 SUMMING UP, IMPLICATIONS (cont) Do we have to worry, about Indonesia s premature de-industrialization, and loss of industrial employment growth? YES Loss of a dynamic sector creating jobs. Indicative of a competitiveness problem: Indonesia slower to reform, international competition stronger. NO Nothing special about industry; jobs being created elsewhere, in resourcebased sectors, new services. The exchange rate issue is unavoidable, driven by the resource boom since One thing certain: new drivers of the Indonesian economy since the AFC.