The Scale of the Challenge: Employability and Skills in Wolverhampton
|
|
|
- Gordon Ross
- 5 years ago
- Views:
Transcription

1 The Scale of the Challenge: Employability and Skills in Wolverhampton v9
2 Overall health of the economy Commuting patterns (net flows back and forth) Travel to Work Area (TTWA) Job Density Gross Value Added (GVA) and GVA per head Employee Jobs within Wolverhampton
3


4 Travel To Work Area Stafford No Yes Telford and Wrekin Cannock Chase South Staffordshire Lichfield Wolverhampton Walsall Shropshire Sandwell Birmingham Dudley
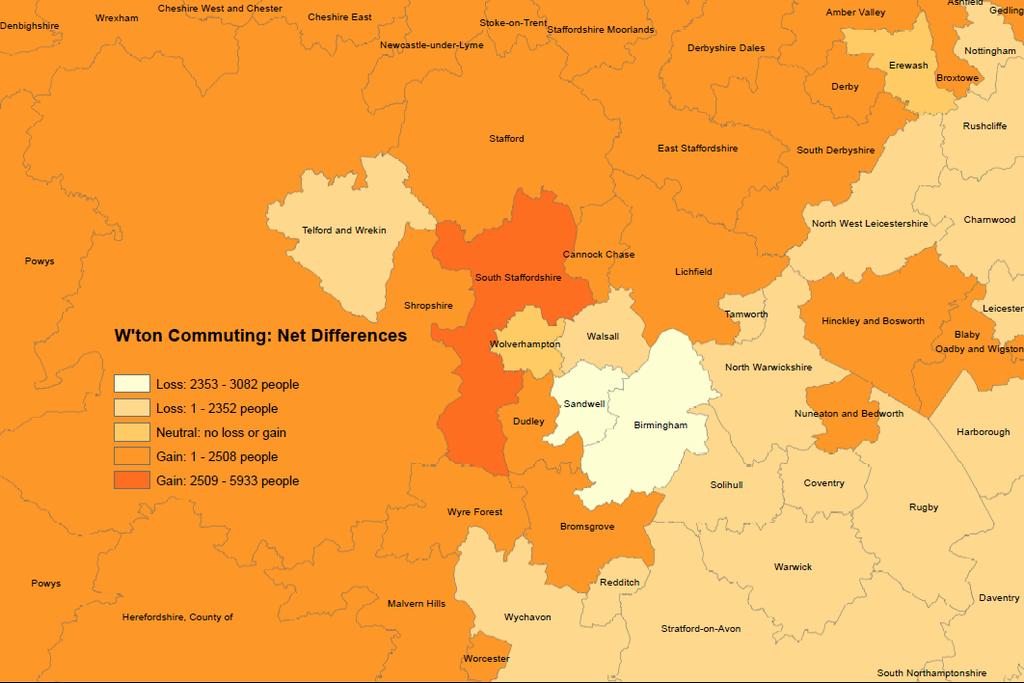
5 Job Density Wolverhampton is a net importer of jobs from elsewhere: there are 3,889 more workers in Wolverhampton local authority's area than Wolverhampton residents with a job in another local authority. Job Density Date Wolverhampton England One way of looking at the jobs in the city is via job density: a job density of 1.0 would mean that there is one job for every resident aged A high job density ratio indicates a local labour market which has many openings for local residents; there are 122,000 total jobs in Wolverhampton, but even if every member of workingage population of the city wanted a job here, there would not be enough jobs to accommodate them all. A job density rate of 0.77 means Wolverhampton is 142 nd of 326 English local authorities on this measure.
6 Gross Value Added (GVA) and GVA per head GVA measures the value of the goods and services produced in an area or sector of the economy. It is primarily used to monitor the performance of the economy, and the overall economic well-being of an area. GVA per head ( ) Date Wolverhampton England Between 2006 and 2013, the GVA for Wolverhampton rose by 744 million; alternatively, the GVA rose by 17.8% for Wolverhampton compared to 22.7% for England. GVA per head for Wolverhampton rose from 17,180 in 2006 to 19,548 in 2013, a 13.8% rise compared to a 16.1% rise in England. GVA per head measures the economic output produced in an area and divides it by the number of residents in that area. Therefore, estimates of GVA per head will be low in areas with significant levels of outward commuting and high resident populations and vice versa.
7 Employee Jobs in Wolverhampton Industry (% of total employees) Wolverhampton England Primary Services (A-B: agriculture and mining) Energy and Water (D-E) Manufacturing (C) Construction (F) Services (G-S) The Services (G-S) group is comprised of: Wholesale and retail, including motor trades (G) Transport storage (H) Accommodation and food services (I) Information and communication (J) Financial and other business services (K-N) Public admin, education and health (O-Q) Other Services (R-S) Wolverhampton has a greater proportion of manufacturing jobs (15,600 total) than England. Data covers employee jobs, not total employment, so it excludes selfemployed, governmentsupported trainees and HM Forces. 108,800 employee jobs in the city in 2013; 68% full-time and 32% part-time.
8 Situation for local residents Working-age (16-64) unemployment 18-24, 25-49, unemployment Qualifications: No Qualifications and Level 4+ NVQ Skills of residents (Skills For Life) Jobs held by residents, their occupations
: 3rd Number to close gap: -254 off JSA to catch next Local")
9 16-64 unemployment Nov 2014 Number unemployed: 7,461 City rate: 4.7% England rate: 1.9% Wton s rank (of 326): 3rd Number to close gap: -254 off JSA to catch next Local Authority

10 18-24 (Youth) unemployment Nov 2014 Number unemployed: 1,750 City rate: 7.2% England rate: 3.1% Wton s rank (of 326): 4th Number to close gap: -18 off JSA to catch next Local Authority
11 Unemployment across the life cycle (November 2014) We monitor youth unemployment, but there are also other age groups affected: Age Band Number unemployed: 4,340 City rate: 5.0% England rate: 2.1% Wton s rank (of 326): 4th Number to close gap: -37 off JSA to catch next Local Authority Age Band Number unemployed: 1,370 City rate: 3.2% England rate: 1.4% Wton s rank (of 326): 9th Number to close gap: -27 off JSA to catch next Local Authority
12

13 Out-of-Work Benefits (OOW) This is JSA + ESA + Lone Parents + Others on income-related benefits May 2014 Number on OOW: 25,930 City rate: 16.3% England rate: 9.8% Wton s rank (of 326): 8th Number to close gap: -653 off OOW benefits to catch next Local Authority
14 2013 Annual Population Survey: Qualifications of residents aged No Qualifications (Ranked 1 st in England) Date Wolverhampton England % 9.1% Wolverhampton s rate of 22.9% of people with no qualifications equals 34,600 people. To match England s rate of 9.1%, we need to reduce the number with no qualifications in the city to 13,823 people, a reduction of 60% from the baseline. This means that 20,777 people of the current no qualifications cohort would need to get a qualification. Level 4+ Qualifications (Ranked 308th in England) Date Wolverhampton England % 35.0% Wolverhampton s rate of 20.0% of people with level 4+ qualifications equals 30,300 people. To match England s rate of 35.0%, we need to increase the number with L4+ qualifications in the city to 52,953 people, an increase of 75% from the baseline. This means that 22,653 people of the current less than level 4 cohort would need to get a degree-equivalent qualification.
15 Skills For Life (2011) estimates, covering % of residents aged with basic skills Literacy Entry Level and Below Level 1 Level 2 + Wolverhampton England Numeracy Entry Level and Below Level 1 Level 2 + Wolverhampton England Adults with skills below Entry Level 3 may not be able to understand price labels on prepackaged food or pay household bills. English not spoken as a first language ESOL Not ESOL Wolverhampton England Entry Level 1: Expected of 5-7 year olds Entry Level 2: Expected of 7-9 year olds Entry Level 3: Expected of 9-11 year olds Level 1: Equivalent to GCSE D-G grades Level 2: Equivalent to GCSE A*-C grades
16 Skills For Life (2011) estimates, covering % of residents aged with basic skills Word- Processing Entry Level and Below Level 1 Level 2 + Wolverhampton England Entry Level and Below Level 1 Level 2 + Wolverhampton England Entry Level Spreadsheets and Below Level 1 Level 2 + Wolverhampton England Performance on the three practical ICT skill areas varied. Of the three practical components, respondents tended to perform at the highest levels on the ing component. Respondents were least likely to achieve a Level 2 or above on the spreadsheet components." Entry Level 1: Expected of 5-7 year olds Entry Level 2: Expected of 7-9 year olds Entry Level 3: Expected of 9-11 year olds Level 1: Equivalent to GCSE D-G grades Level 2: Equivalent to GCSE A*-C grades Please note, England data for these 3 indicators was rounded in the source.
17 NS-SeC Employment Category 1. Higher managerial, administrative and professional occupations 2. Lower managerial, administrative and professional occupations % of W ton residents (16 to 64) % of Eng residents (16 to 64) Example NS-Sec job descriptions Doctor, Lawyer, Dentist, Engineers Teachers, Nurses, Journalists, Actors, Police Sargeant 3. Intermediate occupations Secretaries, fireman, Auxiliary Nurses 4. Small employers and own account workers Self-employed builders, hairdressers, shopkeepers with own shop 5. Lower supervisory and technical occupations Train drivers, Plumber, Supervisors, Foreman, Electrician 6. Semi-routine occupations Shop assistant, security guard, call centre worker, care assistant 7. Routine occupations Bus drivers, Waitresses, Cleaners, Refuse collectors 8. Never worked & long-term unemployed Full-time students W ton Residents: their occupations (Census 2011)
18 Future employment trends Total jobs, by sex, part and full-time, and selfemployment Growing and shrinking employment sectors Projected number of jobs, replacement demand Please note, all the following relates to the Black Country LEP (Local Enterprise Partnership) area, not just Wolverhampton - UKCES Working Futures data
19 Job trends at Black Country LEP Total jobs rise of 21k between 2012 and 2022 a 4.2% rise vs baseline. This compares to a projected 5.9% rise for England (thousands) Employment by Gender FT PT SE Total Male employment Female employment Total employment Total jobs for males forecast to increase by 5k; jobs for females forecast to increase by 16k Full-time jobs for males projected to decrease by 2k; for females, projected rise of 9k 2022 (thousands) Employment by Gender FT PT SE Total Male employment Female employment Total employment FT = Full-Time, PT = Part-Time, SE = Self-Employed Part-time jobs for males projected to increase by 7k; for females, projected rise of 6k Self-employed jobs for males projected to decrease by 1k; for females, static (no change)
20 Sector (% change of workforce) % change between 2012 and 2022 Electricity and gas 16.8 Health and social work 14.7 Professional services 14.4 Real estate 13.8 Other services 13.1 Construction 11.9 Arts and entertainment 8.8 Support services 8.3 Transport and storage 7.3 Information technology 7.1 Water and sewerage 6.0 Finance and insurance 5.6 Wholesale and retail trade 3.4 Accommodation and food 2.4 Food drink and tobacco 1.7 Sector (% change of workforce) % change between 2012 and 2022 Media -1.7 Education -3.0 Rest of manufacturing Engineering Public admin. and defence Mining and quarrying Agriculture Headcount projections about growing and shrinking employment sectors in the Black Country LEP (Local Enterprise Partnership) area between 2012 and 2022
21 Sector (thousands of jobs) Net Change Replacement Demand Total Requirement Health and social work Wholesale and retail trade Support services Construction Education Rest of manufacturing Transport and storage Professional services Accommodation and food The fields with the fastest-growing headcount aren t necessarily those with the most jobs available. The table shows the number of jobs per occupation, net change since 2012 (new openings working in the field through expansion), and the expected replacement demand (the gap left by people leaving the labour force for various reasons such as retirement). Total requirement most in Health and Social Work and Wholesale and retail trade. Support Services includes call centres, admin, cleaning, and recruitment amongst others.
22 Sources used Commuting patterns (net flows back and forth) - Census 2011 Travel to Work Area (TTWA) - ONS Travel To Work Area Job Density - NOMIS Labour Market Profile Gross Value Added (GVA) - ONS Regional GVA, Tables 3.1 & 3.2 Employee Jobs within Wolverhampton - Business Register & Employment Survey Unemployment - Claimant Count Out-of-Work Benefits - DWP Benefits Qualifications: No Qualifications and Level 4+ NVQ - Annual Population Survey Skills of residents - Skills For Life Survey 2011 Jobs held by residents, their occupations - Census 2011 Future employment trends UKCES Working Futures More data is available, in the Unemployment Briefing, and Census tables, including: Occupations by age, sex, ethnicity and disability Economic activity by age, sex, ethnicity, year of arrival Qualifications by age, sex, ethnicity and disability