The Role of Data in Nonprofit Storytelling Strategy? Presenter: Kerri VanMeveren Amazing Traditions, LLC
|
|
|
- Sabrina Baker
- 5 years ago
- Views:
Transcription


1 The Role of Data in Nonprofit Storytelling Strategy? Presenter: Kerri VanMeveren Amazing Traditions, LLC
2 Why Does Data Storytelling matter? Data storytelling is the process of translating data analyses into layman's terms in order to influence a business decision or action.... The idea is to connect the dots between sophisticated data analyses and decision makers, who may not have the ability to interpret the data. Benefits: Connect with your Donors Social media engagement Educate the Community, elected officials and business leaders (ROI) Demonstrate value in the community Stewardship of resources and funding Managing performance of programs

3 HOW DO YOU DETERMINE THE EFFECTIVENESS OF AN ORGANIZATION? Specific, yet anonymous, quotations from our survey can be seen below. We look at what the organization or program intends to achieve and whether or not they do. If they fall short of their objectives, we won t rule them out. We look at the data, analyze the factors that contributed to the results, and determine any changes that can be made. We will work with the organization during this review process and support a revised plan. We look at outcomes, impact as well as what they learned/insights gained. Sometimes a project that fails is a success. We don t consider failure to be bad. Proven capacity to achieve intended outcomes. Site visits and reports from the organization. We think that reports are the best way to determine if the organization is effective its sector, if they achieve their short-term goals, in the financial and beneficiaries, we believe that an organization that can do great things and move forward. Study by: Social Solutions
4 At times it seems that data and storytelling are seen as at odds with one another. Storytelling is exciting. Data is boring. But this need not be the case. Effective use of data should make your story far more compelling. "By offering supporting data, organizations demonstrate their capacity to replicate an individual story on a broader level with others in their target audience, whatever it may be." role in your nonprofit storytelling strategy/

5 Data Shows Accountability Data Discovery- Identifying trends and patterns. How do the trends tie to not just your outcomes but also your needs for the organization? Da ta Dis cov ery Is the business user driven and iterative process of discovering patterns and outliers in data.

6 Context is King- Get comfortable with your data. Can you show key pieces of data that will emphasize your successes? CONTEXT Remember: A single statistic doesn t tell the whole story Last Year This Year This year, we increased the number of individuals we served by 59%!


7 The Human Factor- Creating the narrative for your donors and the community. What action do you want your audience to take upon reading your story?
8 After you ve established an emotional connection through storytelling, use data to show the breadth of not only the problem you re addressing, but also your impact. Show that these things aren t merely isolated to a handful of individuals. A visitor may not be able to picture 100,000 displaced refugees. But if you detail the experience of a single family displaced from their home, then show how widespread the problem is by sharing a figure like 100,000, it can be very moving.
9 How many of you never run out of funding for your programs?
10 How many of you refer clients to other nonprofit agencies?
11 How many of you have reciprocal data sharing agreements to tell your story?
12 Sharing data makes the world a better place That probably sounds like a bold statement, but if every nonprofit shared its data, the baseline of information available would change outcomes for causes and programs all over the world. Everyone would have access to the information he or she truly needs. Sharing information is mutually beneficial, as it allows for: More data analysis and improved standards Decreased costs and time spent on data mining Improved results from targeted programs Better use of funds, time, and resources

13 You Must Tell the Story in Your Data Mapping

14 You Must Tell the Story in Your Data Mapping
15 Why Measure Outcomes? Outcome measurement has become one of the most important activities that social service organizations undertake. There are several compelling reasons to measure outcomes: 1. Measuring the effectiveness of an intervention. How do you know if a program was effective? If a program was not effective, would you want to know so that it could be improved? It is unlikely that we build capacity simply for the sake of building capacity, and because of this, we need to know whether or not our programs are effective, just as the nonprofits we serve need to know if their services are achieving the desired results. 2. Identifying effective practices. With the information you collect, you can determine which activities to continue and build upon. Some practices might be modified and replicated for other programs or initiatives based on your results. 3. Identifying practices that need improvement. Some activities may need to change in order to improve the effectiveness of your program.
16 4. Proving your value to existing and potential funders. The climate for funding social services and capacity building has undergone some radical transformations in the last few decades. Funders are keenly aware of the need to document the success of programs. Capacity building has lagged somewhat behind the social services field in having established evaluation standards. 5. Getting clarity and consensus around the purpose of your program. Everyone in your organization, from board members to service staff to volunteers, should understand what is going on in your program and what it is intended to achieve. Outcome measurement helps to clarify your understanding of your program.
17
18 Data Exercise vsdata labels?rq=excel
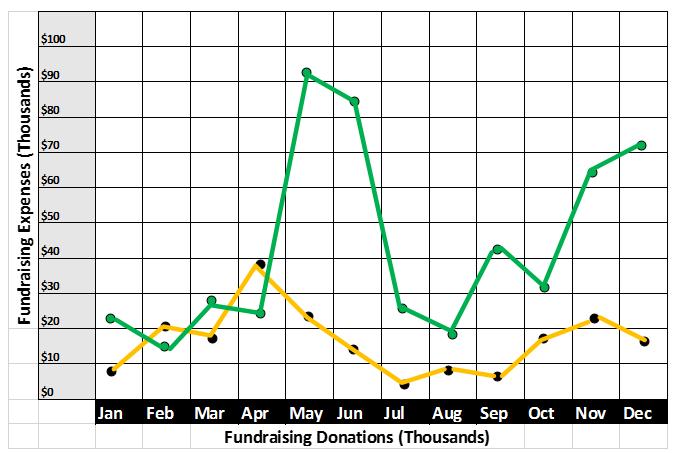
19 Expenses of fundraising Donations Received Thousands Jan Feb Mar Apr May Jun Jul Aug Sep Oct Nov Dec Thousands Jan Feb Mar Apr May Jun Jul Aug Sep Oct Nov Dec
20 Fundraising Expenses (Thousands) $100 $90 $80 $70 $60 $50 $40 $30 $20 $10 $0 Jan Feb Mar Apr May Jun Jul Aug Sep Oct Nov Dec Fundraising Donations (Thousands)
21 Expenses of fundraising Donations Received Thousands Jan $8,000 Jan $21,000 Feb $21,800 Feb $15,000 Mar $19,500 Mar $28,000 Apr $38,000 Apr $24,500 May $23,000 May $92,000 Jun $12,500 Jun $84,000 Jul $4,000 Jul $26,000 Aug $9,500 Aug $19,500 Sep $7,000 Sep $42,000 Oct $18,800 Oct $31,000 Nov $22,500 Nov $64,500 Dec $16,000 Dec $71,000 Total $200,600 Total $518,500 Thousands
22

23 Peer Benchmarking Dashboard for Board Conversations

24 Alternate View for Peer Benchmarking Dashboard for Board Conversations


25 Can your data demonstrate causation verses correlation? And, can they be directly attributed to a specific program or initiative?
26 Requirements Analysis Current State Document existing data resources and capabilities Mapping current objectives to established goals Outline KPI s (key performance indicators) to develop measureable outcomes Identify / Tracking methods for SMART goals (Specific, Measureable, Achievable, Realistic & Time bound) Determine best technological solution based on available data, reporting needs/ requirements and long term strategic vision for future data needs
27 Requirements Analysis Future State At the completion of providing a technology solution to demonstrate program outcomes, the potential for providing qualitative and quantitative data are numerous. Build solution based on approved requirements aligning with your mission and vision Aligning roadmap to your establish goals Ability to create standard and ad hoc reports to provide statistical analysis, forecasting and triggered on specific events including outcome based results Access to data that can improve research, service delivery, volunteer recruitment and donor retention programs
28 OUTCOMES CHECKLIST Are the outcomes related to the core mission of your program? Is it within your control to influence the outcomes? Are your outcomes realistic and attainable? Are your outcomes achievable within the funding and reporting periods? Are your outcomes written as change statements will things increase, decrease, or stay the same? Have you moved beyond client satisfaction in your outcomes? Is there a logical sequence among your short term, intermediate, and long term outcomes? Are there any big leaps in your outcomes, i.e., gaps in the progression of impacts?

29 Is there an active approach to monitoring and evaluation before a program or project has been implemented, enabling ongoing program evaluation for impact?
30 Narrative and data are never as strong apart as they are together. As long as you keep the human element front and center, and the data in a supporting role, there's no reason you can't leverage both to your organization's advantage. role in your nonprofit storytelling strategy/
31 Are you ready to start your strategy for storytelling?