The Traffic Fallacy. UMD PM Symposium May 11, Sean Eddings The Traffic Fallacy - PM Symposium
|
|
|
- Leslie Evans
- 5 years ago
- Views:
Transcription


1 The Traffic Fallacy UMD PM Symposium May 11, 2018 Sean Eddings

2 lcm.io/feedback

3 Sean Eddings Senior Producer & Agile Coach

4 Last Call Media enjoys work with purpose building engaging solutions that assist and support organizations working to improve their communities.
5

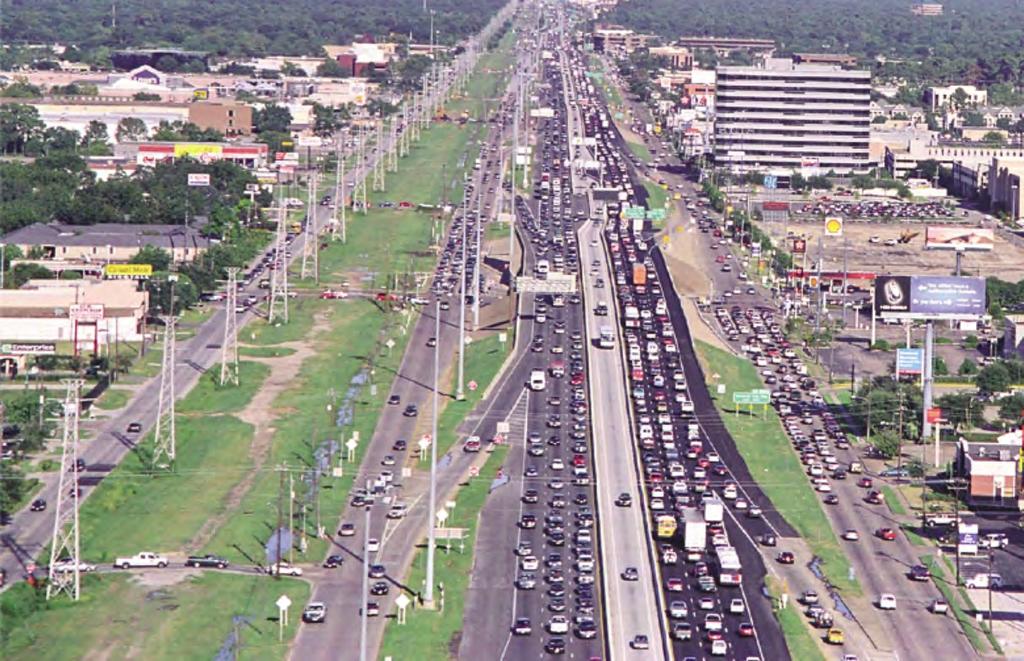
6 Average of 41 min to go 28 miles from downtown Houston to Katyland Google Maps

7

8
9 Direct economic loss: $503,620,000/yr* ++
10 Bottlenecks caused by too many cars on too little road are to blame for about half of all traffic jams. Traffic accidents, work zones, bad weather and poor signal timing account for the rest. - Highways.org

11 Bottlenecks caused by too many cars on too little road are to blame for about half of all traffic jams. Traffic accidents, work zones, bad weather and poor signal timing account for the rest. - Highways.org

12 Conclusion: Too many cars, not enough freeway. Raycom Media

13 Extra capacity would surely solve this problem. - said a reasonable person, probably TribTalk

14 Therefore, build more freeway.
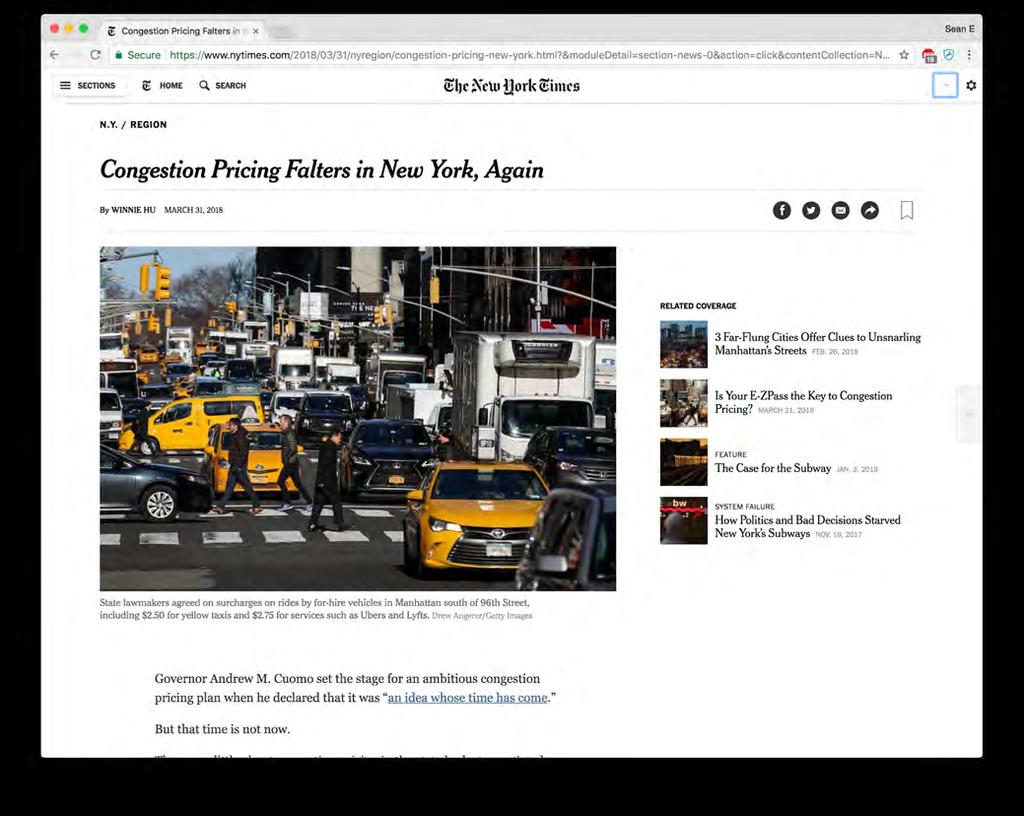
15 So the state of Texas spent more than $2.8 billion to widen the Katy Freeway to 26 lanes.

16 Average travel time increased 55%, from 41 to 64 minutes.
17 As the amount of freeway increased, the number of cars gradually increased too. Ratio of car to freeway remained the same.
18 Peak time Balanced Transportation Analyzer
19 Peak time Balanced Transportation Analyzer

20 50 lane Hong Kong-Macau Expressway
21 Freeway engineers have the best intentions.

22 The real challenge for city streets is to move people, not cars, efficiently. NY Times
23 Despite capacity increases, too many VIP (vehicles in progress) means continued high road utilization, high throughput times, and idling vehicles.
24 There s no freeway-slack to handle vehicle variations.
25 Congested freeways need a VIP limit.

26 New York, NY Flickr - onesevenone
27 NY Times

28 Stockholm, Sweden Wikipedia
29 Average travel time decreased 50%. Emissions dropped by 14-18% in the inner city. IBM
30 What about our freeways How many of us have looked at their backlog and thought, things are taking forever and nothing is getting done!? Then who thought, well maybe we need more people! Who also had team members with >1 thing assigned to them marked as in progress?

31 Everyone was incredibly busy and working hard, yet value was taking too long to get to the customer. NY Times
32 Differences in task variation makes it difficult to provide scheduling predictions, so to maintain a positive customer experience costly, secondary needs were created as tasks waited. This is superfluous work.
33 Here are just a few more tasks... Traditional management literature says people need to be 100% utilized in order to get more things done. Assign work to people! Then manage it! So the goal of project management was to make sure everyone always had a full plate of work assigned to them.


34 Is being busy and delivering value with predictability mutually exclusive?
35 What would it look like if instead of focusing on keeping people busy, we focused on delivering work to the customer as quickly as possible?
36 Goal: Put our good ideas into action quickly.

37 Why?
38 1. Visualize our process 2. Limit our work in progress 3. Improve as a team
39 1. Visualized our process - Helped us see the system as a whole. - Physical board with columns representing work states - High level visibility for team - Bottlenecks become easier to see, for us to either respect or change them as a team - Makes hidden work apparent

40 We started having conversations.
 - How")

41 2. Limit Work in Progress (WIP) - How many things can you really work on at one time?
42 2. Limit Work in Progress (WIP) - How many things can you really work on at one time? - Excessive WIP heightens distraction, decreases concentration, increases task abandonment. - Bottlenecks, again, become clear fast. - Marked WIP Limits on board.
43 2. Limit Work in Progress (WIP) - There s no one right WIP limit for a team, however: - A lower WIP is generally better. - Too-high WIP leaves work idle. - Too-low WIP leaves people idle. - WIP limits are not rules
44 WIP Limit Peak time Balanced Transportation Analyzer
45 Throughput = # of Flow Units x Cycle Time Little s Law
46 Card as a flow unit Card acts as a signal. Signals are in different states. JIRA #: JRA-134 TITLE: Expiring tokens DESCRIPTION: DUE: July 31, 2017 As a VIP user, when I have not logged in for 120-days, my tokens expire, so that I can t be inactive and carry a token balance indefinitely. Common attributes are: - Description of the work item - ID in electronic systems (JIRA, etc) - Deadlines - Who s working on the item - Type of work (bug or normal, for example) - Color
47 Getting started - Take a list of work - Prioritize it based on business value (1, 2, 3,...) - That s a backlog - Teams work from top to bottom - Team self organizes to figure out how to pull the work through the queue
48 A simple board To Do Doing (1) Done JRA-134 JRA-152 JRA-122 JRA-107
49 A simple board To Do Doing (1) Done JRA-152 JRA-134 JRA-122 JRA-107
50 A simple board To Do Doing (1) Done JRA-122 JRA-152 JRA-134 JRA-107
51 What happened? To Do Doing (1) Done JRA-152 JRA-134 JRA-122 JRA-107
52 To Do Analyze (4) Selected for Dev (4) In Progress (4) UAT (5) Ready for Deploy (4) Done CUP-134 CUP-132 CUP-147 CUP-142 CUP-174 CUP-158 CUP-18 CUP-152 CUP-152 CUP-201 CUP-52 CUP-139 CUP-98 CUP-122 CUP-122 CUP-203 CUP-74 CUP-109 CUP-9 CUP-107 CUP-97
53 Attach people to work (Resource efficiency) (Flow efficiency) Team Member Team Member Team Member Team Member Flow Unit Flow Unit Flow Unit Flow Unit
54 Flow efficiency is the sum of value adding activities in relation to throughput time. - This is Lean
55 Flow efficiency = Value-adding activities Throughput time
56 Flow efficiency is about reducing nonvalue adding activities, like flow units waiting.
57 100% resource efficiency Need: As an admin, I want to be able to enable site-wide notifications, so visitors can see important alerts like changes to the schedule. Value-adding time: Time spent with creative and development (8 hours) Time period: From request submitted to being live on production (120 hours) Flow efficiency: 6.6% = 100*(8/120)
58 Shift to flow efficiency Need: As an admin, I want to be able to enable site-wide notifications, so visitors can see important alerts like changes to the schedule. Value-adding time: Time spent with creative and development (8 hours) Time period: From request submitted to being live on production (24 hours) Flow efficiency: 33.3% = 100*(8/24)
59 To Do Analyze (4) Selected for Dev (4) In Progress (4) UAT (5) Ready for Deploy (4) Done CUP-134 CUP-132 CUP-147 CUP-142 CUP-174 CUP-158 CUP-18 CUP-152 CUP-152 CUP-201 CUP-52 CUP-139 CUP-98 CUP-122 CUP-122 CUP-203 CUP-74 CUP-109 CUP-9 CUP-107 CUP-97
60 National Geographic
61 What stayed the same - Multifunctional team - Dedicated team (not on project work) - Queue hygiene - Daily stand ups - Retrospectives What changed - Optimizing for getting a single work unit through the process as quickly as possible. - Team member attached to work - Team members pull work
62 Good to great What about how we work should change and what should stay the same? 1. Set the stage 2. Gather data 3. Generate insights 4. Decide what to do 5. Close the retrospective Agile Retrospectives: Making Good Teams Great by Esther Derby

63 What we learned - Start with what we have (People, tools, space) - Prioritize our work - Visual our process - Limit our WIP - Retrospectives are how we improve as a team - To deliver value to customers faster


64 Agile and Lean, after all, are all about experimentation and learning. Enjoy the trip.
65 lcm.io/feedback The Traffic Fallacy UMD PM Symposium May 11, 2018 Sean Eddings
66 When variation in flow units is low, adding more resources may improve throughput.
67 300,000 Throughput time BEFORE Cars per hour = Amount of road / Cars on the road at any given time. AFTER Cars per hour = Amount of road / Cars on the road at any given time.