Title Subtitle. Mid-Continent Transportation Research Symposium Session 1-D, Asset Management Meeting and Performance Measures I August Date 19, 2015
|
|
|
- Tobias Boone
- 5 years ago
- Views:
Transcription
1 Today s Innovation, Tomorrow s Best Practice: FHWA s Notice of Proposed Rulemaking on System Performance Measures Title Subtitle Mid-Continent Transportation Research Symposium Session 1-D, Asset Management Meeting and Performance Measures I August Date 19, 2015 Office of Transportation Performance Management Francine Shaw Whitson Federal Highway Administration
2 Presentation Outline How did we get here? Transportation Performance Management What s going on today? Where do we hope to go? Today s Innovation, Tomorrow s Best Practice 2
3 How? Evolution of the Federal Program Manage Expand Build Process Review Outcome Performance Project Oversight Today s Innovation, Tomorrow s Best Practice 3
4 How? Past USDOT Performance Reporting Performance Measure Target 2014 Actual Met? Percent NHS Good Pavements Met Percent NHS Structurally Deficient Bridges Met Today s Innovation, Tomorrow s Best Practice 4

5 How? Changing Circumstances Required Us to Embrace Performance Management Infrastructure condition and resource constraints Public expectations Performance management has been proven in other industries Today s Innovation, Tomorrow s Best Practice 5
6 What? MAP-21 Performance Programs under USDOT Highway Safety Programs Federal-aid Highway Programs Public Transportation Programs NHTSA FHWA FTA Today s Innovation, Tomorrow s Best Practice 6

7 What? MAP-21 Background-Performance Elements National Goals Measures Targets Plans Reports Accountability and Transparency Today s Innovation, Tomorrow s Best Practice 7
8 What? MAP-21 National Goals Transportation Performance Management Goal Area National Goal Safety Reduce fatalities & serious injuries on all public roads Infrastructure condition Congestion reduction System reliability Freight movement & economic vitality Environmental sustainability Reduced project delivery delays Maintain a state of good repair Significantly reduce congestion on the NHS Improve the efficiency of the surface system Improve the national freight network, access of rural communities to markets, & economic development Enhance system performance while protecting and enhancing the environment Accelerate project completion by eliminating delays in the project delivery process 8 Today s Innovation, Tomorrow s Best Practice 1010
9 What? Challenges and Opportunities Transportation Performance Management Providing both consistency and flexibility Finding the right balance of national measures Managing performance across jurisdictions Data requirements and management Linking performance measures to investments Advancing technologies Progress Today s Innovation, Tomorrow s Best Practice 9
10 What? Principles Behind Proposals Transportation Performance Management Minimize the Number of Measures Phase in Requirements Increase Accountability and Transparency Consider Risk Understand that Priorities Differ Recognize Fiscal Constraints Today s Innovation, Tomorrow s Best Practice 10
11 What? Rulemaking Process Safety Performance Measures Highway Safety Improvement Program Statewide and Metro Planning; Non-Metro Planning Transportation Performance Management Area NPRM Comments Anticipated Final Rule March 11, 2014 Closed June 30, 2014 November 2015 March 28, 2014 Closed June 30, 2014 October 2015 June 2, 2014 Closed Oct. 2, 2014 November 2015 Pavement and Bridge Performance Measures Highway Asset Management Plan System Performance Measures Jan. 5, 2015 Closed May 8, 2015 n/a Feb. 20, 2015 Closed May 29, 2015 n/a Projected November days n/a Today s Innovation, Tomorrow s Best Practice 11
12 What? Proposed Measures Safety Performance (4) Number of fatalities Rate of fatalities Number of serious injuries Transportation Performance Management Rate of serious injuries Pavement and Bridge (6) Percentage of pavements of the Interstate System in Good condition Percentage of pavements of the Interstate System in Poor condition Percentage of pavements of the non-interstate NHS in Good condition Percentage of pavements of the non-interstate NHS in Poor condition Percentage of NHS bridges classified as in Good condition Percentage of NHS bridges classified as in Poor condition Today s Innovation, Tomorrow s Best Practice 12
13 What? Proposed Reporting Requirements Safety State DOTs establish and report targets and progress in the annual HSIP report MPO report to State DOTs annually and report on progress in their System Performance Report as part of their transportation plan Pavement and Bridge Baseline Performance Period Report two- & four-year targets, baseline conditions, relationship with other performance expectations Mid Performance Period Progress Report two-year condition/ performance, investment strategy effectiveness, progress discussion, target adjustment*, extenuating circumstances*, target achievement discussion if fail to demonstrate significant progress (* = optional) Full Performance Period Report Same content as Mid Period report but reporting on four year targets MPOs report targets and progress to State DOTs per the Metropolitan Planning Agreement Today s Innovation, Tomorrow s Best Practice 13
14 What? Proposed Target Setting Safety State DOTs shall establish targets annually for each performance measure identified Be identical to the targets established by the SHSO for common performance measures. Represent performance outcomes anticipated for the calendar year following the HSIP annual report date. Represent the anticipated performance outcome for all public roadways within the State regardless of ownership or functional class. Reported in the HSIP annual report that is due after one year from the effective date of this rule and in each subsequent HSIP annual report thereafter Include in the HSIP Report 10 years of serious injury data. Unless approved by FHWA, State DOTs shall not change their target once it is submitted in the HSIP annual report. Today s Innovation, Tomorrow s Best Practice 14
15 What? Proposed Target Setting Pavement and Bridge All State DOTs and MPOs establish targets for each performance measure, aligned with biennial reports Targets to be established for the entire NHS network, regardless of ownership State DOTs may adjust four-year targets at the performance period midpoint State targets are statewide State DOTs have the option to set additional urbanized/non-urbanized targets MPOs establish four-year targets by committing to support the State target or by setting a quantifiable target when applicable If State adjusts target, any MPO adjustments must occur within 180 days If MPO changes a quantifiable target, must be done in a manner agreed upon and documented in Metropolitan Planning Agreement Today s Innovation, Tomorrow s Best Practice 15
16 What? Proposed Data Requirements Safety Data taken from the Fatality Analysis Reporting System (FARS) Data taken from the State motor vehicle crash database Exposure data for the serious injury and fatality rate measures are calculated per 100 million VMT as reported in the HPMS. Serious injuries shall be coded (A) in the KABCO injury classification scale through the use of the NHTSA serious injuries conversion tables. Within 18 months of the effective date of the final rule, serious injuries must be determined using the latest edition of MMUCC Today s Innovation, Tomorrow s Best Practice 16
17 What? Proposed Data Requirements Pavement and Bridge Pavement data provided to the Highway Performance Monitoring System (HPMS), 0.1 mile uniform pavement sections Bridge data provided to the National Bridge Inventory (NBI) Pavement metrics are IRI, cracking, rutting and faulting with thresholds corresponding to Good/Fair/Poor Bridge metrics are condition of deck, superstructure and substructure (or culvert) with Good/Fair/Poor thresholds Measures are % lane miles Good/Poor, and % deck area Good/Poor Today s Innovation, Tomorrow s Best Practice 17
18 Where? Better Outcomes! Transportation Performance Management Improved communication of the link between investments and results Depict future scenarios under varying funding levels Increased consistency across the country Increased coordination across agencies and jurisdictions Greater understanding of what works Today s Innovation, Tomorrow s Best Practice 18
19 Where? Improved Measures of Performance Synergies between National and other measures used by agencies Further refinement of the National measures Spur discussions on the value of future areas for performance management Improved data collection, integration, mining, reporting, and visualization Today s Innovation, Tomorrow s Best Practice 19


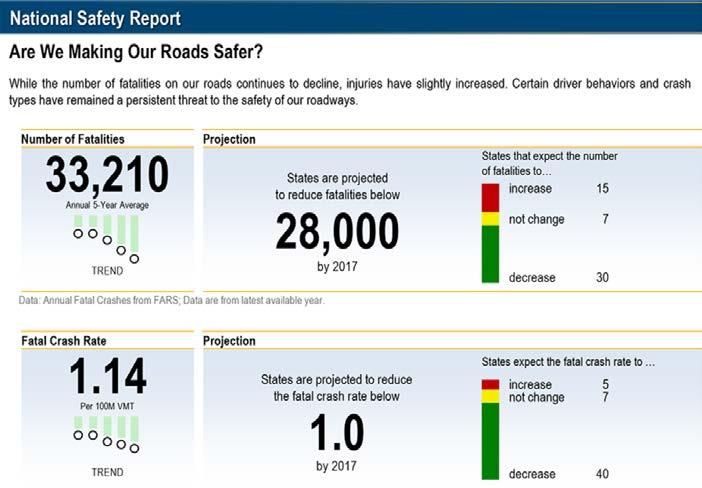
20 Infographics Transportation Performance Management Where? Communicating Transportation Performance Performance Reports Today s Innovation, Tomorrow s Best Practice 20

21 Where? Communicating Transportation Performance Today s Innovation, Tomorrow s Best Practice 21

22 Thank You Today s Innovation, Tomorrow s Best Practice 22