We help build companies of the future
|
|
|
- Rudolph O’Neal’
- 5 years ago
- Views:
Transcription

1 March 2018 Investor Presentation We help build companies of the future By Pat Goepel
2 SAFE HARBOR STATEMENT (Under the Private Securities Litigation Reform Act of 1995) Statements made in this presentation regarding Asure s business which are not historical facts are "forwardlooking statements" within the meaning of Section 27A of the Securities Act of 1933 and Section 21E of the Securities Exchange Act of 1934 that involve risks and uncertainties. Such risks and uncertainties could cause actual results to differ materially from those contained in the forward-looking statements. The risks and uncertainties include but are not limited to adverse changes in the economy, financial markets, and credit markets; delays or reductions in information technology spending; the development of the market for cloud based workplace applications; product development; market acceptance of new products and product improvements; our ability to retain or increase our customer base; security breaches; errors, disruptions or delays in our services; privacy concerns; changes in the our sales cycle; competition, including pricing pressures, entry of new competitors, and new technologies; intellectual property enforcement and litigation; our ability to hire, retain and motivate employees; our ability to manage our growth; our ability to realize benefits from acquisitions; changes in sales may not be immediately reflected in our operating results due to our subscription model; changes in laws and regulations; and changes in accounting standards. 2

3 ASURE OVERVIEW 3


 2017 REVENUE")


4 ASURE SOFTWARE AT-A-GLANCE FOUNDED 1985 RE-INVENTED 2016 OWNERSHIP PUBLICLY TRADED : ASUR 2016 REVENUE ~ $35.5M (+32%) 2017 REVENUE GUIDANCE $54.25M - $56.25M EMPLOYEES CLIENTS & GROWING 12,400 DIRECT 90,600 INDIRECT CORPORATE HEADQUARTERS Austin, TX Offices in WA, OR, CA, TX, FL, TN, NC, MI, MA, VT, OH, UK Presence in 80 countries

5 WHAT WE DO A leading provider of Human Capital Management (HCM) and Workplace management software Asure has created a new category that links traditional HCM with workspace solutions via innovative, cutting-edge technology We help build companies of the future. Our cloud platform helps organizations to better manage the people and space for a mobile, digital, multi-generational, global organization 5
6 INVESTMENT MERITS Human Capital Management is a very attractive market Large market opportunity (~$13B) with above average growth (8.2%) Long-term customer relationships Highly predictable, recurring revenues Lack of customer concentration and low economic sensitivity Ability to cross sell add-on products Conversion to SaaS based solutions is largely complete Acquisition of Mangrove Software gives Asure a full HCM solution SaaS-based product revenues represented 71% of revenues in 2017 (vs. 58% in 2016) Accelerating Growth Cloud bookings increased 232% year-over-year (Q3-17 vs. Q3-16) Sales pipeline increased 33% sequentially (Q3-17 vs. Q2-17) Backlog increased 12% sequentially to $20.2 million (Q3-17 vs. Q2-17) Experienced Management Team 6

7 7 MARKET OPPORTUNITY


8 WORLDWIDE MARKET 44% of the HCM Market is wide-open 22% of respondents who had an HCM Solution were in a replacement cycle in Of those, one-third were planning to move to a cloud solution.* SAP- 11% Workday - 9% HCM Applications Market Size & Growth in Billions $15.4 Ultimate Software - 7% CAGR: 8.2% $10.4 $11.3 $12.2 $5.5 Other - 44% Oracle - 6% Talent Acquisition Workforce Management $3.6 $1.6 $3.9 $1.7 $4.3 $1.8 $2.3 ADP - 4% Core HR $5.2 $5.7 $6.1 $ *Source: Sierra-Cedar research 8
9 Installed Workloads in Millions POISED FOR GROWTH 180 Saas (33% CAGR) 24% CAGR 160 IaaS (13% CAGR) 140 PaaS (21% CAGR) Cloud Services Adoption will Continue SaaS Most High Deployed Global Cloud Service by *Source: Cisco Global Cloud Index,

10 10 MARKET DRIVERS

11 GLOBAL MACRO TRENDS FUELING THE WORKPLACE OF THE FUTURE THE WAY PEOPLE WORK TODAY HAS CHANGED THE FUTURE IS HERE. 11


12 HCM TREND: NEW GAME - NEW RULES HR LEADERS ARE BEING PRESSED TO REWRITE THE RULES FOR HOW THEY ORGANIZE, RECRUIT, DEVELOP, MANAGE, AND ENGAGE TODAYS WORKFORCE. Leverage digital technology to design and improve work, the workplace, and the workforce Build a culture of continuous learning, adaptability, growth, and personal development Design the employee experience for engagement, productivity, and growth Leverage data, cognitive technologies, and AI to improve the organization and its teams *Source: Deloitte University Press

13 HCM TREND: NEW GAME - NEW RULES HUMAN CAPITAL MANAGEMENT SOFTWARE NUTURES EMPLOYEE ENGAGEMENT Stages of Employee Lifecycle and HCM Technologies Talent acquisition Employee Services Retention Succession Applicant Tracking System Recruitment marketing Onboarding Benefits Payroll Time & attendance HRIS PTO Compensation Learning & development Performance management Collaboration Rewards Workforce planning Metrics *Source: Deloitte University Press
14 DISPARATE FIELD OF SOLUTIONS HELPING BUILD COMPANIES OF THE FUTURE HCM TALENT MANAGEMENT BUSINESS INTELLIGENCE MOBILE TIME TRACKING PAYROLL & TAX RECRUITMENT BENEFITS SELF SERVICE HR CONSULTING ASURE SOFTWARE SPACE MANAGEMENT HOTELING HOT DESKING ROOM BOOKING MOBILE SCHEDULING ASSET MANAGEMENT MOVE MANAGEMENT VIDEO CONFERENCING 14 14


15 CLIENT PORTFOLIO & CROSS SELL OPPORTUNITY Time & Labor Management Workspace Management Human Capital Management Healthcare Banking Financial Education Gov t/ Non-Profit 15

16 FINANCIALS


17 2018 Acquisitions January 1, 2018 TelePayroll has provided payroll, human capital management and benefits services to employers on the West Coast. TelePayroll s model includes dedicated customer support and deep payroll and tax expertise, powered by Asure Software s industry leading HRIS platform, Evolution. Savers Admin is an SSAE certified third party administrator (TPA) specializing in customized products and services for companies of all sizes, expanding our reach to the eastcoast. Sheakley PaySystems will help solidify Asure s expansion in the central US. Asure will be able to deliver our expanded employee engagement solutions to Sheakley PaySystems current customers by offering access to Asure s complete suite of solutions for the modern workforce 17 17
18 SELECTED FINANCIAL DATA TICKER ASUR Q3 YTD 2017 PRICE 3/7/18 $15.22 Q3 YTD 2016 Q3 YTD 2015 in 000s Cash $27,464 $12,767 $1,158 Total Current Assets $67,248 $45,599 $7,685 Total Assets $182,337 $85,823 $33,817 Total Current Liability $48,514 $41,392 $16,278 Total Liability $117,953 $67,577 $30,099 Total Equity $64,384 $18,246 $3,718 Revenue $39,134 $25,826 $20,145 EBITDA $4,256 $3,258 $2,689 EBITDA excluding one times $7,922 $5,306 $3,125 See GAAP reconciliation in the Appendix 52 WEEK HIGH $17.27 OUTSTANDING SHARES 1/5/18 MARKET CAPITALIZATION 1/5/18 AVG. DAILY VOLUME 90 day 52 WEEK LOW $ M $191.8M 110K MANAGEMENT HOLDINGS 5.25% CEO CHAIRMAN OF THE BOARD 7.66% 18

19 SELECTED FINANCIAL DATA 19
20 FINANCIAL OUTLOOK EBITDA excluding one-times TOTAL REVENUE NET INCOME/LOSS NET INCOME/LOSS BREAK EVEN 2016 REVENUE $35.5M Q Q Q Q REVENUE GUIDANCE $54.25M - $56.25M Q Q Q REVENUE GUIDANCE Q $78M - $81M FY _ 2016 EBITDA EXCLUDING ONE-TIMES* $7.5M 2017 EBITDA GUIDANCE EXCLUDING ONE-TIMES * $12.2M- $13.5M 2018 EBITDA GUIDANCE EXCLUDING ONE-TIMES * $18M - $20M 20 * See GAAP reconciliation in the Appendix

21 NET OPERATING LOSS (NOL) $115M+ in Federal Net Operating loss (NOL) Carryforwards EXPIRING NOL AMOUNTS 12/31/ ,996,443 12/31/ ,518 12/31/ ,219,901 12/31/2021 4,507,944 12/31/ /31/ ,831,960 12/31/2024 8,448,684 12/31/2025 3,806,478 12/31/2026 2,453,227 12/31/2027 3,299,138 12/31/ ,455,633 12/31/2029 1,763,203 12/31/2030 5,004,052 12/31/ ,015 12/31/ ,204 12/31/ ,732 12/31/ ,966 21
22 22 APPENDIX
23 *Non-GAAP Financial Measures This presentation includes the following financial measures defined as non-gaap financial measures by the Securities and Exchange Commission: EBITDA and GAAP Net Income/(Loss) excluding one-time expenses. These supplemental financial measures are not required by GAAP, nor is the presentation of this financial information intended to be considered in isolation or as a substitute for the financial information prepared and presented in accordance with GAAP. Management recognizes that non-gaap financial measures have limitations in that they do not reflect all of the expenses associated with Asure s earnings results as determined in accordance with GAAP. However, for the reasons described below, management uses these non-gaap measures to evaluate the performance of Asure s business. Asure s management believes that it is important to provide investors with these same tools, together with reconciliation to GAAP, for evaluating the performance of Asure s business, as it may provide additional insight into Asure s financial results. See the Reconciliation of GAAP Net Income/(Loss) to Net Income/(Loss) Before Interest, Taxes, Depreciation, Amortization and Stock Compensation Expense (EBITDA) and the Reconciliation of GAAP Net Income/(Loss) to Net Income (Loss) Excluding One-Time Expenses tables included in this presentation for further information regarding these non-gaap financial measures. In addition, these measures are presented because management believes they are frequently used by securities analysts, investors and others in the evaluation of companies. EBITDA is calculated by adding income taxes, interest expense, depreciation and amortization and stock compensation expense to net earnings. EBITDA is not defined under GAAP and should not be considered in isolation or as a substitute for net earnings and other consolidated earnings data prepared in accordance with GAAP or as a measure of Asure s profitability. Net Income/(Loss) Excluding One-Time Expenses is calculated by combining the company s GAAP Net Income/(Loss), or earnings per share, with expenses that management believes are one time in nature and are not expected to recur on a dollar or per share basis. Non-GAAP Net Income/(Loss) is calculated by combining the company s GAAP Net Income/(Loss), or earnings per share, with items that are one time in nature and are not expected to recur on a dollar or per share basis. It excludes the impact of purchase accounting adjustments, amortization expense on acquisition-related intangible assets, stock-based compensation expense, and acquisition-related expenses. We have revised our non-gaap Net Income/(Loss) to include acquisition-related amortization, as we believe this will more accurately reflect how we analyze our operations and provide information needed by investors to gain additional insight into our financial results. These expenses have been included in the non-gaap Net Income/(Loss) for all periods presented
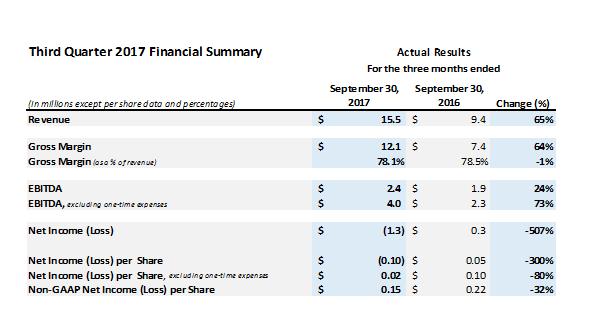
24 Reconciliation of GAAP Net Income (Loss) to Net Income (Loss) Before Interest, Taxes, Depreciation, Amortization and Stock Compensation Expense (EBITDA) and EBITDA Excluding One-time Expenses $000s YTD December 31, 2016 YTD December 31, 2015 Net Loss $ (972) $ (1,757) Interest and amortization of Original Issue Discount 1,917 1,117 Tax Depreciation Amortization 2,678 2,291 Stock Compensation EBITDA 4,973 3,000 One-time expenses 2, EBITDA excluding one-time expenses $ 7,523 $ 3,734 Three Months Ended September 30, 2017 Three Months Ended September 30, 2016 $000s Net Income (Loss) $ (1,281) $ 315 Interest 1, Tax Depreciation Amortization 1, Stock Compensation EBITDA 2,387 1,931 One-time expenses 1, EBITDA excluding one-time expenses $ 3,969 $ 2,296 Nine Months Ended September 30, 2017 Nine Months Ended September 30, 2016 $ (4,177) $ (1,103) 3,358 1, ,549 1, ,256 3,258 3,666 2,048 $ 7,922 $ 5,
25 ASURE VALUE COMPARES CSOD Q2 6/30/17 WDAY Q2 7/31/17 ULTI Q3 9/30/17 PCTY Q1 9/30/17 ASUR Q3 9/30/17 Revenue (in 000 s) $116,651 $525,320 $236,113 $81,500 $15,527 Net Income (Loss) (in 000 s) $(21,265) $(82,532) $4,697 $543 $(1,281) ENT Value $2.12B $21.46B $5.8B $2.5B $188.76M YOY Revenue Growth 9% 41% 20% 25% 65% Launching Asure into a new and much larger market. The rise of total workforce management and agile work environment initiatives are taking center stage for company leaders. The HCM market has a market cap in the billions and growing at a 9%+ CAGR with 22% of the market actively looking for new functionality. 25
26