Learning from the Present & Past. An Industry Need and Supporting Resources
|
|
|
- Jonah Singleton
- 5 years ago
- Views:
Transcription
1 Learning from the Present & Past An Industry Need and Supporting Resources Martin W. McCann, Jr. Stanford University Patrick Regan Risk-Informed Decision Making Group Federal Energy Regulatory Commission March 13,
2 Introduction Historical Background Today s Dynamic Environment in Dam Safety Improving / Expanding Our View of Dams as Dynamic Systems Perspective on Dam Performance Development of New NPDP Online Resources Vision for Characterizing and Preserving (electronically) Information on Dam Performance Final Thoughts 2
3 Historical Background When dam engineers began collecting lists of dam failures and incidents, they were happy to just take names (so to speak) (1940s to the now). Identify the events, summarize the information with simple characterizations (one word (piping), a numeric code (3.1.2), or categories (Accident Type 2)). This was true when the National Performance of Dams Program (NPDP) started. However, dam safety and engineering is changing. Our needs to better understand how dam systems perform is evolving. 3
4 Today s Dynamic Environment PFMAs Ongoing & evolving (aka on the learning curve); new data & perspectives Risk Analysis Evolving in a regulatory and business sense Systems Engineering Evolving perspective; technical, management, operations, etc. Field Experience Ongoing - real-life lessons on successes & failures Deregulation Changes in the business climate and attitudes towards risk management Business Side Asset Management & the inter-relationship with dam safety Regulatory Change Stricter standards-based approaches; risk-informed approaches 4
5 Where are the Needs? Dam Safety The forgoing list of activities and factors effecting the hydro industry is changing/expanding our vision of we look at dams and evaluate dam safety. We are moving to a risk-informed, systems-based way of how we look at dams and how they will perform in the future. Asset Management The notion of good stewardship of a critical (lifeline) infrastructure is changing. Fiduciary responsibility Community citizenship (supporting community resilience) Reliability of services (water and power) Good asset management (good business) is good dam safety 5
6 Our Focus Today We want to take advantage of two key and inter-related pieces of information: The results of PFMAs (in general, and specifically those conducted for hydropower projects regulated by the FERC), National Performance of Dams Program (NPDP) datasets (U.S. only-so far), and Work by ICOLD, USSCOLD (now USSD), Fell and others, etc. (international dam incidents) How can we leverage these resources to: Support asset management, Support dam safety evaluations, Improve our efficiency, and Support intelligent, risk-informed decision-making 6
7 Perspectives on Dam Performance 7
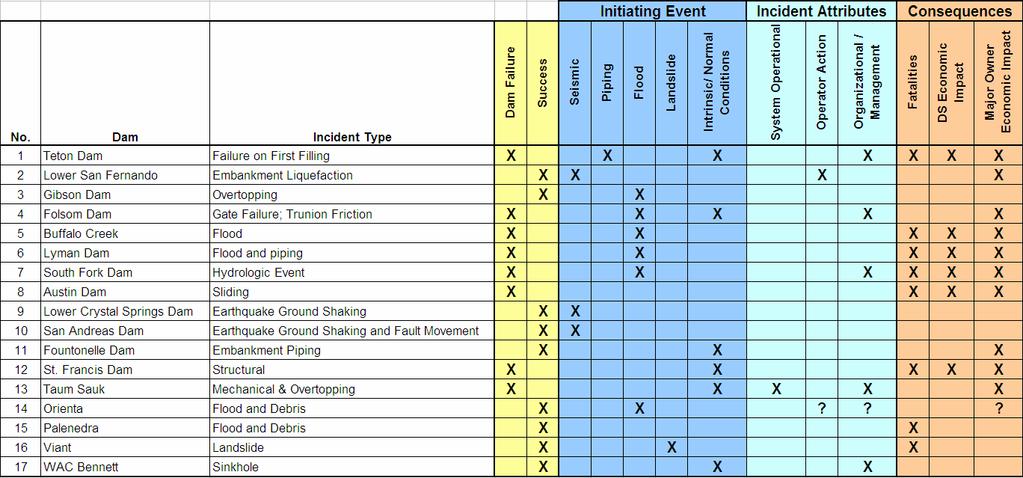
8 Dam Performance When we think of Dam Incidents, there has been in the past and generally there continues to be a focus on events involving unsatisfactory performance. Our perspective on this has been quite different. We view dam incidents in a much broader sense: Dam incidents are events of engineering and safety interest that provide insight into the structural and functional integrity of dam systems and their operation. From this perspective, we are as (more) interested in success than we are failure or other levels of unsatisfactory performance. 8
9 Consider the Seismic Safety of Dams Following the 1971 San Fernando earthquake, there has been a tremendous focus on the evaluation and remediation of dams; particularly embankments. This is still true today. In about the last ten years alone in California, BC Hydro alone about $1.1 billion has been spent on seismic remediation of dams. Add Saluda and the number jumps to $1.3 billion. Historically, dams (thousands of them) have performed well during earthquakes! The obvious question is are we spending our dam safety/infrastructure resources in the right places for the right reasons. 9
10 Leveraging Success Are we learning from and leveraging our successes? It seems the answer is not really. The conventional notion of dam incidents leads us to focus on negative performance failure; uncontrolled release of the reservoir; unsatisfactory performance, etc. Successes are almost taken for granted. How does success fit in? Knowledge of and data on successes provides balance, perspective, and for the statistician in us a means to understand the sample space and estimate rates/probabilities. Success comes in many different forms: PURE success, and Success buried in the midst of events 10
11 Looking at Success Events that occur at a dam typically of combination of factors that: Are causally related (one thing occurs and it leads to something else happening as a result), and/or Occur coincidently (proverbial bad luck - the earthquake occurred when the reservoir was at its highest level) This is true for failures and successes A PURE success might be an event such as The PMF occurred and everything worked as designed, no damage at the project. Buried Success(es) An event is a combination of successes and failures (unsatisfactory performance); aka - event tree sequence. 11
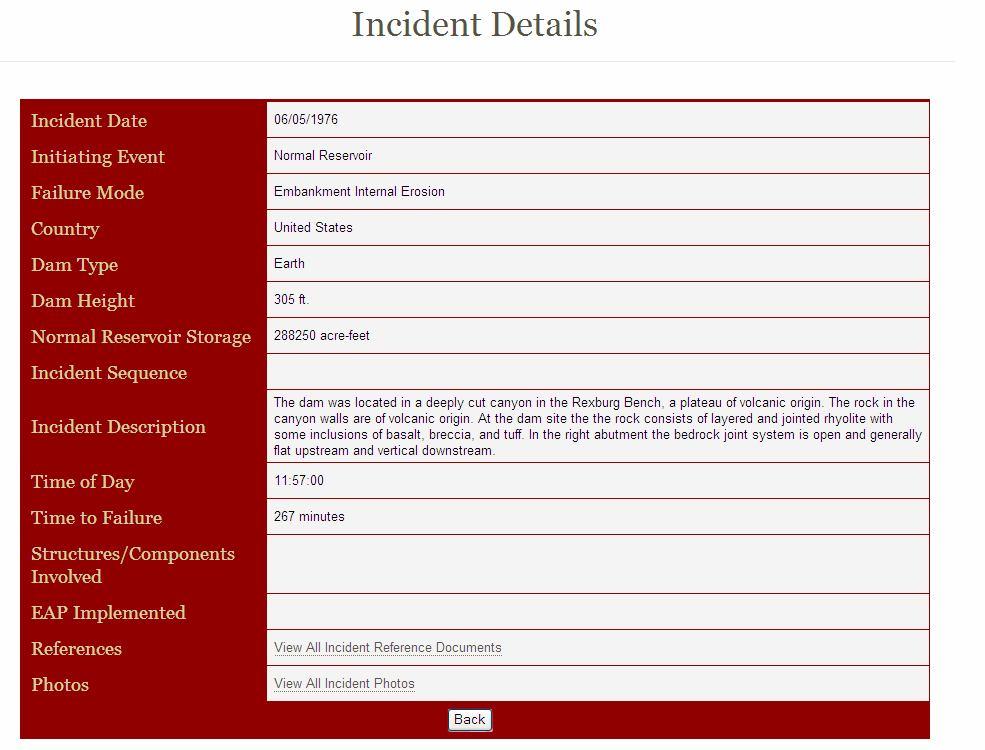
12 Success Story Example 1971 Performance and Survival of the Lower San Fernando Dam This event had a multitude of events/elements that contributed to the outcome that was realized. 12


13 Success Story Example 13
14 (Idriss and Gutierrez, 2009) 14
15 Success Story Example Consider these events/factors: A downstream berm is added to the embankment (reasons unknown), and DSOD restricts the reservoir level due to seismic safety concerns, and The restrictions are lifted, and The winter is dry so the reservoir level remains low, and It is winter and the water is locked as snow in the mountains, and Earthquake occurs, and Significant embankment slide/failure due to liquefaction, and An intake fails, and The other intake survives, and Seepage/piping does not occur, and Aftershocks do not lead to subsequent damage and breaching, and The reservoir is lowered in a timely manner and uncontrolled release is averted. 15
16 Lessons from Success Where and how can success experiences be documented and the lessons taken advantage of? There are a number of examples where performance experience (successes and unsatisfactory performance) information can be gathered to support quantitative estimates of reliability, fragility, etc. 16
17 Development of New NPDP Online Resources 17
18 Data Resources We looking at ways to: Leverage our evaluation and field experiences Support engineering and dam safety evaluations Utilize world-wide experience There are a number of data resources we can utilize. FERC licensee mandated PFMAs for hydropower projects NPDP dam incident database International dam incident database (ICOLD, etc.) 18
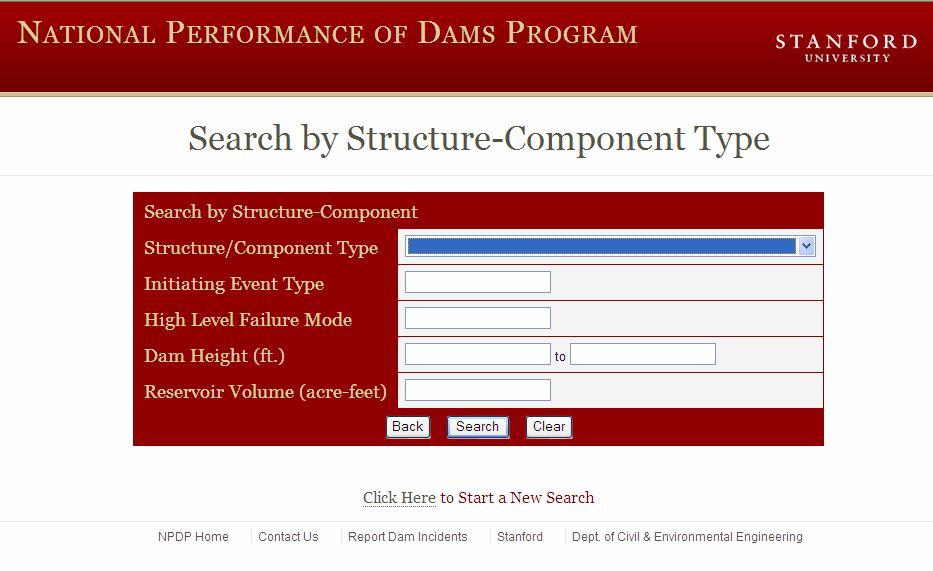
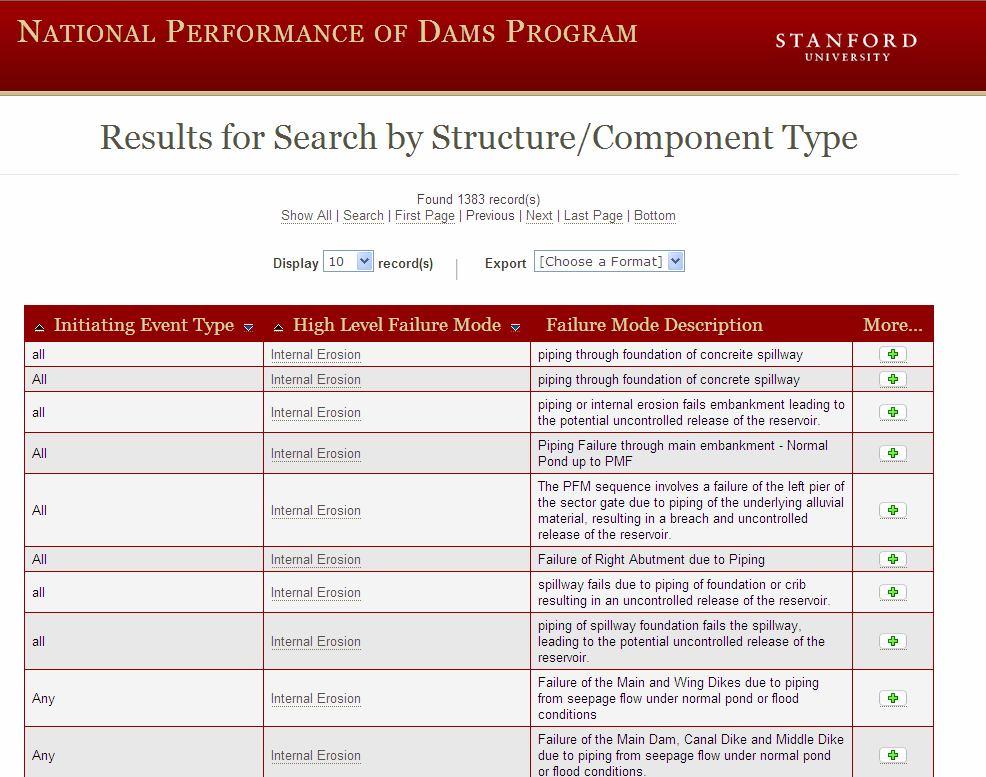
19 FERC Potential Failure Mode Data Data has been culled from the PFMAs submitted to FERC Information that has been extracted includes: Initiating Event Failure Mode Failure mode description Structure/component type We are in the early stages of culling, reviewing, etc. this data. No project identifiable information is in the database. 19
20 FERC Potential Failure Mode Data (cont.) There are 7,535 PFM that have been extracted At this point they have not been fully reviewed, filtered, etc. There are replicates Some are not well defined Expected that future Part 12 evaluations will improve the consistency and quality of this dataset. 20
21 FERC Potential Failure Mode Data (cont.) FERC Potential Failure Modes Database Number Hydrologic Hydrologic Normal Normal Seismic Seismic Other Other All All Ice Ice Not Defined Not Defined Over Pumping Over Pumping Dewatered Canal Dewatered Canal Dewatered Unit Dewatered Unit Load Rejection Load Rejection Rapid Drawdown Rapid Drawdown Rockfall Rockfall Spill Condition Spill Condition Tornado Tornado Initiating Event Type 21
22 FERC Potential Failure Mode Data (cont.) FERC Potential Failure Modes Database Percent 45% 2% 40% 2% 35% 2% 30% 1% 25% 1% 1% 20% 1% 15% 1% 10% 0% 5% 0% 0% Hydrologic Hydrologic Normal Normal Seismic Seismic Other Other All All Ice Ice Not Defined Not Defined Over Pumping Over Pumping Dewatered Canal Dewatered Canal Dewatered Unit Dewatered Unit Initiating Event Type Load Rejection Load Rejection Rapid Drawdown Rapid Drawdown Rockfall Rockfall Spill Condition Spill Condition Tornado Tornado 22
23 Dam Performance Data (cont.) There are a number of resources we are utilizing: ICOLD, USSD (USCOLD) reports, etc. NPDP database Between us, we have colleted: List of dam incidents; U.S. and international. Documents (engineering reports, newspaper articles, photographs, 35mm slides, etc. Also, personal library of an engineer who spent a large part of his life in the dams and hydro business. USCOLD (USSD) contributions We are in the process of bringing this information together online. 23
24 Dam Performance Data (cont.) Resources that we are bringing together: 4,285 U.S. & international dam incidents Approximately 4,500 U.S. incidents (beyond those in the above list). USCOLD (USSD) paper files gathered during the compilation of their 1975 book on dam incidents. Photographs estimated to be over 8,000 Initially starting with the list of international dam incidents (4,285 events) 24
25 Dam Performance Data (cont.) Cumulative Number of Dam Incidents Cumulative Number Year 25
26 Dam Performance Data (cont.) Cumulative Number of Fatalities 300, ,000 Cumulative Number 200, , ,000 50, Year 26
27 Dam Performance Data (cont.) Cumulative Number of Fatalities w/o 1975 Banqiao Dam Failure 25,000 Cumulative Number 20,000 15,000 10,000 5, Year 27
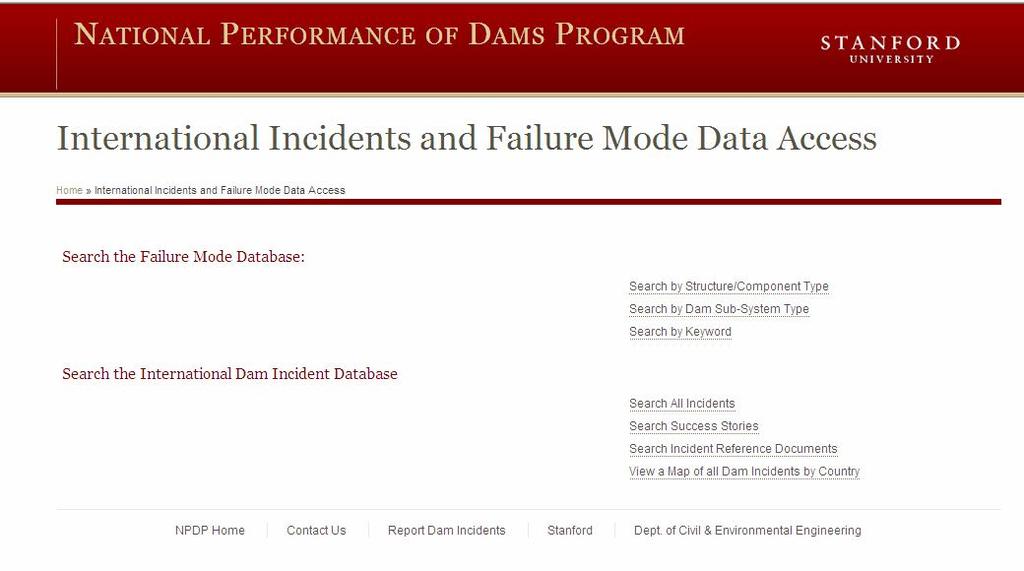
28 Vision for Online Data Accessibility Our vision for online accessibility of dam evaluation (PFMs) and performance (incident) information is mutli-fold. Provide online accessibility to these resources; a digital library (data, documents, photographs, etc,) Inter-relate some of these resources to support dam safety evaluations. Expand the database schema and tools for characterizing events at dams that better supports current needs in dam safety. 28
29 First Steps Database on PFMs The result of a prospective assessment of dams Support an initial understand of the potential vulnerabilities of dams Dam performance Give a retrospective view of events that have occurred. Realization of how the whole dam system performed under certain circumstances Our initial database developments efforts: Getting the PFMs online, Getting the international incidents online, and Relating the two of these; the prospective to the real 29
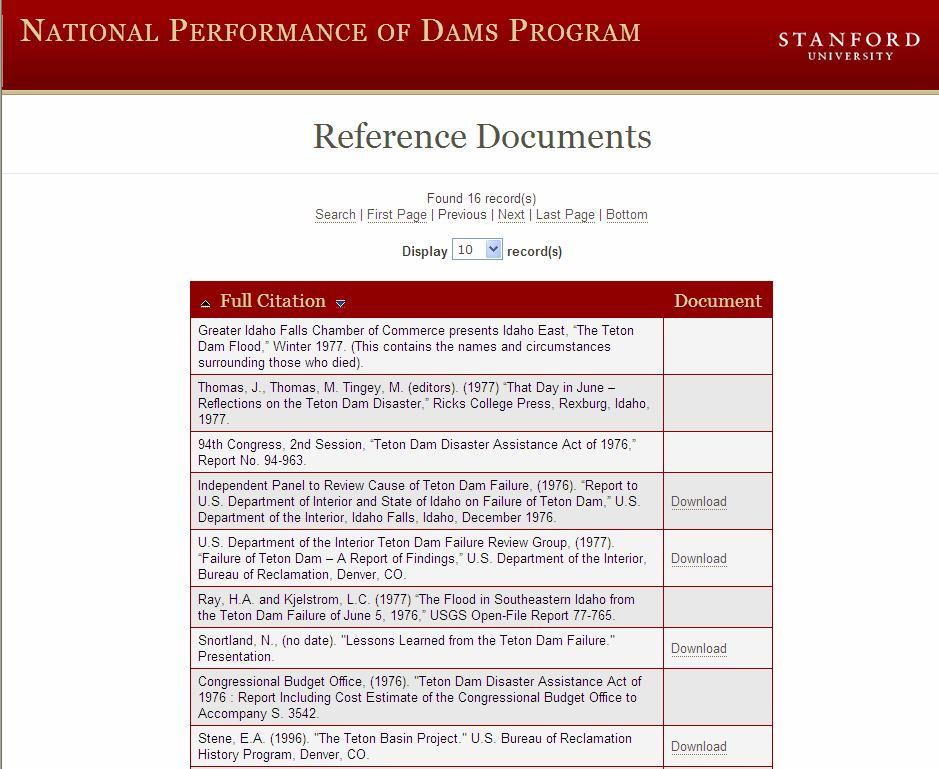
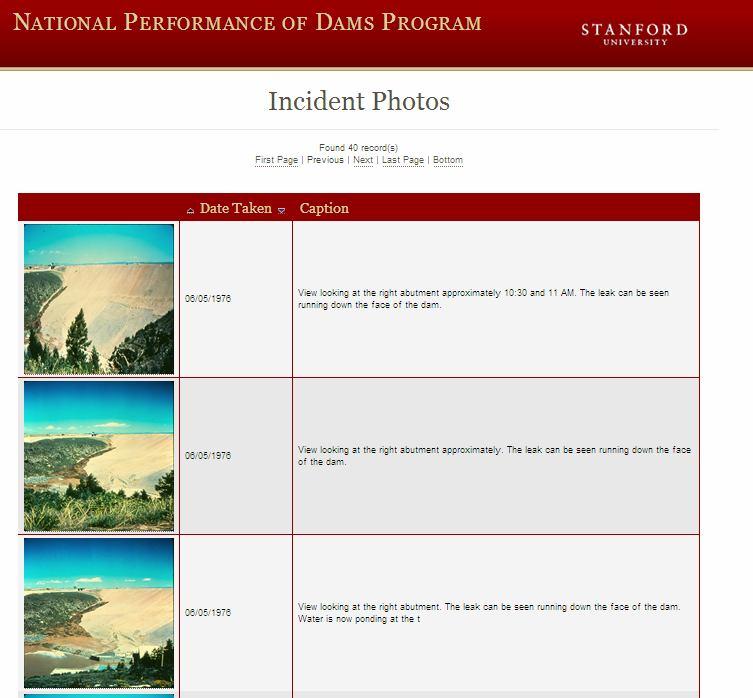
30 Vision for Online Access Potential Failure Modes Dam Performance Events (aka Incidents) References Photos 30
31 A Short Tour 31
32 32
33 33
34 34

35 35

36 36

37 37
38 38
39 Future Characterization of Events at Dams 39
40 Capturing & Transferring Lessons Dam engineering has advanced in large part to the lessons when trial and error was a large part of the evolution of how to design and construct dams. As we have seen in past dam incidents/failures, it is typically not one factor, but a number that collectively conspire to lead to the outcome we observed. Focus on Financial Performance Focus on Personal Safety, Not System Safety Fixing Symptoms not Problems Complacency, Arrogance, Ignorance Poor Communications Focus on Regulatory Requirements Lack of Corporate Safety Culture 40
41 Capturing & Transferring Lessons (cont.) In 2009 at the CEATI workshop on dam incidents, Nate Snortland made this point when he spoke about the Teton Dam failure. (As did others at the same meeting.) His presentation and the message he delivered had relatively little to do about the technical aspects of the dam and the failure. Rather he focused on the organizational factors (think NASA and the Challenger disaster). 41
42 Capturing & Transferring Lessons (cont.) Some of Nate s points/lessons: Engineering and Geology - Aggressive Design with Poor Embankment Materials and Extremely Poor Foundation Communication Investigations not Communicating with Design Design not Communicating with Construction Important Decisions Made in the Field Failure Mode Known, but Not by Teton Design Team Hubris Unwillingness to Learn and Adjust Uncoordinated Confidence 42
43 Capturing & Transferring Lessons (cont.) The factors that play a role in an event (success and failures) are often: Inter-related Difficult to identify Evolve on time scales that are very different than the event itself Traditional characterizations were often provided in a form that was motivated by less-is-more; limited words, abbreviations or codes. 43
44 A Vision for the Characterization of Dam Performance The issue, looking ahead is, how can we capture the insights and lessons from past and future events in a database so they are retrievable, clearly convey the inter-relationships of these factors, the lessons learned, etc. A question arises as to how can we characterize events in a way that better captures the many varied elements and factors that contribute to the initiation and evolution of an event. How do we do this in a way that better captures information about incidents, can be retained and queried in a database, and ultimately displayed for the user. 44
45 45
46 A Vision for the Characterization of Dam Performance Our vision for the characterization of dam incidents is founded on a number of key ideas, attributes: These include: The temporal evolution (memory) of factors that lead to incidents, Variation in time scales The organizational and system level factors that are inter-related and effect how dam engineering is carried out, operations are performed, and events are managed. We will look at two examples that illustrate these points. Our next step is to develop a database structure that captures these attributes that is query-able and easily displayed. 46
47 Managing the Risks of Organizational Accidents James Reasons (2000) 47

48 A Teton Dam Timeline 48

49 Event Involving Operation of A Sluice Gate 49
50 Final Thoughts The world in which the dam safety community operates is changing. These changes are compromising reliability (i.e., aging) and safety, remote operations, business pressures, etc. These changes and demands must be met with better informed technical professionals, owners and management. To support these demands we need the means (data, evaluations, etc.) that improves our understanding of dam and hydropower system performance. Understanding system performance meets to principle owner objectives: reliable generation capability and safe operation. 50
51 Thank You 51