Performance Monitoring Report: Business and Industry Services
|
|
|
- Anne Bruce
- 5 years ago
- Views:
Transcription

1 Performance Monitoring Report: Business and Industry Services Performance Monitoring Report: Business and Industry Services Business and Industry Services Purpose Statement To provide instructional services that improve the occupational skills of individuals through the customized delivery of training, consulting November 15, 2011 services, and technical assistance benefitting employers and contributing to economic development. November 21, 2017
2 1
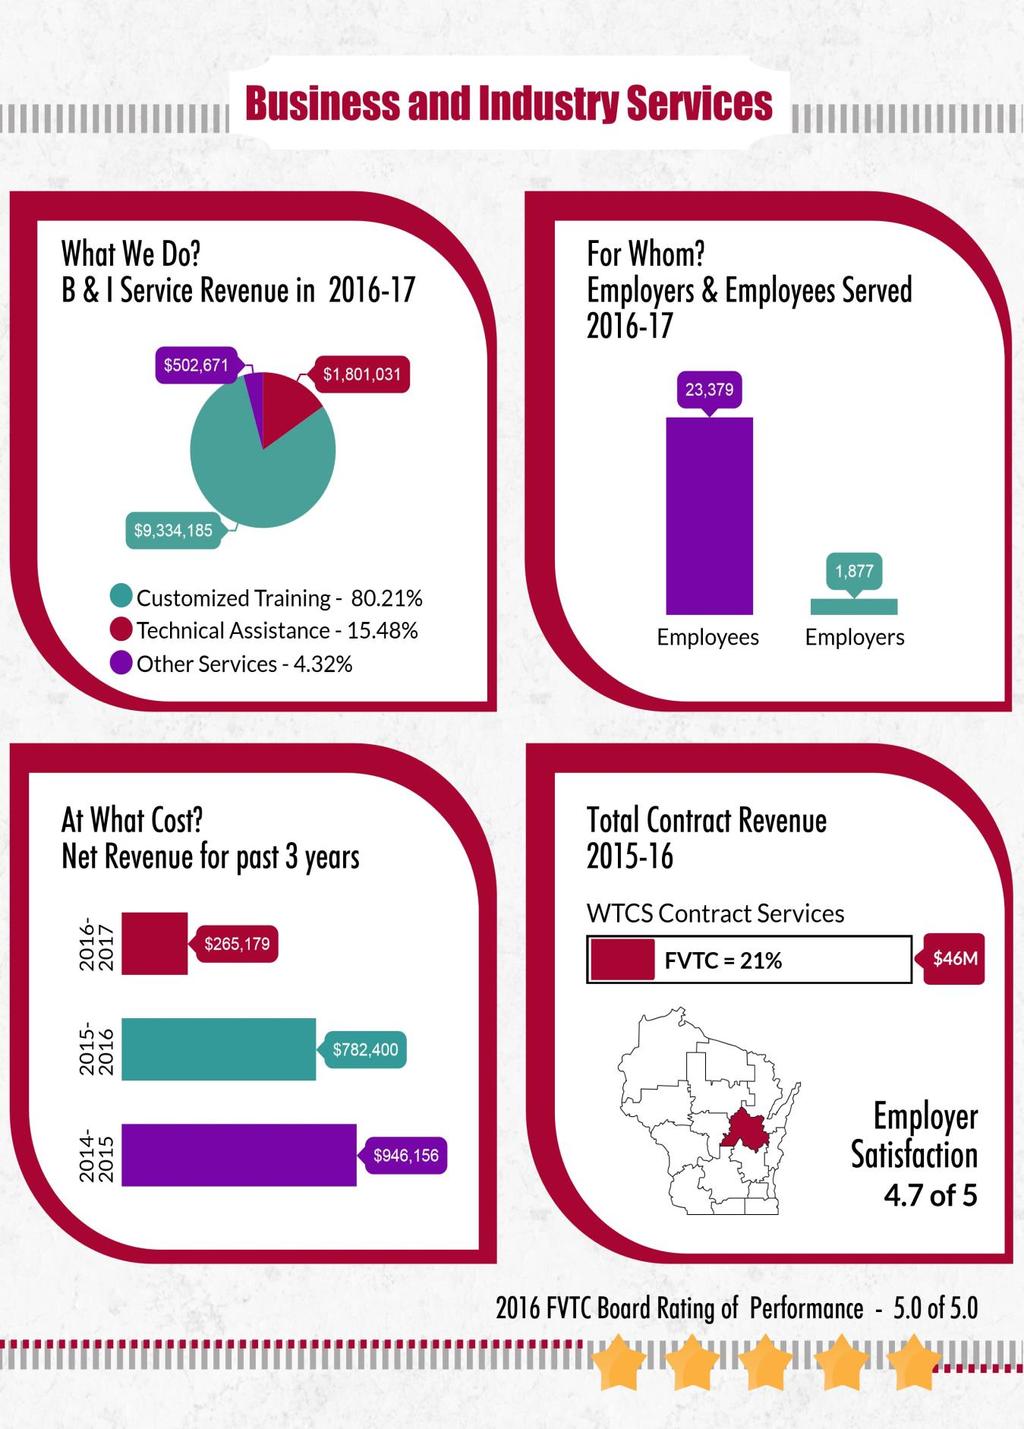
3 Business and Industry Services Report Details Overview The Business and Industry Services (BIS) division of the College develops effective solutions to the workforce development and process improvement needs of district employers and organizations. These solutions are developed jointly with employers reflecting their specific needs to improve operational processes, fill ongoing critical skill gaps, and improve the leadership, communication and cultural aspects of their organizations. The result of these efforts includes enhancing the career pathways of the employees trained and driving economic development through the improved operations of district employers. The primary tools employed by the College include customized training and technical assistance solutions designed by faculty with extensive industry experience, which is combined with academic rigor and reflect the uniqueness of each organization s operation. BIS results also reflect educational services provided through high school dual credit partnerships and the delivery of transcribed FVTC classes in partnership with the Department of Corrections. In , the total contract revenue increased to $11.6M. This level of delivery is reflected in the number of organizations served (1,877) with 23,379 individuals receiving services. These results are achieved through a college-wide commitment to provide the highest level of quality service to organizations. What We Do BIS works closely with organizations to understand the uniqueness of their operations and co-develop skills development and process improvement solutions which can utilize FVTC talent from multiple instructional areas of the College. Customized training and technical assistance services strive to integrate the client s unique business, cultural and market-driven requirements. High-value challenges faced by organizations today including: succession planning, operational efficiency, process improvement, and addressing critical skill gaps. BIS is a responsive partner which leverages its web presence, timely response to service requests, and a face-to-face solution-building framework to ensure the proper design and execution of the specific talent developing solutions required by its clients for long-term success. BIS also provides a wide spectrum of facility rentals which includes classroom, conference rooms and specialized labs for customers specific needs. An important and steadily growing area is alternative and dual credit programs for district high schools. Business and Industry Services operates on a fee-forservice basis with organizations or in a continuing education delivery model for professional development offerings to employed adults. Integrated Model To serve both Business and Industry Services clients and degree-seeking students, FVTC utilizes the integrated model of sourcing faculty and staff from a wide breadth of certificate and degree program areas of study into instructional contracted offerings. These staff members are routinely working with both the students and their eventual employers in an environment of continuous improvement for both 2
4 audiences. Through their industry assignments, faculty and staff benefit by being exposed to current industry technology, processes and organizational needs which can then be reflected in the program offerings of the College. In , the College delivered 734 organizational and 112 multiple-recipient contracts. This level of activity was consistent with results from the prior year. These contracts represent a spectrum of services provided as listed in Table 1. Table 2 lists the wide variety of consulting categories the College delivers through Instructional Training or Technical Assistance. Table 1: Description of Services Instructional Training Technical Assistance Facility Rental/Alternative High School/Other Technical trainers and curriculum experts work with organizations to tailor training to address business objectives and employee skill gaps. This service includes an extensive offering of courses, seminars and workshops, and professional development instruction for organizations and employed adults for both private and public employers. Dual credit offerings in high schools and educational services in correctional facilities are services provided under contract. FVTC staff provides assessment, training plan development and consulting in College facilities or at a company worksite. Services include interventions, facilitation, strategic planning, rapid prototyping, trial press runs, curriculum development and many others. FVTC training rooms, meeting rooms, labs and equipment provide general business and specialized manufacturing support. Alternative High School services are an additional resource for school districts to support students at risk of not graduating high school. Table 2: Training & Consulting Categories APICS / Supply Chain Solutions Employee Assessments Business, Management & Finance Communication Skills Computer Technologies Construction Customer Service, Sales & Marketing Engineering Technology Environmental Health, Safety Global Education & Services Healthcare & Human Services Horticulture, Agriculture & Natural Resources Human Resources & Workplace Skills Lean & Six Sigma Learning & Training Technologies Manufacturing Printing Technologies Public Safety Small Business & Entrepreneurship Transportation 3
5 For Whom The total number of participants served by FVTC Business and Industry Services totaled 23,379 in as compared to 21,593 in the previous year. These enrollments translated into 619 FTEs, an increase from the 515 FTEs recorded in This total represents 10.2% of the total FTEs generated by the College in (Total FTE = 6,043). Please note that technical assistance contracts, although significant, do not contribute to enrollments in this category. Profile of Service Recipients In addition to the revenue information in the At What Cost section on page 7 of this report, Vision 2020 Strategic Measure 3.4 Customized training/technical assistance volume is monitored by reviewing revenue volume by sector (Figure 1), and Strategic Measure Number of employers served through workforce training is highlighted in Table 3. Figure 1 shows robust growth in the Educational market with an increase of nearly $728k or 31%, particularly through the K-12 district partnerships established by staff in FVTC s Student Services and instructional areas. Business and Industry revenues remained constant, while the Government sector had an increase. Out-of-state revenues reflect a 70% increase in , predominantly due to contracts in global education. FVTC delivered training and technical services as well as other instructional contract services to 1,877 different organizations in Figure 1: Profile of Service Recipients by Revenue $7,000,000 $6,000,000 $5,000,000 $4,000,000 $3,000,000 $2,000,000 $1,000,000 $- Educational Government Business and Industry Out of State $1,899,511 $1,060,013 $5,737,191 $1,341, $2,327,543 $1,002,611 $5,925,368 $922, $3,055,383 $1,100,294 $5,919,347 $1,562,863 *Unaudited data Source: FVTC PeopleSoft (08/25/17); Includes state/non-state reportable revenue, WAT grants. FVTC continues to build longstanding relationships in both the public and private sector markets. Table 3 shows a list of the top 20 contracting clients. Industry clusters with critical skill needs such as Transportation, Supply Chain, Global Education, Construction, and Manufacturing are strongly represented in the top ten. These organizations have developed close working relationships with FVTC staff in order to proactively address the need for talent pipelines, respond to critical skill gaps and continually improve internal processes to remain competitive in their respective industries. International contract training is dependent upon the global geopolitical environment. 4
6 Table 3: Key Contracting Clients by Revenue ROEHL TRANSPORT $780K $671K APICS $476K $388K WAUPACA FOUNDRY $359K $224K OSHKOSH DEFENSE LLC $351K $66K MILLER ELECTRIC $302K $176K OSHKOSH CORRECTIONAL INSTITUTION $268K $204K FABICK $268K $288K PIERCE MANUFACTURING $231K $169K FBI $189K $318K BEMIS COMPANY INC $176K $69K SANTANDER UNIVERSIDADES PROGRAM $169K $0K (Mexico - Ministry of Education) ALLIANCE LAUNDRY SYSTEMS $154K $114K MACDERMID PRINTING SOLUTIONS $126K $147K KIMBERLY-CLARK $115K $110K AMICA INSURANCE $109K $97K DUPONT $107K $74K SECRETARIA DE RELACIONES $98K $0K (Mexico - Ministry of Foreign Affairs) FOX VALLEY ELECTRICAL $91K $74K INTERNATIONAL UNIVERSITY EXCHANGE- Korea $74K $0K CHIPPEWA VALLEY TECHNICAL COLLEGE $74K $9K Participant and Employer Satisfaction Participant feedback is requested at the conclusion of each training session. The instructor, instructional content, level of learning experience and overall satisfaction with the training experience are evaluated. This feedback is critical to ensure that the College is delivering services as required by the employer. With over 5,000 evaluations received each year, the College consistently receives ratings of over 4.5 on a 5 point scale in each category evaluated. Maintaining this level of satisfaction is critical to the continued growth of the number of BIS customers served. In addition, the employer is polled at the completion of the contracted training event to determine the level of customer service experienced, the overall value of the training as well as if the employer would employ the College again for future training. Similar to participant satisfaction, employers consistently rate the results of FVTC s training and technical assistance efforts over 4.5 on a 5 point scale. An essential indicator of employer satisfaction is the key rating of Would Contract Again. Here FVTC has maintained a rating of 4.5 or higher for three straight years. In addition, the Overall Satisfied measure of 4.7, a key measure of anticipated future activity, maintained its 4.7 rank from the last two years. This metric incorporates not only the instructional delivery, but the level of support received by the client from their initial FVTC contact through the billing of the services provided. 5
7 At What Cost Revenue Generated In the , revenue from contract training, technical assistance, professional development seminars, Workforce Advancement Training (WAT) grants, facility rentals and Alternative High School revenue increased to $11,637,887 (Figure 2). This revenue increase of $1.5M was primarily due to strong customized training and technical assistance results from Global Studies and K-12 partnership contracts in Figure 2: Revenue by Contract Type $11,000,000 $10.0M $10.1M $11.6M $9,000,000 $7,000,000 $5,000,000 $3,000,000 $1,000, Technical Assistance $1,935,138 $1,402,309 $1,801,031 Instructional $7,546,713 $8,259,787 $9,334,185 Facilities/Alternative HS/Other $556,732 $515,459 $502,671 *Unaudited data Source: FVTC PeopleSoft Finance (08/25/17); Includes state and non-state reportable revenue, as well as State funding for WAT grants, but excludes internal transfers for support. Benchmark Comparisons Figure 3 compares FVTC performance with select benchmark colleges based upon the highest results in contract revenue generation over the last three years. The unaudited benchmark comparisons (Figure 3 green bars) were self-reported by the WTCS colleges. These comparisons demonstrate that FVTC maintains its lead position in the WTCS in securing and delivering contract and professional development services as measured by revenue. For the most recently audited year of (Figure 4 red bar), FVTC delivered 20.9% of all WTCS contracts as measured by revenue. WTCS college results by highest percentage of total state contracting revenue are: Northeast (11.1%); Waukesha County (9.8%); and Moraine Park (8.3%). In fiscal year 2016, total WTCS revenues rose for the fifth straight year to $46M. 6
8 Figure 3: Benchmark Comparisons by Revenue Generated (State Reportable Contracts and Professional Development Seminars) Fox Valley $9.6M $9.4M $11M Northeast Moraine Waukesha Gateway Milwaukee $3.3M $5.0M $4.5M $4.1M $3.8M $3.7M $3.2M $4.5M $5.0M $3.2M $3.3M $2.8M $1.0M $2.2M $1.8M $0 $2,000 $4,000 $6,000 $8,000 $10,000 (in thousands) *Unaudited : FVTC PeopleSoft Finance (08/25/2017) Note: Comparative data is self-reported from respective colleges may not be inclusive of all revenue. Source for : WTCS Report Contract vs PDS 2015 and 2016 and WTCS CNT310 Report (09/6/17). Contracting Financial Results The financial health of contracting is measured by the Gain (Loss) and Net Gain (Loss) as calculated across all program divisions involved in delivering contracted services. In , FVTC experienced a Gain of $709K before Overhead. After application of Overhead, a Gain of $265K was realized (Figure 6). Figure 4: Multi-year Financial Results $1,600,000 $1,400,000 $1,200,000 $1,000,000 $800,000 $600,000 $400,000 $200,000 $- $(200,000) $(400,000) Gain (Loss) before Overhead $150,523 $1,416,762 $1,233,949 $708,894 Net Gain (Loss) after Overhead $(124,293) $946,156 $782,400 $265,179 *Unaudited : Source: FVTC PeopleSoft Finance (08/25/17). Total activity including all contracting and professional development activity. 7