How Bad Data is Hurting the Fire Service
|
|
|
- Morgan Douglas
- 5 years ago
- Views:
Transcription

1 How Bad Data is Hurting the Fire Service
.")

2 John P. Binaski MS, EFO, CFO 24 years of fire service experience. Currently the Fire Chief for the City of Clovis (CA). Previously the Division Chief for the City of Tulare (CA). Experience as a Fire Technology Coordinator and certified as a Master Instructor. Served as a Peer Assessor for the Commission on Fire Accreditation International. Clovis FD has been an accredited fire agency for 13 consecutive years.
. Former Deputy Chief and Interim Fire Chief for the City of Fresno (CA).")

3 Micheal Despain M.A., EFO, CFO, MIFireE 32 years of fire/ems experience. Currently Fire Chief for Lincoln Fire & Rescue (NE). Former Fire Chief for the City of Clovis (CA). Former Deputy Chief and Interim Fire Chief for the City of Fresno (CA). Served as a subject matter expert for the National Fire Academy and the Center for Public Safety Excellence on emergency services deployment curriculum. Former Board Member for League of CA Cities. Lincoln Fire & Rescue has maintained its accredited status for 19 consecutive years.


4 Brian L. Cummings 34 years of fire/ems experience. Former Fire Chief for the City of Los Angeles. Currently consulting for Career Survival Group, Emergency Performance Inc., and Public Safety Solutions Inc. Subject Matter Expert assisting with the development of the National Fire Operations Reporting System (NFORS).

5 Objectives Review advantages of using good data Common pitfalls of bad data use Explore the differences between using data to accomplish activities vs. outcomes Explore sources of data Non-traditional ways to use data in developing organizational solutions

6 What is the difference between what citizens, elected officials, staff and others know about your fire department today, as compared to ten years ago?


7 Today jurisdictions are more transparent than ever.
.")
8 What We Have Learned Social media and citizen oversight groups love data (make sure it is good data). Where do they get this data and do they know what it actually means?

9 City of San Diego Data The city surveyed citizens, community groups and media what data they wanted to have real time access to.

10 As a chief officer, and especially if you are the chief of the organization, you need to know your information better than anyone else and always be prepared to answer questions about it.
.")
11 Why use data? It takes (some of) the emotion out of the decision. It helps create a baseline for measuring impacts (How do you know things will get better or worse?). Helps you sleep at night. (sometimes) Or even better...

12 CAUTION: Data alone may not be enough. Look at data in terms of a goal or an outcome. What is the return on investment of the activity or the $$$?


13 How do you know if you have accurate data? Complete guide to the LAFD data controversy By Ben Welsh April 12, 2012.
14 Common Pitfalls of Bad Data Use

15 The Old Firefighters Per One Thousand" Story Firefighters per 1,000 or Firefighters per Capita The only direct correlation between FF s per Capita and an outcome is an increase in the budget. REFERENCE: Smarter, Faster, Cheaper. IBM Global Business Services 2011 There are no studies to correlate this to any important fire service outcomes (i.e., reduction in injury rates to civilians or FF s, less fire loss, higher EMS survivability rates, etc.).
 they are below some optimal number and they are attempting")
16 So why do we still use this figure? Tradition? It used to work!!! Maybe agencies feel (emotional argument) they are below some optimal number and they are attempting to use it to justify additional staffing.

17 What is a better way to justify staffing? 1. Analyze the risk 2. Analyze historical performance 3. Analyze critical tasking

18 REFERENCE: NFPA 1710 (2010)
19 Task Firefighters Company Attack Line 2 1 st Engine Pump Operator 1 1 st Engine Primary Search/Rescue 2 2 nd Engine Water Supply/Sprinkler 1 2 nd Engine Two-Out/Utilities 2 3 rd Engine Back Up (2 nd ) Attack Line 2 4 th Engine Ventilation/Forced Entry 3 1 st Truck Safety Officer 1 4 th Engine Command 1 Battalion Chief Total 15 Firefighters 6 Fire Apparatus

20 What is a better way to justify staffing? 1. Analyze the risk 2. Analyze historical performance 3. Analyze critical tasking 4. Determine daily minimum staffing 5. Perhaps determine peak demand staffing
.")
21 Minimum Staffing Use data to determine the optimal number of personnel per day (or by hour of the day). Do you have a peak demand period vs. a baseline demand? Is the peak demand area specific? Critical tasking will get you an idea of your effective response force (ERF). Can fire units cover more area (travel time) at night?

22 Be careful with crew size studies? There are great studies showing the effectiveness of 2, 3, 4 and 5 person crew size. REFERENCE: NIST Report on Residential Fireground Field Experiments. However, don t confusing the efficiency of crew size with the importance of getting bodies on a scene.
23 Using Cost per Capita Peer City General Fund Operating Budget (In Millions) Population Estimate* Per Capita General Fund Expenditures % of General Fund for Fire Dept. Chico $ ,077 $153 25% Davis $ ,894 $149 21% Lodi $9.9 63,338 $156 23% Manteca $8.6 71,948 $119 27% Merced $ ,102 $136 25% Roseville $ ,035 $224 22% Turlock $7.7 70,365 $109 24% Visalia $ ,763 $135 28% Comparative Average $ ,315 $ % Clovis $ ,188 $129 23%


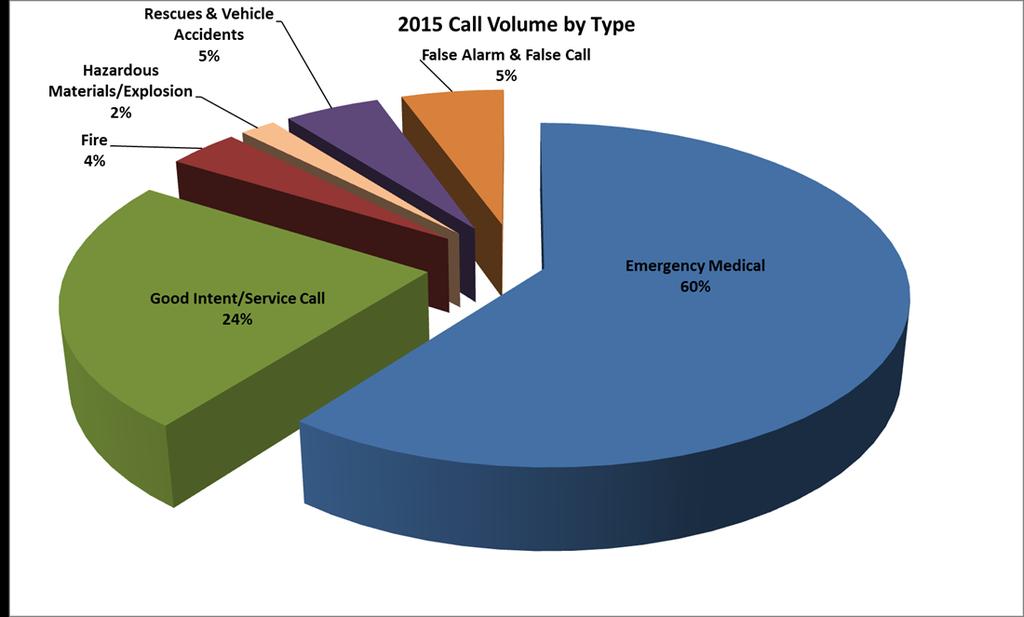
24 Common Complaints Against the Fire Service 80% of your work is just medical Why do you take those big trucks to a medical call? Why not take a smaller vehicle and save the fire truck for just fires? All you do is sit around and play cards all day

25
26

27

28 How Busy is Too Busy?

29
30

31
32
33
34 How Busy is Too Busy? Unit Responses Commitment Factor Engine Engine Engine Truck Engine Engine Engine Engine Truck

35

36


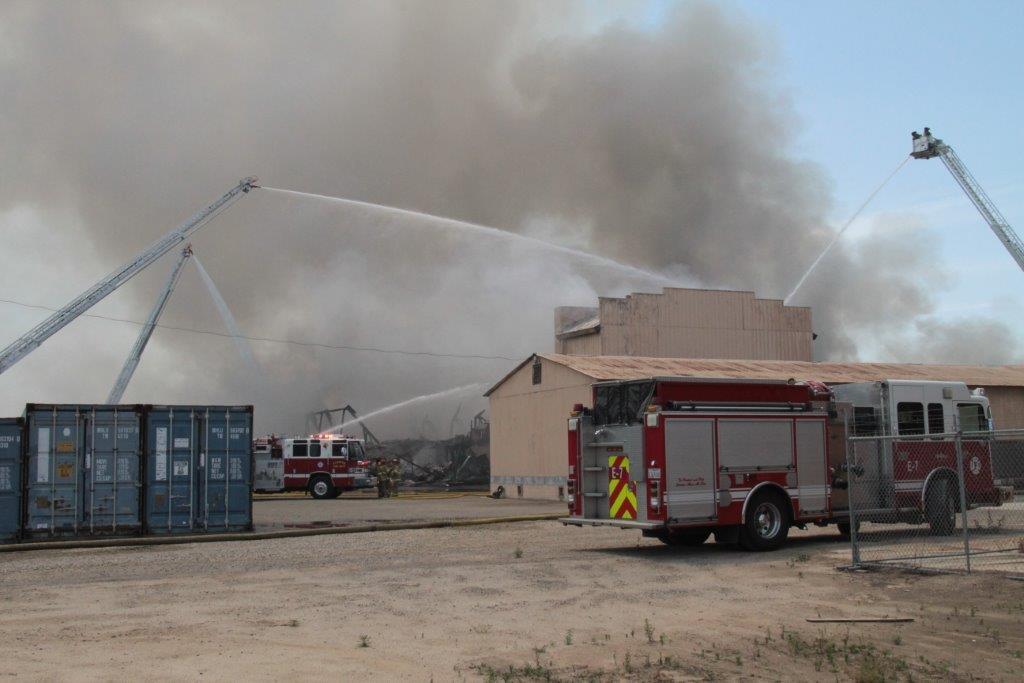
37 Big Fire Truck vs. Little Vehicle
38
39
40
41

42
43

44

45

46 So where do we find data about our organization? The obvious ones: NFIRS, EMS PCR, budget and inspection data Response Data GIS Performance Data or Reliability/Outcomes Incident Reporting Data Community or Census Data

47 FireView or Performance Data
48 Performance Time Interval Benchmark Metric All Call 0:01:20 Processing Count th Percentile 0:01:38 0:01:36 0:01:14 0:01:29 0:01:49 0:02:09 Benchmark Compliance 84.3% 82.7% 90.5% 85.4% 82.9% 79.3% Turnout 0:01:10 Travel 0:04:00 Response 0:05:20 Total Response 0:06:55 Count th Percentile 0:01:45 0:01:40 0:01:47 0:01:52 0:01:34 0:01:43 Benchmark Compliance 48.1% 50.0% 47.8% 50.6% 49.6% 41.0% Count th Percentile 0:04:54 0:04:42 0:04:23 0:05:18 0:04:58 0:04:45 Benchmark Compliance 77.0% 80.0% 83.5% 71.3% 73.2% 78.7% Count th Percentile 0:06:10 0:06:03 0:05:39 0:06:29 0:06:07 0:05:59 Benchmark Compliance 77.7% 77.2% 84.2% 70.7% 78.2% 80.3% Count th Percentile 0:07:11 0:07:05 0:06:32 0:07:19 0:07:20 0:07:07 Benchmark Compliance 87.6% 88.2% 92.1% 82.7% 87.3% 89.3%

49 Turnout Times

50 Other Sources for Data What about Fleet Building & Planning Departments Local EMS agency Local hospitals Social Media Data

51 What about average response times? Are these good measurements? What does average really mean regarding response times? 50% of the time this is how long it takes our emergency resources to arrive at scene.

52 Property Saved vs. Property Loss What does property saved actually tell us? How well do we actually estimate fire loss and property saved? What other data sets could be better at telling our message?

53 So what can EMS data be used for? Our EMS agency looked at over 385K calls over a 3-year period. What did they discover? Less than 15% actually required ALS intervention. Less than 10% of all transports required Code 3 transport. Hospitals didn t utilize time savings REFERENCE: The effectiveness of lights and siren use during ambulance transport by paramedics. Prehospital Emergency Care REFERENCE: Should Response Time be a Performance Indicator? EMS World June 2015

54 EMS Response Data


55 ALS Treatment The Boston study of PD transporting trauma patients and not waiting for Fire ALS. Study in 20 US cities found that chest pain patients arrived more quickly by POV than by Ambulance REFERENCE: Rapid early action for coronary treatment (REACT) demographic, belief and situational factors influencing the decision to utilize emergency medical service among chest pain patients. Circulation

56 ALS Treatment How many paramedics are really needed? Do we need all of the ALS skills or medications? Why do we not embrace EMT- Intermediate? Wang HE, Yealy DM. Out-of-hospital endotracheal intubation it s time to stop pretending that problems don t exist. Acad Emerg Med, 2005

57 Let s Look at ROSC and Trauma Outcomes Increased survivability of cardiac arrest, why? Patients with out-of-hospital cardiac arrest who received BLS had higher survival at hospital discharge and at 90 days. REFERENCE: Outcomes after out-of-hospital cardiac arrest treated by basic vs. advanced life support. JAMA Internal Medicine, E1-E9. Available at

58 Is There Such a Thing as Too Much Data?

59 Is There Such a Thing as Too Much Data?

60 Is There Such a Thing as Too Much Data?

61 Is There Such a Thing as Too Much Data?


62 Final Thoughts These are all questions chief officers are going to have to answer as more data becomes available. You should start reviewing your data to be able to answer many of the potential questions before they are asked of you or your agency. Increasing requests for department analytics.

63 In Conclusion Good data can help you solve problems and lessen emotional arguments that might hinder progress. Know where to get your data. Some of it may be outside your control Make sure your data is accurate. Make sure you know the path your data takes to get to you. Know your audience before you publish your data.


64 Thank you for your time today John Binaski Clovis Fire Dept. Clovis, CA Micheal Despain Lincoln Fire & Rescue Lincoln, NE Brian Cummings