Tracking stress and workload in the Maritime/Tugboat world
|
|
|
- Hannah Ellen Carroll
- 5 years ago
- Views:
Transcription


1 Tracking stress and workload in the Maritime/Tugboat world

2 INTRODUCTION OF PROJECT PARTNERS 2


3 BACKGROUND 3


4 4 MARIN


5 B 5

6 WORKLOAD EXPLAINED 6

7 WHY DO WE NEED A WORKLOAD INDICATOR? Identify most critical phases in operation Evaluate effect infrastructure on operational workload Optimize man machine interface Optimize team performance (optimum allocation of tasks) Monitor training effectiveness 7
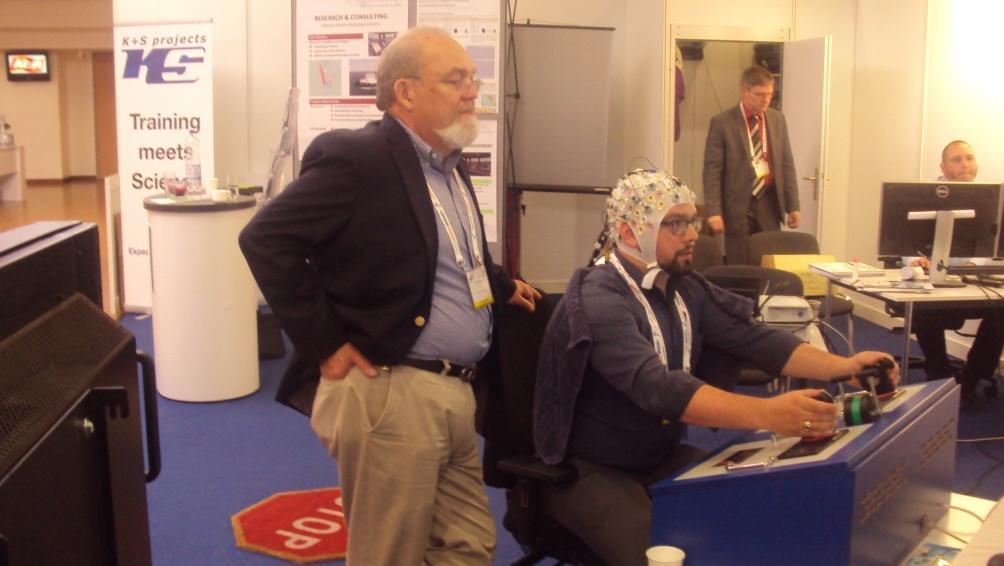
8 OBJECTIVES OF THE 2015 HF EXPERIMENT Study the feasibility of a real-time EEG based workload estimation in a bridge simulator scenario (take the laboratorium to a more operational environment). Study the correlation and complementarity of different physiological indicators. Develop an overall workload indicator for the selected simulator scenario containing EEG, ECG, skin conductance, breathing analysis and simulator time traces. Conduct simulations with different levels of workload on a tug simulator and include, EEG, ECG, respiration and Skin conductivity measurements. And evaluate if they can be used together with simulator signals to contribute to a workload indicator. 8

 for a")
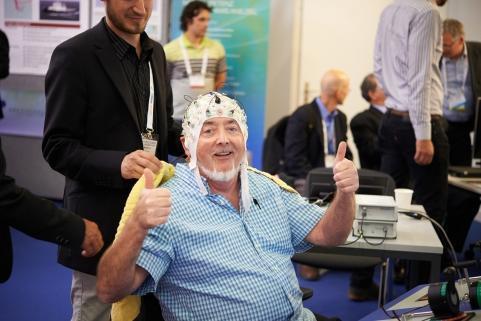
9 EEG MEASUREMENTS EEG records changes in electrical activity on the scalp Machine learning used to detect classifiers (frequency patterns that are related to workload) for a specific participant. 9
 activity Decrease in parietal alpha")
10 EXAMPLES OF EEG PATTERNS In general high workload causes: Increase in frontal theta (4-8 Hz) activity Decrease in parietal alpha (8-12Hz)activity 10
11 ECG MEASUREMENT ECG records the inter beat interval, from which the frequency and variability can be studied Measured with a belt With increased workload we expect: Heart frequency will increase Variability will decrease RMSSD (root mean square of successive differences) will decrease Power LF will increase Power HF will decrease 11

")
12 SKIN CONDUCTIVITY - PRINCIPLE Sweat gland conductivity (microsiemens) wrist 12

13 SKIN CONDUCTANCE Regular pattern Arousal and relaxation visible Events can be clearly detected Base level is influenced by more factors than stress alone start Watching a soccer match start end 13 Meditation

14 FULL DAY EMOTION AND ACTIVITY MEASUREMENT Lecture Relaxing Skin Conductance GSR storm Working Parenting Orientation Travel Sleep Activity level 14

15 PHASE 1 - OPTIMIZE SCENARIOS AND TEST SET-UP 1. Scenario with bow to bow operations 2. Squall scenario 3. N-back task Multi sensor bracelet not yet included 15

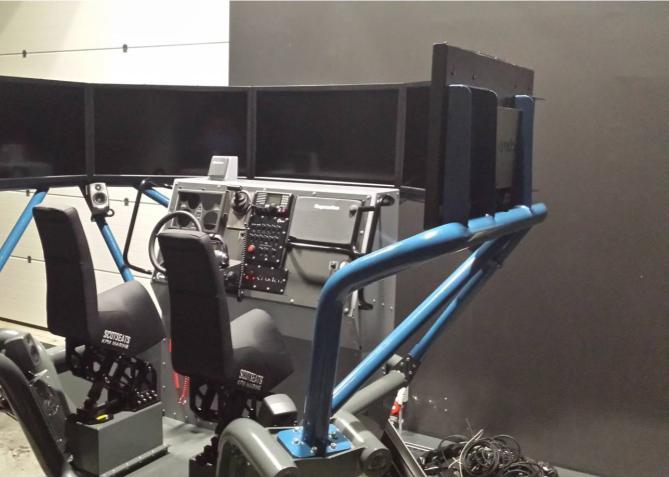
16 SCENARIO 1 BOW TO BOW OPERATIONS

17 SCENARIO 2, N-BACK TASK Same as scenario 1, but maintain position next to container ship 4 min, no extra task 4 min, cognitive task
 Task is to maintain same relative position and pull force (30 ts).")
18 SCENARIO 3, SQUALL Tug provides continuous pull back for offloading tanker Squall (sudden wind increase + direction change) Task is to maintain same relative position and pull force (30 ts). 18
19 RESULTS PHASE 1: IMPROVED SCENARIO 19
20 SET UP 2 ND PHASE SIMULATIONS 10 candidates performed the following program: Scenario 1, bow to bow operations (2 cycles, total 50 minutes) N-back task (5 repetitions, total 40 minutes) Scenario 1, bow to bow operations (2 cycles, total 50 minutes) One candidate became motionsick during first run and provided no valid results. 20

21 PHASE 2 SIMULATIONS - IMPRESSION 21

22 EEG RESULTS 22

23 DIFFERENT FILTERING METHODS TO OBTAIN CLASSIFIERS 23

24 RESULT OF A DEDICATED CLASSIFIER 24
 are less consistent and less suitable to include in workload indicator. N-back: Significant difference between low and high workload periods.")
25 RESULTS - ECG RR interval decreases and HR increases consistently with higher workload. Other relations (variability, spectra etc) are less consistent and less suitable to include in workload indicator. N-back: Significant difference between low and high workload periods. Bow-Bow: Significant difference between Low-High1 and High1-High-2; High 1 condition for all candidates most demanding 25


26 RESULTS SKIN CONDUCTIVITY Only 4 good measurements 26


27 RESULTS SIMULATOR SIGNALS First results N-back task very surprising: Some candidates showed significant increase in rudder and telegraph changes during periods of high workload, whilst the steering job did not change! 27


28 COMBINED RESULTS 28
29 CONCLUSIONS It is possible to measure relative workload with physiological features. Ship related parameters can be used to enhance this process. EEG and ECG can discriminate between high and low workload Preparing an EEG takes a lot of time and is very intrusive (it forces the wearer to sit in a chair continuously and after a while it is annoying to wear). Wireless dry cap systems may be the way ahead. EEG is very valuable to measure workload. It is possible to find classifiers for workload, but they are person and scenario specific. For example: the auditory N-back tasks requires other classifiers than the visual bow-to-bow pulling task. 29
30 CONCLUSIONS The signals from the ECG can be used as a measure for workload, our study showed which signals are suitable for inclusion in the workload indicator. The number of successful skin conductance measurements was low, but still looks like a promising way to go. It may be very difficult to determine a generic workload indicator that works on everybody, but with a purpose built calibration run individual workload indicators can be found. We gained a lot of experience with this experiment and the analyses, which forms a sound basis for future experiments. 30

31 OUTLOOK The evaluation of data is still going on. We are going to combine the simulator signals and physiological measurements into one workload indicator. We intent to use the machine learning tool that identified the EEG classifiers to find multi-tool classifiers. As MARIN wants to develop a human factor laboratory for its new simulator facilities, more experiments are to follow, we look for cooperation with manufacturers, operators, scientists etc. Also K&S and TU Berlin continue with research in this area. We want to do experiments with other type of operations (e.g. pilotage of vessel, offshore operations) and also on-board tests to link simulator experience to real life experience. Experiments including other techniques: Eye-blink rate Pupil diameter Squeeze sensor Voice pitch Secondary tasks 31

32 THANKS TO THE TUG CAPTAINS 32


33 WHO TO CONTACT?: 33