Putting Lagging Indicators in the Rear View Mirror with Broadly Applicable QHSE Process-based KPIs. ESRI Petroleum GIS Conference.
|
|
|
- Bethany Martin
- 5 years ago
- Views:
Transcription


1 Putting Lagging Indicators in the Rear View Mirror with Broadly Applicable QHSE Process-based KPIs 2 May 2012 Kip Carter Solution Engineer IHS, Inc. ESRI Petroleum GIS Conference 1
2 Agenda Brief Introduction to IHS, Inc. 35 Minutes: Leading Indicators that Drive Safety Performance & Operational Excellence: What are Leading Indicators of safety performance? How do you know what to measure? How do organizations turn metrics into results? Final thoughts 10 Minutes: Feedback and Questions 2

3 The Leading Source of Critical Information IHS provides content, software and expert analysis that supports your organization s ability to advance critical decisions with speed and confidence. We serve 55,0000+ customer organizations in 180+ countries around the world We are 5,500 people, speaking 50 languages, helping our customers address challenges in six key areas 3


4 Advancing Decisions that Advance the World EHS & Sustainability With a unique blend of software, content and expertise, IHS makes it possible to manage sustainability risks and opportunities for superior returns within the following solution categories: Operational Risk Energy and Carbon Environment Product Stewardship Corporate Responsibility Health and Safety We are helping clients achieve these goals by leading a historic transformation in the software industry.
5 Presenter Background HSE Professional of more than 25 years in the private and public sector Industrial Hygiene and Employee Health Manager HSE Manager OSHA Compliance Officer IHS, Inc. Currently Solution Engineer Formerly - Account Manager for PPG, Shell, Valero, ADM, etc.
6 Leading Indicators One Definition Predictors of future events? or Measurements of activities that reduce loss rates? A leading performance indicator is something that provides information that helps the user respond to changing circumstances and take actions to achieve desired outcomes or avoid unwanted outcomes. - Leading Performance Indicators Guidance for Effective Use by the Step Change in Safety organization
7 Characteristics of good leading indicators Measurable Actionable Consistent Objective Credible 7
8 Current Leading Indicators in industry # of observations % training compliance # of near misses # audit findings # of inspections conducted % of MOC s properly executed Safety perception survey results Days between recordables, lost time, etc. Etc.
9 Barriers to using Leading Indicators Lack of confidence it will effect outcome performance (eg Total Recordable Incident Rate) Belief by management proven? Level of effort to collect and consolidate the data Not practical in some cases Potential Gaming to improve score pencil whipping Not able to benchmark against peers / other locations No common, consistent metric that can span across companies
10 How do we overcome these barriers? By providing statistically proven and actionable metrics!!

11 Research: The Difference? Best Performers Worst Performers Lowest Y = Loss Rates Highest What organizational factors have the biggest impact Enable organizational leaders to measure / improve factors that have been proven On improving QHSE performance? To result in a lower likelihood of major incidents, reduced rate of loss, sustained reputation, etc


12 FICO as Model of Actionable Leading Indicators Actionable leading measurements to steer improvements Improvement in FICO factor scores leads to improved credit rating Which leads to approved loans, better interest rates, etc.
13 Research, Data, Math & Leading Indicators Routine activities, responsibilities Incidents, investigations, observations, audits, action items, etc Worker involvement in above Huge data set of above Spanning > 100 countries In 24 different languages 1000 s of facilities Users of common platform Each company with a central database Goal: Find actionable, measurable, predictive leading indicators 2008 / 2009: Studied over 200 potential leading metrics and correlations to incident outcomes (TRIR) 2010: Leading metric benchmarking (14 companies, thousands ops units) Benchmarking ONLY actionable, measurable leading indicators 2011: Seed forum and development of INDEX dashboard framework Developing INDEX components for use on executive dashboards
14 The Data Set: Risk Reduction Events & Actions Scope: The organization s collection of ALL events that result in risk reduction Over 1MM incident / near-misses Service / Product Quality Injuries / Illnesses Releases / Spill Reliability / Equipment Failure Asset Damage Security Incident Reputation Damage Other kinds of loss events.. Hi Med Low No Loss Exposure to Loss Millions of findings / exposures Behavioral Safety Observations QHSE Management System Audits Risk Profiling / Assessments VPP Self Assessments Site-level Walk-through Audits ISO 9000 Certification Assessment Hazard Identification Programs Hundreds of other processes. Centralized Database Millions of Action Items Action Items Resulting in Risk Reduction
15 Event AND Process Execution Data Data on workforce participation in reporting of ALL events Data on time taken to execute EACH STEP within the full lifecycle from reported to closed H i Med Low No Loss Exposure to Loss Reported Event Data Detailed data from incidents, near miss, observation, audit, assessment, etc. events Sources of Exposure Iterate Where Applicable Risk Reduction Process Lifecycle Reduced Risk Matrix Causes / Findings Action Items Data from organizations who apply a risk matrix to score risk level of each event Data from organizations who assess causes for events (map to mgmt system elements) Data on timeliness of action completion Data on involvement of leaders to take accountability for action


16 Research Result: Process-based Indicators Workers are engaged in reporting events incidents, near misses, observations, etc Front-line Supervisors (or SME s) are responsive to reported issues Reported Event Data Risk Exposure Risk Reduction Cycle Risk Matrix Causes / Findings SME s are disciplined in executing processes Iterate Where Applicable Reduced Action Items Leadership promptly accepts accountability for actions Workers are diligent in completing action items Interpretation: High-performing organizations engage all levels of the workforce in a collective effort to reduce risks, minimize operational errors, etc

17 Research: QHSE Process-based Indicators Organizational factors unique to top performers Reporting culture Action item Effectiveness Leadership and Process discipline Best Performers Worst Performers Lowest Y = Loss Rates Highest


18 FICO as Model of Actionable Leading Indictors Analogy: Apply actionable leading metrics for line managers Such that improvement in organizational factors produces lower loss rates Used by line managers as KPI s to continuously improve Safety factors, reduce losses
19 What gets measured gets MANAGED? Peter Drucker 5/18/2012 Slide # 19
 The correct leading")
20 Shift Management Focus Toward Leading KPI s Push the lagging to the side, leading to the front The Goal: Use Leading Metrics to drive performance Focus on leading but still require a measure of the outcome (lagging) The correct leading metrics
 Low Medium High Target 50% 75% 100% Red <40% <65% <90% Yellow Green 40%-49% >=50% 65%-74% >=75% 90%-99% >=100% Most typical starting")
21 Traffic-lights: Benchmarks or Weighted Scale Benchmarks Industry-specific Membership-wide Internal for large company Company-specific scale Risk-based or consequence-based Matrix of targets / ranges (example below) Low Medium High Target 50% 75% 100% Red <40% <65% <90% Yellow Green 40%-49% >=50% 65%-74% >=75% 90%-99% >=100% Most typical starting point


22 Approach: Manage the Practical Leading KPI s Owned by Line Managers Analyzed by Leadership Committee choose short list of stewarded KPI s practical, acceptable to management calculated / monitored on monthly basis accountability cascaded throughout operations leadership Keep it simple for today. reviewed only by exec steer committee looking for interesting trends calculated / monitored on quarterly basis consideration as future managed KPI s Iterate / review benchmarks / evolve KPI s But prepare to evolve tomorrow.

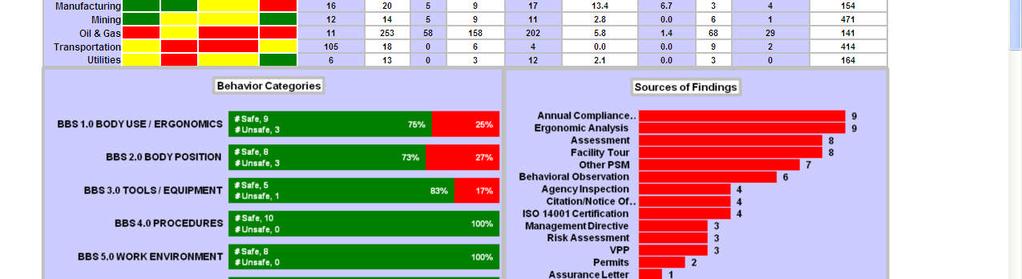
23 Example Dashboard
24 Summary Determine what to measure for your company KISS principle Obtain management buy in and commitment
25 Content: Reporting Culture An Advanced Consideration Near Miss Quality % of near misses with risk rating of medium or higher Measures risk reduction opportunity afforded by near misses Example Matrix of actual consequence to risk potential Safety triangle metrics Near miss as % of total incidents Near Misses Recordable > Recordable Total Low Risk Med Risk High Risk (Recordable as % of total events) Proactive events as % of total events Other relevant metrics % of workforce involved in reporting Compare sites with equal near miss quantity Site A (above): Near miss = 348 % med risk = 30% Site B: Near miss = 348 % med risk = 2% Rate of total events reported per total hours worked Distribution of workforce involved Studied dozens of other reporting culture metrics Better Quality of Near Misses (more risk reduction opportunity) Slide # 25

26 Content: Action Item Management An Advanced Consideration All actions are not created equal Actions from source events with varying risk-level Measuring risk reduction contribution % completed weighted by risk of source event Sample scale Actions from high risk weight of 10 Actions from med risk weight of 5 Actions from low risk weight of 1 Metrics % of high priority actions completed prior / equal to due date Other relevant metrics % of total actions completed on-time % of events with action Example comparison of 2 sites Site A Raw % on-time = 80% But skewed toward easier actions from low-risk events Weighted % on-time = 52% Site B Raw % on-time = 80% A focus on completing actions from higher-risk events Weighted % on-time = 92% Rate of completed actions from med- high risk items per total hours worked Studied dozens of other action item metrics Better Quality of Action Items Slide # 26

27 Content: Leadership and Process (Advanced) Leadership / process execution Measuring expected organizational behavior per operational risk processes Example metrics Accountability for action Avg days to sponsor accept 1st action Responsiveness to reported items Avg days for supv to validate reported items Discipline to perform incident cause analysis % of incidents with root causes identified Reaction to escalation of late action items Other relevant metrics % of total duration for lateness of actions Ratio of line leader to HSE approvals % of proactive events with leaders involved % of actions with SME / leader validation % of total events with risk matrix (score) Studied dozens more. Use an index to avert gaming Mix of leadership and process metrics Capture overall leader commitment and process discipline An Advanced Consideration Leadership-driven Committee of operational and HSE leaders Bi-monthly review of advanced metrics Educate / promote desired results Annual performance planning Review benchmarks, performance of both managed and advanced metrics Consider promotion of advanced metrics to managed KPI scorecard Slide # 27
28 Thank You!! Kip Carter Solution Engineer IHS, Inc. For more information me