Using Hoshin Kanri & Baldrige to Improve Performance
|
|
|
- Hilary McKinney
- 5 years ago
- Views:
Transcription
1 Using Hoshin Kanri & Baldrige to Improve Performance

2 Excellence Award 2013


3 Notable Strengths Use of Hoshin Management by Fact Culture of Problem Solving and CSI
4 Our Vision Winona Health will be a recognized leader in the revolutionary transformation of community healthcare. Our Mission Devoted to improving the health and well-being of our family, friends, and neighbors. Our Aims Enhance the patient/resident experience Improve health/outcomes Reduce/control costs

5 Integrity We do no harm. Our Values Service We serve with compassion, dignity, and respect. Loyalty We build relationships that exceed expectations. Excellence We improve performance through learning and innovation.


6 About Winona Health o >60 physicians and associate providers o 13 specialties o >1,100 employees o 425 volunteers o 99 bed Hospital o 140 bed SNF o 61 unit assisted living o 20 unit Memory Care assisted living o 3 Pharmacies


7 Baldrige Healthcare Criteria and CSI Cat. 1 Leadership CSI Process is leadershipdriven Cat. 2 Strategic Planning Drives the success of CSI initiatives Cat. 3 Customer Focus Identifies value in the eyes of the patient & resident Cat. 4 / 7 Meas., Analysis & Knowledge Mgmt / Org. Results Utilizes data to drive improveme nt Cat. 5 Workforce Focus Engages and empowers employees to drive process improvement Cat. 6 Operations Focus Improves work systems to achieve better performance & reduce variability

8 CSI as a Strategy Transforming our Culture Focus on Principles of: Customer Value Value Streams Flow and Pull Empowered People Seek Perfection Principles apply everywhere Belief this strategy is key to a successful future for continuously transforming our culture at Winona Health
9 WH s Lean Management System
10 What is Hoshin Kanri? o Hoshin means compass needle or direction o Kanri means management or control o Hoshin planning aligns an organization toward accomplishing a set of goals. o Discipline of Hoshin Kanri: o Focused on shared goals o Goals communicated to all leaders o All leaders involved in planning to achieve the goals o Accountability to all participants for achieving their part of the plan Walk the walk and talk the talk
11 Hoshin Kanri = Strategy Deployment o Hoshin Kanri Leadership Driven o Level 1- Organization True North/3 year Strategic Goals o Level 2 Service Line or Support Area o Level 3 Value Streams/Departments o Statement Linkage from is the Level 1 to Level 2 to Level 3 CONSTANT GUIDE o Catchball between all levels for the Team o FOCUS Board Daily Metrics

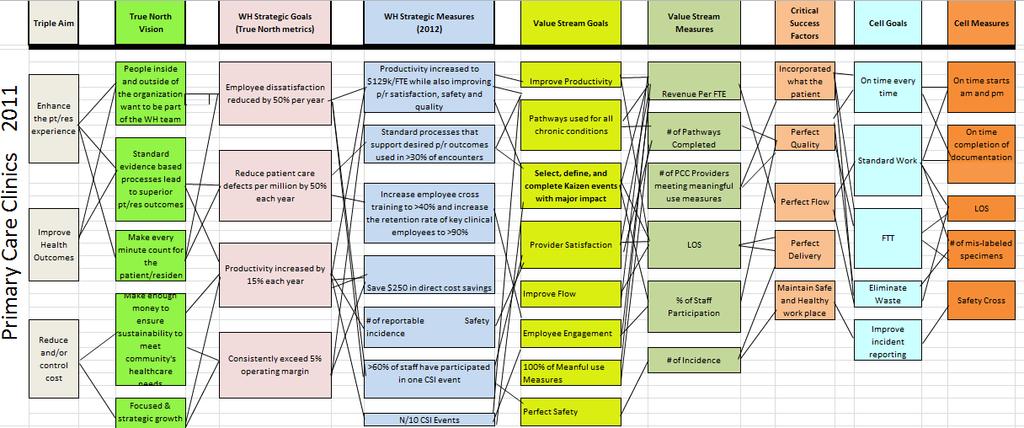
12 Hoshin Kanri Level 1
13 Catchball Process o BOD/CEO/Service Line Leaders/Directors/Mgrs Group o Discussions between Leadership levels o Need to limit the How /# of Tactics o Level 3 catchball includes frontline staff o Improves ownership/engagement at all levels o Integrated goals/metrics cascade from Level 1 - Level 3 and then to FOCUS Boards o Alignment and focus

14 Hoshin Kanri Cascade
15 Linkage Validation
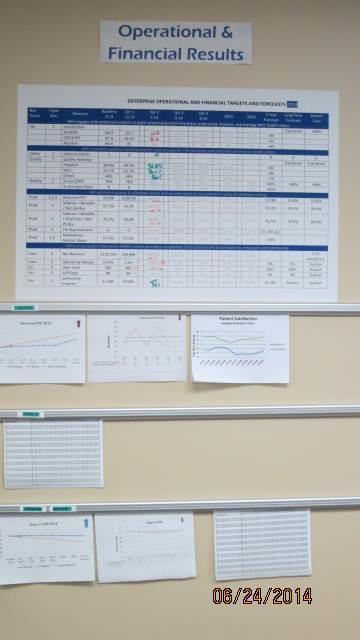
16 Level 1 Box Score Forecasting ENTERPRISE OPERATIONAL AND FINANCIAL TARGETS AND FORECASTS 2014 Box Score Triple Aim Measure Baseline 9.13 Qtr Qtr Qtr Qtr Year Forecast Long Term Forecast Stretch Goal WH engages with patients/residents to build relationships that help them understand, improve, and manage their health status. Sat 1 Satisfaction: Top Decile 100% HCAHPS >95 CGCAHPS >95 Resident >95 WH s standard evidence based processes lead to superior P/R outcomes and improved community health status. Safety 2 Adverse Events Quality 2 Quality Ranking: Top Decile Top Decile Hospital 89.9% 89.9% 91.1% 92.3% 93.5% 93.5% >95 WSS 63.2% 63.2% 66% 68.8% 71.6% 71.5% >80 Clinics 44% 44% 49.6% 55.2% 61% 61% >70 Quality 2 % Use CPOE 78% 78% 78% 80% 80% 80% 85% >85% >90% >90% % Use Care Plans >40% >50% >60% >75% >80% We work as a system to eliminate waste and provide value to our customers using A3 problem solving. Prod 1,2,3 Revenue/FTE Prod 3 %Labor/Rev Prod 3 1% Improvement Prod 1,3 Ambulatory Market Share WH is a successful community health system providing competitive Total Cost of Care to our patients, employers and community. Cost 3 Net Revenue 2.5% annual inc Cost 3 Operating Margin 3.53% 1.9% 2.29% 2.3% 1.87% 3.0% 4% 4% 5% Sustain Fin 3 Days Cash Sustain Fin 3 A/R Days Sustain Fin 3 Generosity Inspires Sustain Sustain
17 Metrics Annual Target Quarterly Target Box scores Support/Service Line: Community Engagement Date/Period: Q Current Quarter Performance by Month Previous Quarter Performanc e Current Quarter Forecast Current Quarter Actual January February March Current Full Year Forecast QUALITY Adherence to Generosity Map* 100% TBD - - TBD SATISFACTION Would you recommend? Primary Care Clinic 90.63% 88.30% 87.20% 89% 89.30% 88.50% 89% 89.30% 91% Speciality Care Clinic 90.88% 87.52% 87.80% 88.63% 89.40% 87.90% 86.50% 89..4% TIME/PRODUCTIVITY Increase # of Volunteers by 10% Increase # of Donors by 25% FINANCIAL Net Revenue per FTE Minimum Contribution Targeted Improvement Year To Date Progress
18 Mgmt by fact...what is missing?

19 Proposal A3 s o Proposal A3 s-all levels of Hoshin HOW o What tactics we use to accomplish breakthrough objectives and how do you measure for success o Started by leader / finished by area o Burning platform o Also used for CPR s presented to CEO/CFO
20 Proposal A3 Business Case Future State Action Plan Current State/Gap Measurement/Results
21 Visual Management Enterprise o PDCA Enterprise Level o Plan o Hoshin Level 1 and Level 2 s o Proposal A3 s from level 1 Hoshin o Long term goals and forecast o Do o Proposal A3 s from all level 2 Hoshin o Check o Std Box Scores with Charts/Graphs not meeting target o Act o Follow-up Course Corrections
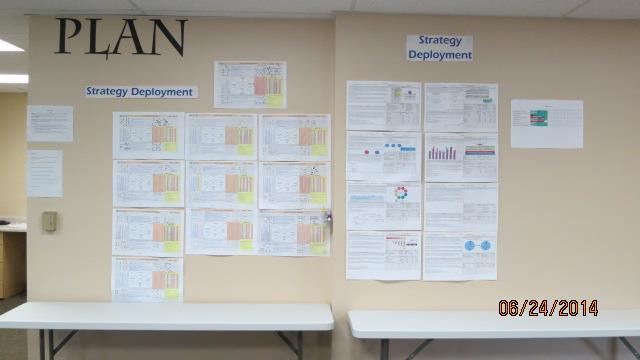
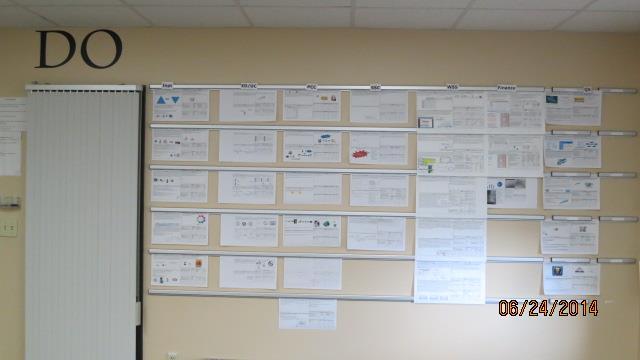
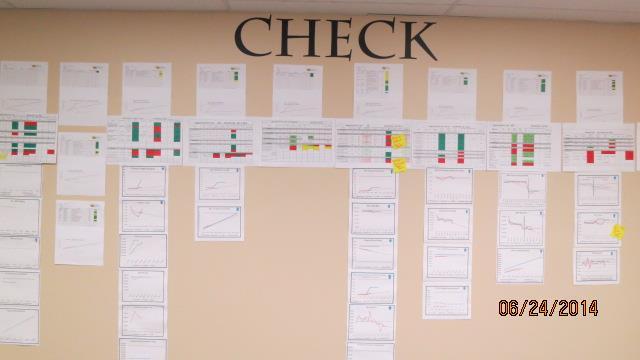

22 Enterprise Obeya PDCA
23 Visual Management- SL and Dept PDCA Boards Level 2 and 3 o Hoshin o Proposal A3 s o Box Score o Course correction based on fact o Reviewed weekly, monthly - transparent


24 PDCA Board Weekly/Monthly
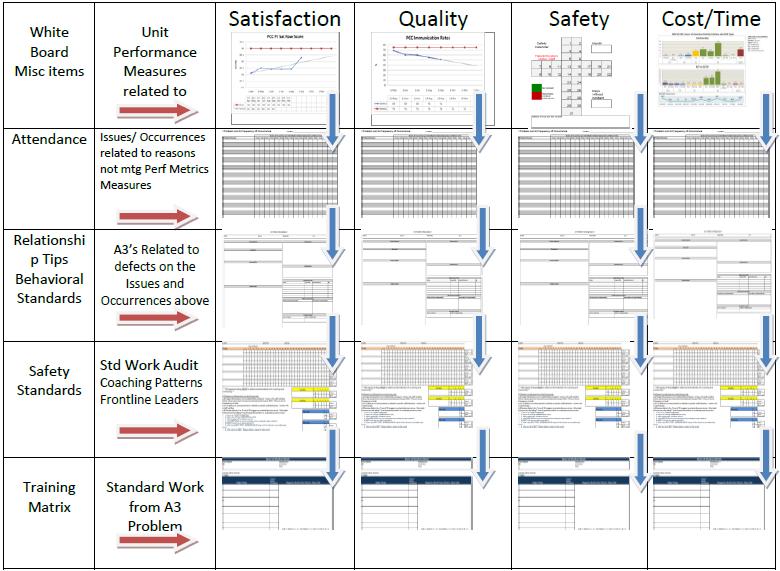
25 Visual Management FOCUS Boards o FOCUS Boards- daily/every shift- every dept. Frontline metrics Based off Hoshin L3 Problems and Occurrences A3 Problem solving Audit and sustaining Behavioral Standards/Relationships Std Work Scorecards
26
27 Management by fact. CGCAHP S All Clinics Combined Oct Nov Dec Jan. Feb. Mar. Apr. May June July August Sept FINAL Actual 79.95% 80.60% 81.80% 82.80% 81.70% 81.20% 81.30% 81.00% 79.50% PrimaryFor ecast % 79.70% 80.07% 80.44% 80.83% 81.18% 81.55% 81.95% 82.32% 82.69% 83.08% 83.08% Actual 78.20% 80.40% 82.00% 84.40% 80.50% 83.00% 82.30% 83.90% 81.50% SpecialtyFo recast 78.16% 78.52% 78.90% 79.28% 79.66% 80.03% 80.41% 80,79% 81.15% 81.53% 81.90% 82.28% 82.28% Actual 80.90% 82.70% 84.80% 84.40% 83.70% 79.20% 77.80% 79.60% 78.00% A1C Goal <8 state avg 74% LDL Diabetic 5 Quality Report LDL Goal <100 mg/dl; state avg 64% Aspirin Aspirin Goal-on Aspirin state avg 100% BP BP State Goal <140/90; state avg 84% 2014 criteria Smoking Goal- no smoking state avg 84% No Monthly 2014 A1c Smoking D5 % January 77% 68% 89% 80% 80% February 67% 67% 86% 76% 90% March 85% 68% 86% 85% 87% Qtr 76% 68% 87% 80% 86% April 66% 69% 90% 83% 86% 42% May 62% 68% 87% 77% 87% 27% June 66% 70% 88% 86% 87% 41% Qtr 65% 69% 88% 82% 87% 37% July 68% 67% 89% 86% 87% 41% Year Avg Goal is 39% Monthly D5 Avg 39%
28 Frontline Daily Problem Solving o Trained coaches and problem solvers o Frontline FB group A3 s all staff trained o Better engagement/empowerment o All leadership trained in coaching o >50% of problem solving related to Hoshin
29 Standard Work o Standard work at the frontline o Based on risk, volume and improvements o Critical to quality steps on a scorecard audit o Improves outcomes and quality o Process stable prior to improvement o Decreases variability
30 Score cards 4 Patterns LSW: Month: Name: Day of Month Daily Target Passes Total Observations Passes Total Observations Passes Total Observations Passes Total Observations Passes Total Observations ***All negative findings MUST be addressed immediately with coaching and mentoring.*** 4 Patterns to Observe for on the Scorecard: a) Target observations not completed by assigned - review with staff member b) An observation item has been positively performing at 100%- Move to lower frequency of audit c) 1-2 defects in a measurement is related to specific staff behaviors.- review with staff member d) Greater defects (i.e. 5 out of 10) suggest a systemic/process issue. Why might the process be failing? Use the questions below to evaluate process issues: 1. What is the TARGET CONDITION? 2. What is the ACTUAL CONDITION?(use data) 3. What is going well? (celebrate success) 4. What OBSTACLES are now preventing you from reaching the target condition? (PARETO with data, how did you priortize?) 5. What is your NEXT STEP? (PROBLEM SOLVE using an A3 the obstacle are you addressing now) 6. What can I do to HELP? (Remove barriers, connect to other areas) Weekly Weekly Target Target Monthly Target 1 Monthly Target 1 2. Response to pain medication documented. Target: 10 out of 10 observations Passes Total Observations Passes Total Observations Passes Total Observations Passes Total Observations
31 Coaching to 4 Patterns o Audits NOT performed o 20% rate of adherence o 80% rate of adherence o Standard work followed 100%
32 Leaders Standard Work o Leaders Standard Work cascaded up from frontline leaders scorecards to the CEO o Daily, weekly and monthly audits o Done with a score card/lsw checklist o Gemba walks/rounding o Coaching and Mentoring- 4-Patterns o Visual Board Rounding o Accountability
33 Talent Training o Leadership Academy o Director/SL weekly meeting o Manager s Meeting o Technical vs. Adaptive training o Problem Solving o Coaching o FOCUS Board A3 training o Started with CSI WH LMS o CSI Hoshin


34 Deployment True North FB Daily Metrics 3 Year Strategic Goal Process Improvement Breakthrough Objectives SL Tactics Breakthroug h Initiatives
35 EDUC Breakthrough Initiative: Drive significant improvement in SL box scores Tactic: Implement and audit use of daily standard work/a3 problem solving/results Metrics: Improve patient satisfaction from 89.9 to 92.5 by 12/14 Cost Reduction FOCUS Board: A3 work Decision to admit Quality metric Track every patient time to admit Std work after CIP audited by Gemba Coordinators < 30 minutes current rate is 83% A3 on ED Staffing Staffing model improvement with transparent tracking of OT All OT is tracked by individual/shift reviewed daily at FB Defects tracked and addressed
36 % Time Goal Achieved Decision to Admit % 80.00% Decision to Admit WH Goal < 30 Minutes 60.00% 40.00% 20.00% 0.00% Q1FY2014 Q2FY2014 Q3FY2014 Q4FY2014 Q1FY2015 Q2FY2015 Decision to Admit 73.67% 77.33% 81.00% Forecast 85.00% 85.00% 80.00% 80.00% 85.00% 87.00% Goal % % % % % % National average time from decision to admit to ED departure = 82 minutes WH Health average time = 26 minutes
37 WSS Breakthrough Initiative: Drive significant improvement in SL box scores Tactic: Implement and audit use of daily standard work/a3/results Metrics: Reduce Resident falls with injuries Cost Reduction FOCUS Board: A3 work Falls from injury Quality metric Track every resident falls with injuries each shift RCA on each fall prioritized work around occurances A3 on LWM Staffing Staffing model improvement with transparent tracking All OT is tracked by individual/shift reviewed daily at FB Defects tracked and addressed A3 or JDI
38 % Patients with Falls Quarterly Targets and Goal 60.00% Resident Falls 55.00% 50.00% 45.00% 40.00% Q1FY2014 Q2FY2014 Q3FY2014 Q4FY2014 Q1FY2015 Q2FY2015 % Falls 52.30% 50.93% 52.45% Forecast 52.80% 52.80% 52.80% 52.00% 50.00% 49.00% Goal-Nat'l Avg 44.40% 44.40% 44.40% 44.40% 44.40% 44.40%
39 SSC Breakthrough Initiative: Drive significant improvement in SL box scores Tactic: Reduce supply chain costs by 19% = xxx$ Metrics: Cost Reduction $$$$ with goal FOCUS Board: Track opened unused surgical supplies - waste Std work after CIP audited by Gemba Coordinator Daily defects in process tracked and improvement work based on priority Cost savings dollars saved-cost avoidance
40 Inpatient Breakthrough Initiative: Drive significant improvement in SL box scores Tactic: Drive significant problem solving by frontline staff using Kaizen, 5S, A3 and 3P Metrics: Maintain > 98% compliance in CMS measures (<20000 DMP) FOCUS Board: Care Coordination detailed by pt Pneumonia, AMI, CHF, SCIP, Outpt AMI Cardiac Care Reviewed twice a day for adherence/course correction Care Coordination Nurse EMR hard stops Std Wk Power Plans Team Providers/Nurses/Pharmacy/Social Workers/etc. Process improvement posted on FB with transparent audits Review every shift

41 Questions? is the CONSTANT GUIDE for the Team