Regions Charting New Directions:
|
|
|
- Laurence Lester
- 5 years ago
- Views:
Transcription

1 Regions Charting New Directions: Metropolitan Business Planning South Bend Economic Summit June 21, 2012 Robert Weissbourd
2 Agenda Drivers of the Next Economy Metro-Economics Metropolitan Business Planning (from theory to practice) Understanding Your Economy Key Lessons and Discussion


3 The Global Economy is Undergoing a Fundamental Transformation, Driven by Knowledge Assets GDP Growth, % Change 600% 500% 400% 300% 200% Human Capital Information technologies Product innovation; flexible customization Firm, consumer and knowledge networks Increasing returns; divergence 100% 0% $s lbs Source: Greenspan Weighs Evidence and Finds a Lighter Economy, Wall Street Journal 3
 21.4% BIC Countries 20.")
4 GRP Growth Sources: Newsweek, Manyika, Lund and Auguste, From the Ashes, ; Brookings Institution As a Result, the Economy is More Dynamic -- and Global Years Spent on the S&P Index 1920s 1990s Global GDP (2010) 21.4% BIC Countries 20.2% US Churn and GRP Growth by MSA 100% 80% 60% 40% 20% 0% 15% 20% 25% 30% 35% Firm Starts and Closures (Churn) as % of All Firms Global GDP (2015) 25.8% BIC Countries 18.3% US


5 and Centered in Metropolitan Areas Gross Metropolitan Product, % 75% 75% Top 100 Metros Share of U.S. Total 92% 78% 79% 76% 94% 66% Population Gross Product Service Exports Graduate Degrees Wind + Solar Energy Employment Patents U.S. Air Cargo Weight Airline Boardings Venture Capital Funding Sources: Brookings analysis of US Census Bureau, FAA, BLS, NIH, NSF, and BEA data; Brookings, ExportNation, 2010 (2008 data); Forthcoming research from Brookings and Battelle
6 Agenda Driver s of the Next Economy Metro-Economics Metropolitan Business Planning (from theory to practice) Understanding Your Economy Key Lessons and Discussion
7 How Metro Economies Grow Metro economy = total value of goods and services produced in the region Growth is inherently business sector growth (number, size and profitability of firms) Business sector grows through firm creation, growth and location decisions (retention and attraction) Firm creation, growth and location depend upon increases in efficiency and productivity (of firm and system, including product innovation) Core Question: What attributes of the region increase efficiency and productivity, leading to business sector growth?
8 8 What Makes Metropolitan Regions more Productive in the Next Economy? New Growth Theory Economic Geography Institutional Economics


9 Metros Can Enable People and Firms to Concentrate and Achieve Efficiencies New Growth Theory Institutional Economics Economic Geography Act Comprehensively The Whole is Greater than the Sum of the Parts. Customize and Build on Distinctive Assets. Develop Institutional Capacity and Intentionality. 9


10 10 Five Market Levers Drive Regional Economic Performance Create Effective Public & Civic Culture & Institutions Enhance Regional Concentrations/ Clusters Leverage Points for Sustainable and Inclusive Prosperity Deploy Human Capital Aligned with Job Pools Increase Spatial Efficiency Develop Innovation- Enabling Infrastructure


11 Leverage Points for Sustainable and Inclusive Prosperity poverty has no causes. Only prosperity has causes. Analogically, heat is a result of active processes; it has causes. But cold is not the result of any processes; it is only the absence of heat. Just so, the great cold of poverty and economic stagnation is merely the absence of economic development. It can be overcome only if the relevant economic processes are in motion. -- Jane Jacobs Photo from Shelf-Basin Interactions
12 Wage Growth ( ) Equity and Opportunity are Good for Business Neighborhoods and Regions Move in Tandem Variation of appreciation trends across neighborhoods, King County Poverty Rate (1990)
13 The Pieces of Economic Development


14 Succeed or Fail In Context of Each Other Infrastructure Entrepreneurship Business Development Housing Sustainability Workforce Training


15 New Approaches for the Next Economy 15
16 Agenda Driver s of the Next Economy Metro-Economics Metropolitan Business Planning (from theory to practice) Understanding Your Economy Key Lessons and Discussion


17 Metropolitan Business Planning: A New Way of Doing Business Grounded in Economics and Business Comprehensive, Actionable Strategies NOT Plans Enterprises Continuous Process and Improvement
18 Business Planning: A Proven Discipline for Comprehensive, Effective Action Identify regional assets/opportunities Develop customized strategies Turn strategies into concrete actions Build institutional capacity Execute Metropolitan Business Planning Regional Economy Mission and Vision Market Analysis Identify Strategies and Goals Specify Products, Services and Policies Operational Planning Financial Planning Performance Monitoring


19 Pilot Metro Business Planning Regions


20 Metropolitan Business Plans in Action Northeast Ohio Partnership for Regional Innovation Services in Manufacturing ( PRISM )

")

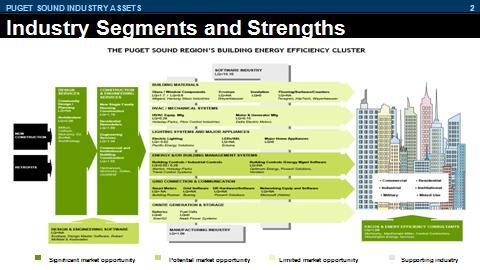
21 Metropolitan Business Plans in Action Puget Sound (Seattle) Building Energy-Efficiency Testing and Integration Center (BETI)
22 Developing Institutional Capacity Engage stakeholders across public, private and civic sectors Iterate analysis/strategy and institutional development High-level (e.g., C-suite) leadership group/steering committee Day-to-day (staff-level) working teams Expert/business/practitioner teams for specific strategies and initiative development Strategy is coordinated; Implementation is distributed Steering Committee Strategy 1 Team Strategy 2 Team Strategy 3 Team Strategy 4 Team Initiative 1B Initiative 1A Initiative 2A Initiative 3A Initiative 4A Initiative 4B
23 Agenda Driver s of the Next Economy Metro-Economics Metropolitan Business Planning (from theory to practice) Understanding Your Economy Key Lessons and Discussion

24 Understanding the South Bend Region s Economy South Bend MSA Rest of Michiana
25 The Big Picture: Restructuring? Real GRP/GDP (Indexed to 2001) $85,000 $75,000 $65,000 Productivity (Output per Worker) $55, Employment (Indexed to 2000) $55,000 $45,000 $35,000 Average Annual Wage $25, South Bend MSA USA All Metros Source: Bureau of Economic Analysis; Bureau of Labor Statistics
26


27 Concentration Analyzing Clusters Current Concentrations: Assets, Legacies and Bets Cluster Dynamics and Drivers Cluster Organization Growth Cluster Map Source: Bo Heiden, Strategic Uses of the Global Patent System
 Manufacturing Concentrations in primary and fabricated metals, machinery, electrical, chemical, transportation equipment, plastics Connections to nearby orthopedic devices")
28 Concentration in Region Opportunities to Target, Redeploy Legacies? (3-digit NAICS, employment) Manufacturing Concentrations in primary and fabricated metals, machinery, electrical, chemical, transportation equipment, plastics Connections to nearby orthopedic devices and RV/manufactured housing clusters? Specific sub-segments growing? Assets Education Leverage university strengths to support private sector? Communications Technology High employment growth; High LQ; high wage; high productivity; low absolute employment Biotech/Life Sciences Tie in with hospitals or Notre Dame research? Growth industries that build on South Bend assets? Industry Growth Bets
29


30 Understanding Human Capital Dynamics Status, Attraction and Retention Segmentation, Skills Match and Labor Market Efficiency Opportunity and Mobility


31 High-end Production, Weak Retention 100.0% 80.0% 60.0% 40.0% 20.0% 0.0% Educational Attainment High School Diploma St. Joseph County Indiana USA Bachelor's % Growth in Population, % -0.1% 16 Colleges and Universities High Production of Human Capital 40% 30% 20% 10% 0% Management + Professional Occupation Share, 2010 Service Sales + Office Natural Resources, Construction + Maintenance Production, Transportation + Material Moving South Bend MSA Indiana USA South Bend MSA USA Skills mismatch? Which jobs/ industries will help retain recent grads?
32

33 Cultivating Innovation Innovation Pipeline Cluster-based innovation Innovation ecosystem Finance R&D Innovation Ecosystem Manufacturing Market Research Marketing


34 Weak Indicators Across Pipeline Increase university commercialization? Explore cluster-based innovation opportunities?
35


36 Enhancing Spatial Efficiency Urban Growth Form Connectedness and Mobility


37 Strong Transportation Assets and Relatively Dense South Shore Line South Bend Airport TRANSPO St. Joe Valley Metronet Residential Density Employment Density Connections across broader region? Jobs-housing mismatch? Broadband Density, 2009 USA 700 Indiana 500 South Bend MSA 463 Source: Center for Neighborhood Technology, Housing + Transportation Index; Innovation Index, Stats America
38


39 Achieving Good Governance Fragmentation Tax/Value Proposition Governance GDP Per Capita vs. Sales Tax Rate (Illustrative) 70,000 60,000 50,000 40,000 30,000 20, % 6.00% 8.00% 10.00%
 onerous for businesses? Alignment of ED programs, organizations? Govt 2.")
40 Compete on High Value instead of Low Costs Services/initiatives that might be efficiently coordinated, streamlined? Most important public goods and services to industry, residents? Quality of these? Regulatory processes (permitting, licensing, inspections, etc.) onerous for businesses? Alignment of ED programs, organizations? Govt 2.0: engaging firms and citizens, transparency, flexibility, use of public data for economic growth,?

 Predevelopment barriers (assembly,")
 Assets Targeted, employerdriven workforce")


41 Illustrative Strategy Development Potential Strategy Challenges & Opportunities Industry Innovation Center of Excellence (advanced medical manufacturing) Predevelopment barriers (assembly, product and market development, etc.) Assets Targeted, employerdriven workforce training Strong research assets at Notre Dame, esp. in Microsensing Biomedical Diagnostics and Nanotechnology Proximity to Warsaw s Medical Devices cluster Legacy manufacturing assets and human capital in need of redeployment
42 Agenda Driver s of the Next Economy Metro-Economics Metropolitan Business Planning (from theory to practice) Understanding Your Economy Key Lessons and Discussion

43 Economic Development in the Next Economy Global, Knowledge Economy Specialization and Dynamism Intentionality Build on Your Assets Coordinated, Cross- Sectoral, Flexible, Adaptive, Open, Information-Rich, Inclusive, Entrepreneurial Compete on Value-Added (not low-cost)
44 DISCUSSION

45 Regions Charting New Directions: Metropolitan Business Planning South Bend Economic Summit June 21, 2012 Robert Weissbourd