FLEXIBLE AUTOMATION AND THE LOSS OF POOLING SYNERGY
|
|
|
- Belinda Francis
- 5 years ago
- Views:
Transcription
1 FLEXIBLE AUTOMATION AND THE LOSS OF POOLING SYNERGY Jannes Slomp and Durk-Jouke van der Zee Faculty of Management and Organization, Production Systems Design Group, University of Groningen, The Netherlands September 2001 SOM-theme A Primary processes within firms
2 ABSTRACT This paper focuses on the effects of flexible automation on the performance of a job shop. Flexible automated machines may significantly improve the delivery performance and the flow time of jobs. The insertion of a flexible automated system in a job shop, however, also has a counter effect on the manufacturing performance. This is caused by the reduction of pooling synergy due to the dedication implied by flexible automated machines. This paper investigates by means of a simulation study to what extent the loss of pooling synergy will deteriorate job shop performance. Simulation is also used to indicate the level of efficiency of the automated machinery needed to overcome the negative effect of the loss of pooling synergy. The simulation study also highlights the importance of appropriate off-line assignment rules, which assign jobs to either the conventional or automated machines. Major conclusion of this paper is that the pooling loss effect should be taken into account in the design and justification of new flexible automated machinery. The design of appropriate offline assignment rules, furthermore, has to be seen as an integral part of investment in new technology. KEYWORDS: Flexible Automation, Pooling synergy, Simulation - 2 -
3 1. INTRODUCTION In comparison with conventional machines, flexible automated machines are more efficient (faster production, less human involvement), more flexible (lower setup and changeover times), and have a higher level of integration (more than one operation can be performed on a flexible automated machine). Flexible automated machines can offer a firm important advantages in terms of more efficient production, shorter throughput times, lower stocks, and higher quality of work. The realization of these advantages, however, is not obvious. An almost endless list of reasons can be given as to why firms did not realize the original objectives with their automated machines. A fundamental problem of the insertion of an automated manufacturing system in a job shop, which is highly neglected in literature, concerns the loss of pooling synergy due to the dedication implied by flexible automated machines. Pooling loss refers to the reduction of routing flexibility due to the dedication of elements of the manufacturing system. Flexible automated machines require substantial preparation times because of the need for fixture plans, CNC programs, special tools, and such. This preparation time forces a process planning department to assign operations to either flexible automated equipment or conventional machines without having detailed insight in the actual workload fluctuations. The dedication of operations to machine types causes a loss of pooling synergy, which has to be compensated by the distinguishing characteristics of the automated machinery. This paper investigates by means of a simulation study to what extent the introduction of automated machines may lead to a loss of pooling synergy and how much extra efficiency of the automated machines is needed to overcome the loss of pooling synergy. The loss of pooling synergy due to dedication is not a new phenomenon in literature. Several authors have compared functional and cellular layouts in manufacturing and found that the loss of pooling synergy is a serious problem in a cellular layout. Johnson and Wemmerlöv [1] present a comprehensive paper on this subject and give a meta-analysis of the results of 24 simulation studies on this topic. They conclude that whether cellular layouts outperform their functional counterpart depend on the interaction between several factors such as the degree of pooling, the utilization level, the setup time reductions in cellular layouts, and the lot sizes used. These factors will likely also play a role in studying the effect of flexible automation on the performance of a manufacturing system. In our study we will distinguish three levels of pooling degree (three alternative configurations). We will study - 3 -
4 the effect of arrival rate and processing rates (which determines the utilization level) on the degree of pooling loss. Set up time reductions, which may play an important role in automation projects, will be incorporated in an efficiency factor which indicates the reduction of processing time (including setup time) due to automation. We assume a maketo-order situation. The possibility of lot size reduction, due to shorter setup times, is not regarded in our simulation study. In a make-to-order situation, lot size reduction is usually not a feasible option. Studies on the loss of pooling synergy due to dedication, as reported by [1], solely focus on flow time performance of the functional layout and the cellular layout system. In our study, we also incorporate due date related performance measures. This will provide more insight on the effect of (the loss of) pooling synergy on the performance of a job shop. In section 2, we will explain our experimental design. Section 3 is devoted to the results of the simulation study. Section 4 concerns the main conclusions of our study. 2. EXPERIMENTAL DESIGN The basis of the experimental design concerns three machine configurations, see Figure 1. Configuration (i) a functional layout with two departments, Dept.A and Dept.B. Each departments concerns four identical machines, of respectively type A and type B. Jobs have to undergo two sequential operations, one at a machine of type A and one at a machine of type B. Configuration (ii) a functional layout with two departments, Dept.A and Dept.B. The configuration is equal to the first one, with the only difference that one machine in Dept.A is replaced by an automated machine. The presence of an automated machine implies dedication of jobs to machine types and asks for an off-line assignment rule. This means that, at the offline stage, parts need to be assigned to either the automated machine or the conventional machines. Configuration (iii) a functional layout with two departments, plus two integrated automated machines. The configuration is equal to the first one, with the differences that a machine of Dept.A is replaced by an automated machine and another machine of Dept.A and a machine of Dept.B are replaced by integrated automated machines which are able to perform A and B operations. For all three automated machines in configuration (iii), off-line rules are needed to assign jobs either to the automated machine or to the conventional machines
5 The three configurations offer the possibility to study the loss of pooling synergy due to automation and the effect of typical characteristics of automated machinery to overcome the loss of pooling synergy. Also, simulating the three configurations can highlight the importante - 5 -
6
7 - 7 -
8 of developing appropriate assignment rules in case of implementing dedicated, automated machines. Table 1 gives the notation used in the remaining of this section. In each configuration, the manufacturing department will operate as follows. Jobs arrive according to a negative exponential distribution with a mean arrival rate of 8. Each job has to undergo an operation of respectively type A and type B. The processing time required for a job, at a conventional machine, is based on a 2-Erlang distribution, with a mean value of 1/:. The Erlang distribution is often used as a distribution function to represent operating times. We assume that setup times are included in the processing times of jobs. The processing times (and/or setup times) will be reduced in case of processing at an automated machine. The processing time of a job at an automated machine is also 2-Erlang distributed and has a mean p/:. The factor p is a reduction factor. Move times are neglected in our simulation study. Due dates are set according to the function: dd j = LN(eft j,0.5eft j )+A j = eft j LN(1,0.5)+A j, where eft j =(1/: ja +1/: jb )ftaf. This expression reflects the fluctuating nature of the due date in a make-to-order environment (see [2]). The factor ftaf indicates the due date tightness. Jobs are assigned off-line to either conventional and/or automated machines in configurations (ii) and (iii). The result of the off-line assignment can be expressed by the arrival rates at each entrance k (8 k, E k 8 k =8). Figure 1 shows the various entrances in configurations (ii) and (iii). The dispatching rule used in the system is the firstcome-first-served (FCFS) rule. The FCFS rule can be seen as a handy rule in practical environments. The performance of the manufacturing department is measured in terms of average job flow time, the average job tardiness and the percentage tardy jobs. To gain a dimensionless measure for the performance indicators, performance ratios are Table 1: Notation Symbols Meaning 8, 8 k Mean arrival rate of the whole department; mean arrival rate for entrance flow k :, : ja, : jb average service rate of a job at a conventional machine (1/: is the average processing time); service rates of job j at respectively a machine of type A, B D utilization of a station (=8 station /: station ) p LN(x,y) ftaf Processing time factor for automated machines Lognormally distributed random variable with a mean x and a standard deviation y Flow time allowance factor indicating due date tightness - 8 -
9 ddj Due date of job j FCFS First come, first served priority rule jlr, jlr k Job lateness ratio; job lateness ratio of jobs in entrance flow k ajl, ajl k Average job lateness; average job lateness of jobs in entrance flow k jfr, jfr k Job flow ratio; job flow ratio of jobs in entrance flow k aft, aft k Average job flow time; average job flow time for jobs in entrance flow k tjr, tjr k Percentage tardy jobs ratio; percentage tardy jobs ratio of jobs in entrance flow k ptj, ptj k Percentage tardy jobs; percentage tardy jobs of jobs in entrance flow k A j, C j Arrival time of job j; completion time of job j L j, L jk Lateness of job j (= F j -dd j ); lateness of job j belonging to entrance flow k NJ, NJ k Total number of jobs completed; total number of jobs completed in entrance flow k NT, NT k Number of tardy jobs; number of tardy jobs in entrance flow k introduced which relate the performance in a particular simulation to the performance in the reference-situation. The reference-situation in this simulation study concerns the conventional situation (configuration (i)) with parameters as depicted in the second column of Table 3. The situation is created such that on average a utilization of 70% (=8/4:) will be realized at all machines. Definitions of the performance indicators are given in Table 2. The simulation study is performed in two phases. Tables 3 and 4 present the parameter settings in phases 1 and 2. In all simulations, we assume a flow time allowance factor (ftaf) of 1.5. All phases refer to the three configurations presented before. In the first phase, we neglect the positive processing time effect of the investments (by giving p the value 1) and investigate solely the impact of the arrival and processing rate on the extent of the loss of pooling synergy. These factors have an exogenous character and are largely determined by the customers. Table 2: Simulation model dependent variables performance indicators Variable Definition Formula Job flow ratio (jfr) The ratio of average job flow time with the average - 9 -
10 job flow time in the reference-situation. jfr = aft/aft reference where F AV = G b (C j -A j ) / NJ Job lateness ratio (jlr) The ratio of the mean lateness of all the jobs with the mean lateness in the reference-situation jlr = ajl/ajt reference where ajl = G b max(0,l j ) / NJ Percentage tardy jobs ratio (ptj) The ratio of the percentage of tardy jobs with the percentage of tardy jobs in the reference-situation tjr=ptj/ptj reference where ptj = NT/NJ The assignment ratios for the various entrances phase 1 are given by the settings "=0.75 and $=0.25 for configuration (ii) and P=0.5, *=0.25,,=0.125, and N=0.125 for configuration (iii). This is equal to setting 3, p=1 in Table 4. The setting is chosen such that the average machine utilization of the machines needed for each entrance flow is equal for each flow. This is similar to the study performed by Shafer and Charnes [4]. The non-optimality of this setting will be discussed in phase 2 of the simulation study. Phase 1 gives insight in the environments in which dedication leads to extensive pooling loss. The second phase is devoted to the question to what extent the reduction of the processing time at automated machines contributes in reducing the loss of pooling synergy. The processing time reduction of automated machines is controlled in the simulation study by the factor p (see table 3). It is needed to link the setting of the value p and the assignment ratios; a change in the efficiency of the automated machines will ask for other assignment ratios (see table 4). Assignment ratios (setting 3 in table 4) are calculated in such a way that the average utilization of the machines needed for the various entrance flows is equal. In studying the interaction between the factor p and the various settings of the assignment ratios in table 4, we will get insight in the complexity and importance of setting good assignment ratios in case of investments in automated manufacturing technology
11 Phase 1 and phase 2 of this simulation study not only clarify the extent of efficiency needed to overcome pooling loss, they also indicate to what extent pooling loss will be influenced through the fact that many implementations of flexible automated equipment also imply an integration of processing steps, compare configurations (ii) and (iii). The software package EM-Plant (EM -Plant Ver. 4.6, Stuttgart: Technomatix) was used to carry out the simulation experiments. The principles of object oriented design underlying this language make it a flexible and efficient tool for model building. The performance for each
12 simulation experiment was estimated using the batch means method, see [5] or [6]. Each batch concerns 5,000 jobs. A total of 31 batches was considered for each experiment, where each first batch was discarded to account for any start up bias. Uncorrelatedness was tested using the runs test (see [5] or [6]. It showed no significant correlation, given a significance level of " = The relative width of the confidence interval for the average flow time is in
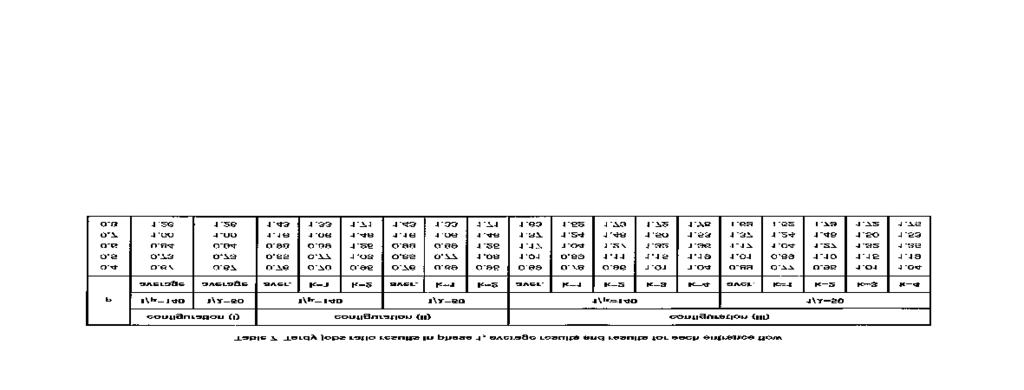
13 the order of % for situations with an average utilization up to 70% and % for an average utilization of 80%. The respective figures in case of average lateness and the percentage of tardy jobs are: %; % and %; %. 3. RESULTS Results of the simulation experiments are presented in tables 5 to 10, and figures 2 and 3. The performance ratios, as presented in the various tables and figures, relate the performance in a particular simulation to the performance in the reference-situation. The absolute performance in the reference situation (configuration (i), :=1/140, 8=1/50, ftaf=1.5) with respect to average flow time, average lateness and percentage tardy jobs is, respectively, , 54.99, and
14 Our simulation results indicate that the performance of the system is strongly dependent on the load of the system (i.e. the average utilization of machines). The load of the system is build up by the arrival rate (8) and the processing rate (:). Table 5 illustrates that the job flow ratio is

15
16 - 16 -
17 more sensitive to changes in the processing rate (or job size) than to changes in the arrival rate. This is also the case for the job lateness ratio (see table 7). In practice, this means that a higher utilization can be best realized by an increase of the arrival rate, while a lower utilization can be best realized though an decrease of the processing rate. Changes of the average utilization of a system can be realized through the selection of jobs to be produced on the system. It is interesting to note, from table 8, that the tardy jobs ratio is almost equally sensitive to changes in the processing rate and changes in the arrival rate, for all configurations. Further analysis is needed to explain this. In phase 1 we investigate the impact of dedication on the system performance. It can be deducted from tables 5 to 7 that the negative effect of pooling loss is relatively more in case of a high utilization level. Figure 2 relates the performance of configuration (ii) or (iii) with the performance of configuration (i) at various utilization levels (with 1/: = 140). Tables 5 to 7 also indicate the extent of performance deterioration in case of pooling loss. In case of an average utilization of 70% (D=0.7, 1/:=140), the average flow time ratios of configuration (ii) and (iii) are, respectively, 1.18 and Also the consequences of dedication for the average job lateness ratio (resp and 3.56) and the average tardy jobs ratio (resp and 1.37) are considerable. These consequences of dedication on the performance of the system are even more considerable for some of the entrance flows. Entrance flow 3 (which is more or less equal to entrance flow 4) in configuration (iii), for example, is facing an increase of the average flow time with 92% (flow time ratio=1.92), the lateness of jobs increase with 497% (job lateness ratio=5,97), and the number of late jobs increase with 50% (tardy job ratio=1.5). Improving the performance of some of the entrance flows asks for other assignment ratios. The effect of changing the assignment ratios is investigated in phase 2 of our simulation study. Tables 8 to 10 present some results from phase 2 of the simulation study. It is shown that a considerable efficiency of the automated machine is needed to overcome the pooling loss. The automated machine in configuration (ii) needs a processing time factor p of the automated machine of less than 0.8 in order to realize the same average job flow time as in the reference situation (see table 8). In configuration (iii) a processing time factor p of about 0.7 is needed to overcome the pooling loss. It should be noted that the smaller entrance flows in configuration (ii) and (iii) require a higher efficiency of the automated machines (i.e., a lower processing time factor p) in order to overcome the pooling loss
18 Pooling loss can be expressed by means of a reduction of performance in various indicators. It is interesting to notice that an improvement of the job lateness ratio and the tardy jobs ratio to the value of 1 requires a lower processing time factor (p) than in the case of a required improvement of the job flow ratio (compare tables 8, 9 and 10). Also here, the smaller entrance flows in configurations (ii) and (iii) require a lower processing time factor in order to overcome the pooling loss. Figures 3a and 3b give an indication of the effect of changing the assignment ratios. It is shown that the effect of changing the assignment ratios is relatively limited with respect to the average performance ratios (see figures 3a and 3b). It, however, does have considerable effect on the ratios of the various entrance flows. Figures 3a and 3b suggest that the assignment ratios especially do have a great impact on due date related performance criteria. Assignment setting 3 (table 4) concerns a balanced situation: assignment ratios are calculated in such a way that the average machine utilization for each entrance flow is equal. The results of phase 2 shows that it is not an optimal assignment rule. This result is in conformity with previous research on (un)balancing workloads for a system of pooled machines of un
19 equal sizes (see [6]). This research has shown, by using a stochastic closed network of multiserver queues (CNQ), that larger groups of pooled machines can be more heavily loaded than smaller groups of pooled machines while keeping the same job flow time performance. It is interesting to notice from tables 8 to 10 (and also figures 3a and 3b) that an average job flow ratio of less than 1 does not mean that due date performance related ratios are also less than 1. Furthermore, figure 3a and 3b indicate that the assignment setting with the lowest average job flow ratio is basically not equal with the assignment setting which takes care of the lowest job lateness ratio (or due date related performance criteria). Our simulations indicate that due date related performance criteria ask for more unbalance in the assignment ratios. 4. CONCLUSIONS
20 This paper shows that dedication, as a result of installing automated equipment in a job shop situation, may lead to a considerable worsening of manufacturing performance due to the reduced possibility to pool machines. Simulation results show that this effect is relatively larger in case of a high utilization level. The pooling loss, expressed in terms of performance reduction, may vary per entrance flow. Equalizing the performance of each entrance flow asks for setting appropriate assignment ratios. In our configurations, a considerable efficiency of the installed automated machines is needed to overcome the pooling loss. The required efficiency level also depends on the performance indicators used to measure the loss of pooling synergy. Compared with a flow time indicator, due date related performance measures ask for higher efficiency levels of the automated equipment. It is furthermore shown that due date related performance indicators are more sensitive to the setting of assignment ratios for the various entrance flows. The theoretical relevance of this paper concerns its focus on the pooling synergy effects of investments in new technology. Until yet, the role of pooling synergy has only been investigated in studies that compare functional and cellular layout systems. An additional contribution of this paper is the inclusion of due date oriented performance measures. Previous studies on the role of pooling synergy focus solely on the flow time performance of manufacturing systems. The practical relevance of this study is the message that the pooling loss effect should be taken into account in the design and justification of new flexible automated machinery. Furthermore, this study shows that the design of appropriate off-line assignment rules, furthermore, has to be seen as an integral part of investment in new technology
21 5. REFERENCES [1] D.J. Johnson and U.Wemmerlöv. On the relative performance of functional and cellular layouts an analysis of the model-based comparative studies literature, Production and Operations Management, Vol. 5, No. 4 (1996), pp [2] T.R. Rohleder and G.D. Scudder. A comparison of order-release and dispatch rules for the dynamic weighed early/tardy problem, Production and Operations Management, Vol. 2, No. 3 (1993), pp [3] S.M. Shafer and J.M. Charnes. Ofsetting lower routeing flexibility in cellular manufacturing due to machine dedication, International Journal of Production Research, Vol. 35, No. 2 (1997), pp [4] A.M. Law and W.D. Kelton. Simulation Modeling and Analysis, McGraw-Hill, Singapore (2000). [5] S.V. Hoover and R.F. Perry. Simulation - A Problem Solving Approach, Addison Wesley, Reading MA, (1989). [6] K.E. Stecke and J.J. Solberg. The optimality of unbalancing both workloads and machine group sizes in closed queuing networks of multiserver queues, Operations Research, Vol. 33, No. 4 (1985), pp