FDOT D7 Local Agency Traffic Safety Academy September 21, FHWA - Kevin Burgess, Chimai Ngo, Esther Strawder, and Jim Thorne
|
|
|
- Roy Powers
- 5 years ago
- Views:
Transcription


1 FDOT D7 Local Agency Traffic Safety Academy September 21, 2016 FHWA - Kevin Burgess, Chimai Ngo, Esther Strawder, and Jim Thorne
2 Presenters Kevin Burgess FHWA Florida Division Safety Engineer Chimai Ngo FHWA Headquarters Office of Safety Esther Strawder FHWA Headquarters Office of Safety Jim Thorne FHWA Resource Center Planning Team 2
3 Topics Chapter 1: Introduction Chapter 2: Audience & Purpose Chapter 3: Performance-Based Planning Processes Chapter 4: Data Collection Chapter 5: Using Safety Analysis for Planning Chapter 6: Applying Safety Data and Analysis to Inform Decision-making 3

4 Chapter 1: Introduction 4
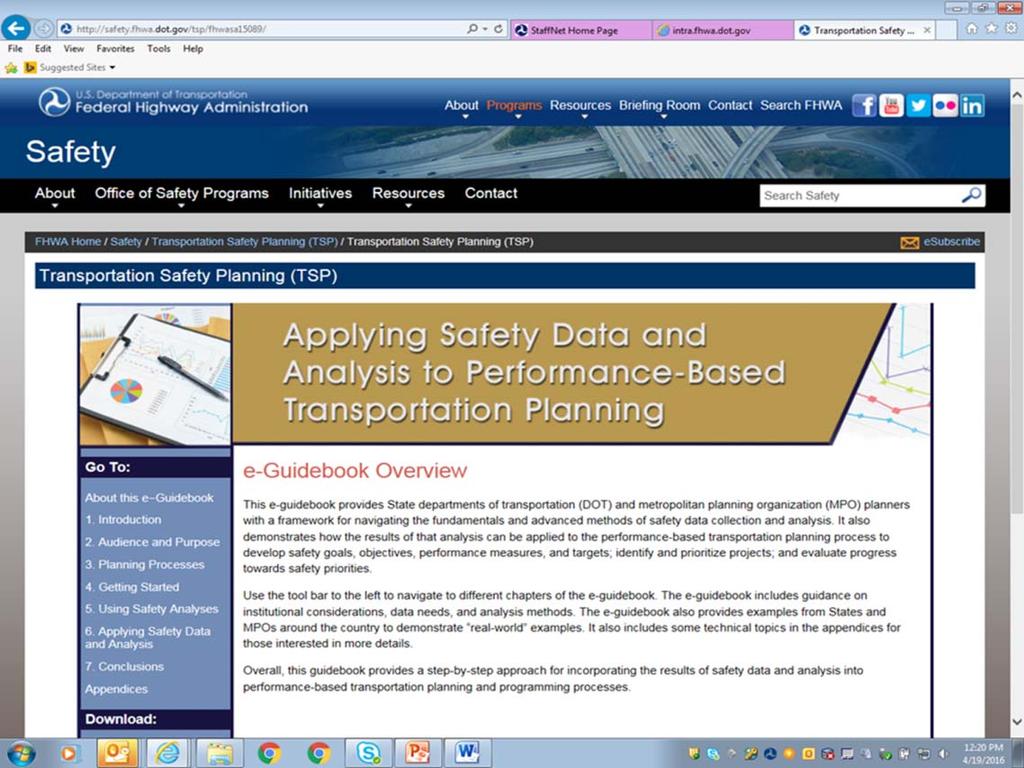
5 Chapter 2: Purpose Overall, Enhance Performance-based Planning Processes Create Focus on Data-Driven Safety Analysis Introduce Safety Analysis Tools to Planners 5

6 Purpose (cont d) Guide helps answer these questions 6
7 Audience Primary: DOT and MPO Transportation Planners Secondary: Transportation agency staff 7

8 Chapter 3: Performance Based Planning - Transportation Planning Overview of Transportation Planning Process Core planning tasks Products Plans and Programs 8

9 NCHRP 811 9
10 7 TSP Principles Include safety experts on planning committees. Collect and analyze safety data. Incorporate safety into vision, goals, and objectives. Establish safety performance measures. Address safety in all planning efforts. Use safety as a decision factor. Monitor and evaluate performance. 10
11 Transportation Planning Process System Operations Implementation of Strategies Economic Development Other Sources for Project Ideas Short- (3-5 year) Range Program Vision Goals and Objectives Performance Measures Alternative Improvement Strategies Evaluation Mobility and Accessibility Environmental Quality Policies Operations strategies Long- Range Plan Data Analysis Methods Infrastructure projects Studies Regulations Education and awareness Enforcement Financing strategies Partnerships Collaborative undertakings Collaboration with the public 11
12 Transportation Safety Planning Continuous monitoring of safety in operations Consider education enforcement and emergency response Safety projects programmed Safety explicitly part of project implementation Economic Development Safety performance measures System operations Safety strategies considered Other sources for project ideas Safety part of criteria set Implementation of strategies Short (3-5 year) Range Program Vision Goals and objectives Performance measures Alternative improvement strategies Evaluation Mobility and Accessibility Environmental Quality Safety included in vision Safety stated in goals Data Analysis methods Policies Operations strategies Infrastructure projects Studies Regulations Long Range Plan Safety integrated within plan Education and awareness Safety data continuously collected Safety included in analysis Enforcement Financing strategies Partnerships Collaboration Safety strategies considered Collaboration with safety stakeholders and the public 12
 and contents Funding Coordination with other plans")
13 Performance Based Planning - Safety Planning Overview of State Safety Planning Process Process Partners Product (SHSP) and contents Funding Coordination with other plans Example 13

14 Florida SHSP 14
15 Performance Based Planning Integrating Safety into Transportation Planning Process Why: to meet safety goals and work toward reducing fatalities and serious injuries Examples: opportunities to integrate safety in each step of the planning process Transportation Planning Process Key Planning Task Data Collection and Analysis Safety Integration into Key Planning Task Obtain safety data, which can include crash data, roadway characteristic data, traffic volume data, and safety information from public/stakeholder input. Conduct safety analysis, which can range from basic analysis like identifying crash frequencies to more sophisticated approaches, such as network screening. Examples In Ohio, crash and roadway data are obtained through the Ohio DOT. VMT estimates also are available for State and regional agencies. Ohio DOT has developed user-friendly tools, such as the Geographic Information System (GIS) Crash Analysis Tool (GCAT), which automate the analysis. In New Mexico, State and regional agencies can access safety data through the University of New Mexico (UNM) Division of Government Research (DGR) Web siteto access published reports, or they can submit a request to New Mexico DOT via to the Crash Records reporting office (crash.records2state.nm.us) to request specific records and/or generated reports. 15
16 Chapter 4: Getting Started with Transportation Safety Planning Data Collection Institutional considerations Types of safety data for planning Data quality Formats of data 16
17 Institutional Considerations Who manages the statewide crash database? What data are available and in what format? What data do I need? How do I obtain access to data? 17

18 Common Types of Safety Data 18
19 Data Quality Timeliness Accuracy Completeness Consistency/Uniformity Integration Accessibility 19
20 Trivia Question What name are the 6 data qualities referred to (nick name)? Please type your answer in the chat room 20
21 Format of Safety Data Raw Data Generated Reports Web Interfaces/Tools Custom Inquiries 21
22 Chapter 5: Using Safety Analysis for Planning Basic safety analysis categories and tools Applications to transportation planning Examples 22
23 Using Safety Analysis for Planning - Analysis Categories Analysis Category Analysis Question Benchmarking How many fatalities and serious injuries are occurring in my area? Identify Crash Trends and Contributing Factors How does this compare to other areas or my State? Who is involved in crashes? When are the crashes occurring? What are the major contributing factors to crashes? Identify and Evaluate Focus Crash Types What are the most common crash types? Network Screening Identify Sites for Safety Improvement Systemic Analysis Identify Safety Risk Factors Corridor and Intersection Planning Safety Analysis What are the most common contributing factors? What are the characteristics of the over representation? What locations (intersections or segments) show the most potential for safety improvements? What are the common characteristics of locations with crashes? What are the countermeasures to address these characteristics? How should we prioritize system wide implementation? What are the safety effects of alternative roadway or intersection cross sections? 23
24 Using Safety Analysis for Planning - Appendix B Analysis Category Safety Analysis Question What tools are available? Data Needs Benchmarking How many fatalities and serious injuries are occurring in my area? Descriptive Statistics FARS data Total crashes Total fatalities and serious injuries How does this compare to other areas or my State? High-level roadway data roadway ownership, functional classification Agency geographic boundary information Network Screening Identify Sites for Safety Improvement What locations (intersections or segments) show the most potential for safety improvements? AASHTO HSM Part B Network Screening Includes descriptive and predictive methods AASHTOWare Safety Analyst TM GIS Heat Mapping Crash severity Crash location Roadway and roadside characteristics intersection control, number of lanes, presence and type of shoulder, presence and type of median, posted speed, horizontal and vertical alignment, etc. Traffic volume data intersection total entering traffic volume, roadway segment volume per million vehicle miles Calibrated safety performance functions, if predictive methods are used 24

25 Display of Analysis Understand crashes by type, severity, over-representation, or geography 25
26 Network Screening Identify sites (intersections, road segments) that have potential for safety improvements Identify Sites using methods involving crash, traffic, and roadway data i.e. critical rate, Level of Safety Service (LOSS) Field Investigations and Recommended Countermeasures Prioritize Projects based on economic appraisal 26
27 Network Screening Final Rank Intersection Traffic Control Frequency Rank EPDO Rank Crash Rate Rank Composite Score 1 U.S. 60 at Radanovich Boulevard at Globe Food Mart access road Signal SR 87/Beeline Highway at Longhorn Road at U.S. 260 Signal SR 260 at Manzanita Drive at Granite Dells Road Signal SR 260 at Valley Road at Highline Drive Stop Sign Broad Street at Oak Street Stop Sign SR 87/Beeline Highway at Bonita Street Signal SR 188/Apache Trail at U.S. 60 at Russell Road Signal U.S. 60/Ash Street at Hill Street Signal U.S. 60 at Escudilla Drive at Main Street Signal SR 347/John Wayne Parkway at Papago Road Stop Sign
28 Systemic Analysis Reducing crash frequency and severity through implementation of low-cost safety improvements to address high-risk roadway features correlated with specific severe crash types Risk Factors: 2-lane roads with specific curve radii Crash Types: Roadway departures Identify all locations where this combination exists Prioritize and implement low cost countermeasures at all locations 28
29 Highway Safety Manual Part C Predictive Analysis Contains methods to calculate expected number and severity of crashes at sites with similar geometric and operational characteristics Data needs are more detailed i.e. existing and future roadway, crash (observed and expected), traffic volume data Very useful for selecting alternatives during Planning and Environmental process 29
30 Florida Example Table 1: Crash Costs and Predicted Crash Frequency for SR 574 Design Alternatives 20-Year Horizon 4 LANE, DIVIDED 5 LANE WITH TWLTL CRASH TYPE Crash Costs Predicted Crash Frequency Predicted Crash Frequency Crash Costs FI PDO FI PDO Multi-Vehicle Non-Driveway $1,492, $2,856, Single Vehicle $155, $235, Multi-Vehicle Driveway-Related $561, $3,337, Total $2,208, $6,428,
31 Chapter 6: Applying Safety Data and Analysis to Inform Decision-making How to use data and analysis to: Develop goals, objectives, performance measures Identify and prioritize safety programs and projects 31


32 Using Safety Analysis to Set Goals Trends Demonstrate a need for a general safety goal Contributing factors Safety specific goals 32

33 Using Safety Analysis to Set Objectives Goal Reduce severe crashes on the transportation system Objective Identify solutions to address the overrepresentation of pedestrian and motorcycle crashes 33


34 Using Safety Data to Set/Track Performance Measures 34

35 Using Safety Analysis for Project Prioritization 35
36 Conclusion Describes safety data collection and analysis approaches Provides step-by-step approach for incorporating results of safety data & analysis in planning processes Demonstrates several categories of analysis Shows basic and advanced examples of establishing safety goals and objectives 36
37 Conclusion Safety analysis helps: Review past, current, and future (if possible) safety trends where are we now? Develop safety goals, objectives, measures, and targets where do we want to go? Identify transportation safety programs and projects to achieve results how do we get there? Monitor and evaluate how are we doing? 37
38 Next Steps What are the next steps that you plan to take? Can you share them with the group? Please type your thoughts in the chat room 38
39 Resources FHWA Florida Division Office- FHWA Headquarters Data and Analysis Tools Team- Roadway Safety Data website a.dot.gov/rsdp/ Transportation Safety Planning- or TSP websites ning/ 39