Lego Data App Project. By Chelsea Miller
|
|
|
- Rodger Richards
- 5 years ago
- Views:
Transcription

1 Lego Data App Project By Chelsea Miller
2 Introduction You have each purchased a dataset (really a small pile of Lego bricks that relate and differ in many ways). Your primary objective is to create an app* that will help someone understand this dataset, it s contents, the similarities and differences within the set, as well as the size of objects in relation to each other and your audience. Your target audience is someone who knows nothing about your set of Lego bricks. (see examples) Requirements Your app should contain the following elements. A main title and description for the app (be creative) Clear labels for each section or group of charts/graphs Proper navigational cues (arrows, buttons etc.) At least 2 visualizations of the dataset (such as size comparisons with everyday objects, block stacking options, melting or freezing data, etc.) At least 1 of each of these charts: 1 pie or ring chart, 1 bar chart (Examples on this site), 1 histogram, 1 table, and 1 polar area chart (also known as The Nightingale, Rose Chart, or Radial bar Chart, or coxcomb) At least 1 schematic (can be diagram of anatomy of a lego brick, or simple exploded view of a lego structure etc). Learning Outcomes Explore various methods/techniques for visualizing quantifiable data. Experiment with various chart, graph and diagramming options and identify benefits and liabilities of each. Connect principles of design, typography, usability etc. to a data visualization problem. Creatively, appropriately, and clearly present information that can be Organize these elements into a collection of Infographic screens for your app, including t the required chart and graph types, designed for display on a high resolution tablet of your choosing (again, see examples). These infographics should help a stranger understand different ways to interpret the data within your set. (For example: How many bricks of each color are there? Are there relationships with color hue and brick size? How many of each shape/size brick are there? etc.) You will need to organize your information in a logical way. Consider grouping similar or related information visually. NOTE: You may also include information not easily measurable but found via research such as: the chemical composition of the bricks, relative melting or freezing point, force required to push them together or pull them apart, etc. * The final app doesn t need to work. It will be presented as a PDF file merely showing key screens from the app on an image of a tablet. (see example) Required Materials counted or measured about a set of physical objects (Lego bricks) as a representation of a dataset. Understand the relationship between data and different style elements. Connect principles from our readings with practical problems of data visualization. Conduct empathic studies to develop deeper understanding of how data is perceived. $5-10 (for lego kit which should have been purchased the first week of the semester) Camera (point & shoot) Adobe Illustrator & Photoshop (for creating visuals) Adobe InDesign (for process book)
3 Project 3 Step 1 Lego Data App Project RESEARCH 5 CHART TYPES & INTERESTING INFOGRAPHICS TO INFORM THE LEGO DATA APP PROJECT. Gather information about each of the chart types required for the Lego Data App Project. Including information about when to use them and how to make them. Links to chart types: 1 pie or ring chart, 1 bar chart (Examples on this site), 1 histogram, 1 table, and 1 polar area chart (also known as The Nightingale, Rose Chart, or Radial bar Chart, or coxcomb). Organize that information by chart type on process book pages for future reference. Collect visual inspiration for infographics that use charts and graphs as a main or important element. (see or past student projects)


4 Pie Chart Research:


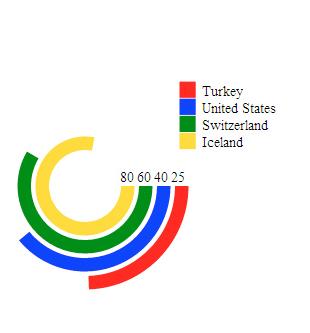


5 Ring Chart Research:


6 Bar Chart Research:


7 Histogram Chart Research:
8 What to do with 100 Legos? COMPARE LENGTHS AND COLORS COMPARE WHAT CAN BE DONE WITH THE LEGOS RESEARCH THROUGH SIMPLE USER TESTS, DISPLAY FINDINGS HOW TO GUIDE ALL ABOUT LEGOS THE HISTORY OF LEGOS BUILDING POSSIBILITIES WITH DIFFERENT AMOUNTS OF LEGOS WHAT S IN A 100 SET OF LEGOS ABSTRACT LEGOS TEACHING MATH BY LEGOS IF LEGOS WERE MONEY DIVERSITY IN BUILDING LEGO PEOPLE WITH 100 LEGOS WHAT WOULD CHILDREN DO? Using a combination of Math equations, what children would do with legos, and the building possibilities I will set out to prove that a 100 piece lego set means a lifetime of creativity, I will show the possibilities in numbers, and break those numbers up into years, hours, possibilities using only certain colored bricks/certain size/certain number, and different types of what can be built.