Kentucky Transportation Conference January 22, 2015
|
|
|
- Todd Dickerson
- 5 years ago
- Views:
Transcription

1 Kentucky Transportation Conference January 22, 2015


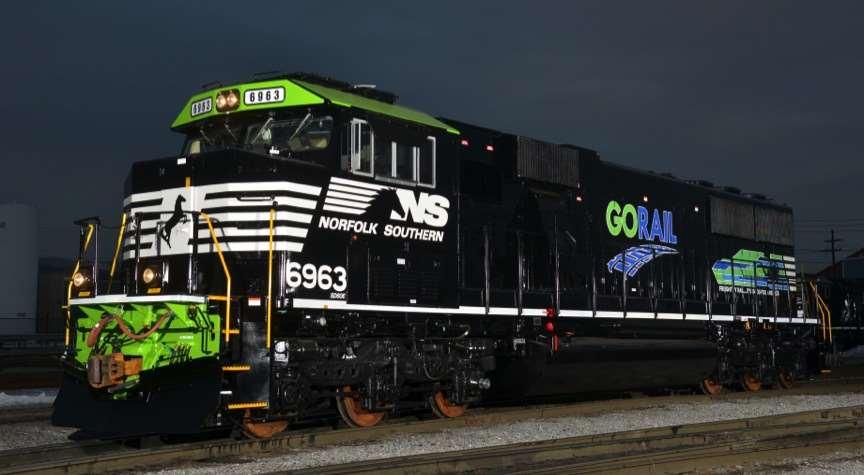
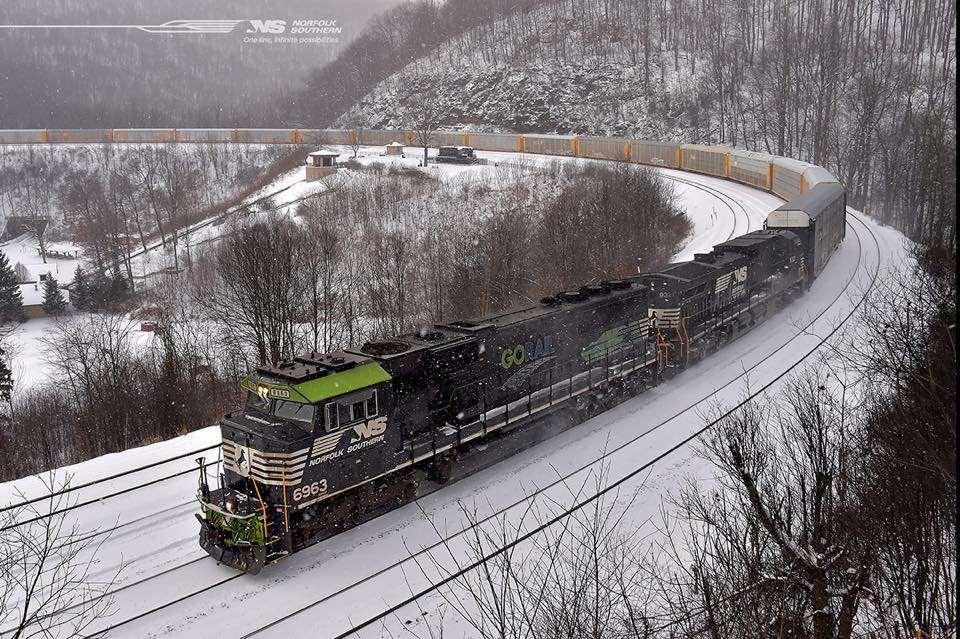
2 About GoRail National non-profit grassroots organization promoting the public benefits of rail We are: railroads, rail supply companies, local business, government and community leaders Supporting legislation to expand rail capacity Opposing legislation that would shrink capacity or undercut investment in freight rail
3
4
5 The Federal Railroad Administration calls the U.S. freight rail system the safest, most efficient and cost effective in the world. U.S. Freight Rail Rates Are the Lowest Among Major Countries U.S. Canada Index U.S. = 100 China Russia Spain Japan Germany France India Italy Data are averages and are adjusted for purchasing power parity. Sources: various international railroads and rail associations, World Bank
6
7 Annual Compensation: U.S. Freight Railroads vs. U.S. Average* $120,000 $110,000 $100,000 $90,000 $80,000 $70,000 $60,000 $50,000 $40,000 $30,000 $20,000 $10,000 $0 Benefits Wages U.S. Average* Benefits Wages Freight RRs *Average per full-time employee equivalent. Data are Source: Bureau of Economic Analysis, AAR The more than 180,000 freight railroad employees are among America s most highly paid workers.

8 Continued Record Rail Investment Railroads have invested $550 billion of their own capital since 1980 $26 billion investment in 2014 Source: AAR

9 Freight Rail Creates Jobs Every freight rail job sustains another 4.5 jobs across the economy. Freight railroads generate nearly $265 billion in economic activity each year. Every $1 billion of new rail investment creates 20,000 jobs. Every $1 of rail investment that adds new capacity generates more than $3 in total economic output. Freight railroads hired nearly 17,000 in 2014; nearly one in four were veterans


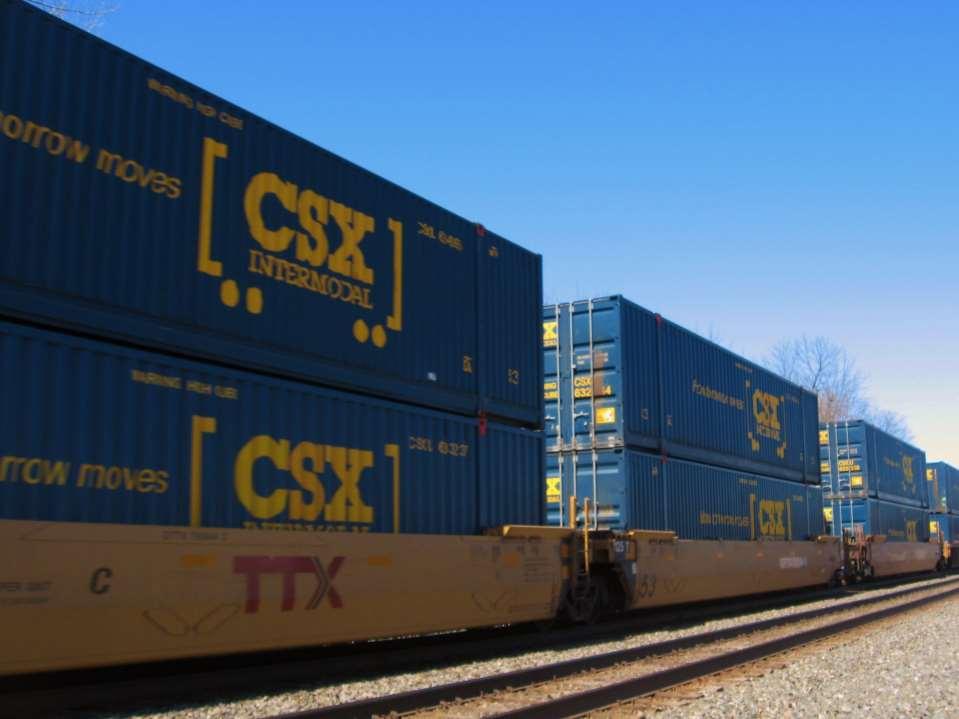
10 Intermodal: 12.8 million trailers and containers Food products: 1.7 million carloads Lumber, paper & other forest products: 1.3 million carloads Farm products: 1.5 million carloads Sand, stone & gravel: 1.1 million carloads Coal: 6.0 million carloads And much more! Plastics, fertilizers and other chemicals: 2.4 million carloads Motor vehicles and parts: 1.7 million carloads Figures are 2013.
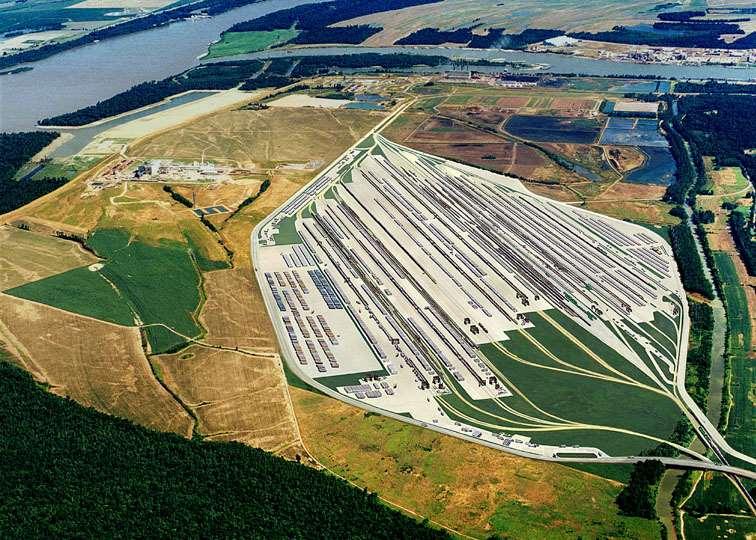
11 Freight Railroads Account for Just 0.6% of U.S. Greenhouse Gas Emissions Nontransportation sources 72.3% Trucking 6.2% Passenger transportation* 19.7% Freight RRs 0.6% Other freight transportation 1.2% *On-road vehicles, aircraft, recreational boats, passenger rail. Data are Source: EPA Transportation-Related Not Transp.-Related
12 Freight Rail Fuel Efficiency (ton-miles per gallon) % Increase % % % Source: Association of American Railroads
13 Average Inflation-Adjusted U.S. Freight Railroad Rates Are Nearly Half What They Were in 1981* Even after recent increases, average U.S. rail rates* are down 42% since the Staggers Act restored reasonable balance to railroad regulation. '81 '85 '89 '93 '97 '01 05 '09 '13 *Class I revenue per ton-mile, average all commodities. Source: AAR
14 U.S. Rail Intermodal Traffic: (millions of containers and trailers) Trailers Total Containers '89 '91 '93 '95 '97 '99 '01 '03 '05 '07 '09 '11 '13 Source: AAR
15
16
17 Demand For Freight Transportation To Rise Sharply (billions of tons transported in U.S.) bil 2020p 22.1 bil 2030p 25.1 bil 2040p 28.5 bil p - projected Source: FHWA Office of Freight Management and Operations, Freight Analysis Framework version 3.5
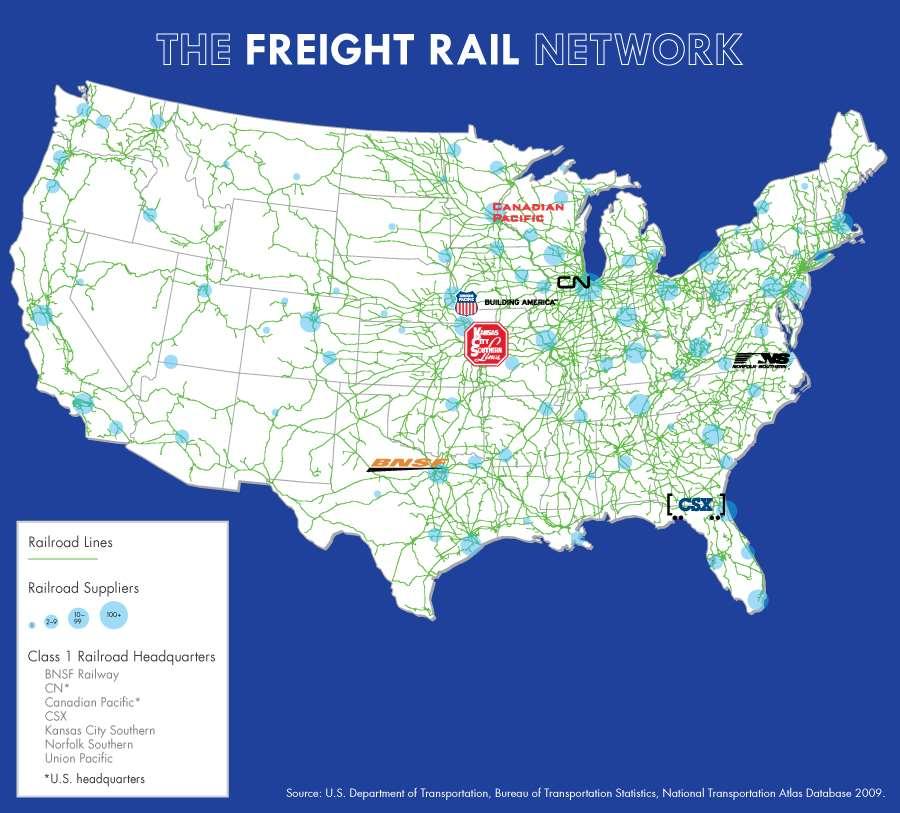
18 MAJOR U.S. RAIL INTERMODAL TERMINALS BNSF CN CP CSX FEC KCS NS UP PORT ONDOCK RAIL Transload facilities are not included. Source: AAR
19 Balanced Regulation has Worked $550 billion invested in infrastructure and equipment since 1980 $26 billion investment in 2014 to build, maintain and upgrade their network Railroads hired nearly 17,000 employees in 2014, up from 11,000 in 2013 Average rail rates down 42% since 1981
20 U.S. Freight Railroad Performance Since Staggers (1981 = 100) Staggers Act passed Oct Productivity Rates Volume Revenue '64 '68 '71 '74 '77 '80 '83 '86 '89 '92 '95 '98 '01 '04 '07 '10 '13 "Rates" is inflation-adjusted revenue per ton-mile. "Volume" is ton-miles. "Productivity" is revenue ton-miles per constant dollar operating expense. The decline in productivity in recent years is mainly due to the effect of higher fuel prices in the productivity calculation. Source: AAR
21 Public Benefits of Freight Rail Every rail job supports 4.5 additional jobs Railroads invest so taxpayers don t have to One train can haul several hundred truck trailers One train, nearly 500 miles, one gallon of diesel Railroads are four times as fuel-efficient as trucks Moving the nation toward energy independence

22 Railroads help power our economy and connect businesses to markets throughout the U.S. and around the world. The availability of freight railroads has a significant impact on the decisions of businesses considering a move to Kentucky or an expansion in Kentucky Secretary Larry Hayes Kentucky Cabinet of Economic Development
23 Friday, January 23, :30 AM Break Out Session Connecting Your Community to Kentucky s Rail Network Bryan Glover, CSX Transportation Bob Helton, RJ Corman Railroad Group Tom Garrett, Paducah & Louisville Railway Ballrooms G & H


24 GoRail Michael Gaynor facebook.com/gorail twitter.com/gorail linkedin.com/gorail