Panama Canal Expansion: Impacts on the US Marketplace
|
|
|
- Sharyl Baker
- 5 years ago
- Views:
Transcription


1 NMHC General Session April 22, 2015 NMHC Spring Board Meeting Waldorf Astoria Hotel New York Panama Canal Expansion: Impacts on the US Marketplace M. John Vickerman Williamsburg, Virginia

2 Today s Global Shipping Lanes Copyright Copyright


")
3 The Maritime Silk Road Replaced the Overland Silk Road as the Primary Trading Route Across Eurasia After the Tang Dynasties (618 to 907) Copyright 2014


4 The Marine Silk Road was a Precursor to: Today s modern supply chain logistics, distribution and shipping transportation networks Copyright 2014


5 Copyright 2014 The World s Primary Shipping Route: The Marine Silk Road

6 90% of Global Trade is Carried Out by Shipping The Majority of Today s Ocean Trade is Conducted on the Marine Silk Road Copyright 2014

7 Indian Ocean Electric Blue Shipping Lane Trails From the Marine Silk Road Copyright 2014

8 Copyright 2014 The World s Largest Ports Are Connected Via The Marine Silk Road Where are the Biggest Ports?
9 Copyright 2014 On Earth, There Are More People Living Inside This Circle Than Outside the Circle
 Offshore China Source: Wired Science January 2010 Journal of the Royal Society: Interface Copyright 2014")
10 Global Shipping Routes Plotted by AIS GPS Today s Busiest Shipping Routes: (1) Panama Canal, (2) Suez Canal, (3) Offshore China Source: Wired Science January 2010 Journal of the Royal Society: Interface Copyright 2014

11 International Port External Industry Pressures Driving Today s Logistics Copyright Copyright


12 Copyright 2015 More than 98% of everything we consume, wear, eat, drive and construct is brought to us via ships through the North American port system.
13 Growth in GDP and World Trade World trade will grow by 73% in the next 15 years. With merchandise trade volumes in 2025 hitting $43.6 trillion compared to today s $27.2 trillion Source: Oxford Economics 2013 Copyright 2013

14 Continuing Economic Global Growth International trade is set to significantly grow despite current economic uncertainty in the U.S. and elsewhere around the world Source: TD Economics Forecast as of March 2013 Copyright 2013


")

15 Key Success Factor: Cargo Will Flow Downhill to the Lowest Cost - Best Service Levels (Total Logistics Costs From Origin to Destination) More Competitive Regions will End up with the Cargo Copyright 2015


16 Copyright 2015 Poll of the Top 1000 Blue Chip Multinational Shipper Priorities 38% Competitive Freight Rate 12% Transit Time & Speed 43% Schedule Reliability & Consistency

17 Copyright 2015 Today s Logistics Truth: The customer wants more and is always willing to pay less for it.
18 International Maritime Cargo Demand Trends Copyright Copyright

19 Historical Global Container Market Demand (Millions of TEUs) 2009 Recession North American Growth Lags Other Global Regions Source: Drewry Shipping Consultants Copyright 2015


20 2015 Predicted Increases in World Seaborne Trade & Global Population Source: IHS Global Insight World Seaborne Trade, OECD Statistics, UN Population Copyright 2015

21 2025 World Container Port Market Demand (Millions of TEUs) 2009 Recession 260% Increase Source: Drewry Shipping Consultants October 2011 Copyright 2015
22 A Turning Point in Global Economic History The Advanced Economies Will Decline From 2/3 share of the Global Economy to a 1/3 Global Share. The Global Economy Will See Higher Average Pace of Growth in the Future Emerging Markets (BRIC Countries) Advanced Markets (NAFTA Countries) Source: IMF - Forecast by TD Economics, December 2009 Copyright 2015

23 Source: ATA US Freight Transportation 2025 Forecast Copyright 2015


24 Southeast Asian Manufacturing Centroid Shift Current Inbound U.S. Cargo Flow U.S. Intermodal Rail Flow Expanded Asian Panama Canal 2014 Flows Western Centroid Shift Eastbound: All Water Flow Eastbound: US Intermodal Rail Flow Copyright 2012 Copyright 2015


25 Copyright 2015 Southeast Asian Manufacturing Centroid Shift Current Inbound U.S. Cargo Flow U.S. Intermodal Rail Flow Western Centroid Shift With Manufacturing Westbound Centroid All Water/Suez Shifts Flow Into Vietnam and/or India, The Westbound North Intermodal American U.S. Flow East Coast will See Dramatically More Westbound Suez Traffic


 3")

26 Suez Canal s $8.5 Billion Expansion Plan (A New $4 Billion 45-mile-long parallel channel and Global Logistics Park) 3 Daily Convoys: 2 Northern Convoys 1 Southern Convoy Copyright 2015


27 Copyright 2015 August 5, 2014 The Suez Canal Announces a $4 Billion Expansion of the Canal New 45-mile-long parallel channel cutting waiting times to transit by 3 hrs. from 11 hrs. Half of a $8.5 billion project that includes a free trade zone, an industrial park and a regional logistics hub for the Middle East, North Africa and the Mediterranean.

28 The Growing Asian Import Trade Challenge Copyright Copyright
29 Copyright 2015 Container Transhipment World Records Of the 10 busiest ports in the world, Nine are in Asia; of the top 10, Six are on the Chinese mainland The Port of Shanghai is No. 1, and The Port of Singapore is No.2 These Two Ports are Larger Than All North American Ports Combined


")


30 Copyright 2015 China-US: Twin Engines of the World Population: US: 314 million China: 1,344 million (1/5 World) The number of Chinese children in elementary school is equivalent to the total US population.


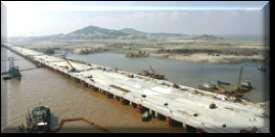
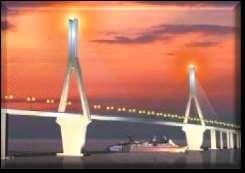
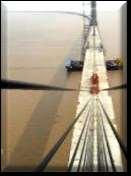

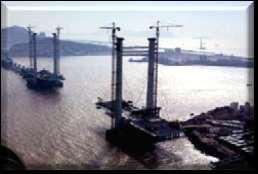
31 Copyright 2015 Shanghai International Shipping Center Yangshan Deep Port & Logistics Park New Port City New Logistics Park 20 Mile New Port Access Bridge Constructed in 3 yrs 54 New Berths


32 Copyright 2015 Shanghai International Shipping Center Yangshan Deep Port - 20 Mile Bridge Access Second Longest Ocean Bridge in the World


33 Shanghai Yangshan Deep-Water Harbour Yangshan Deep Port 54 Berths East China Sea Copyright 2015

34 Shanghai International Shipping Center Yangshan Deep Port & Logistics Park Shanghai Port Set a 2011 Record by Handling over 30 million TEUs Copyright 2015

35 Maritime Vessel Technology Trends Copyright Copyright
, Roll On/Roll Off (Ro/Ro) LNG, Petroleum, Molasses, Chemicals, Vegetable Oil Grain, Sand & Gravel, Scrap Metal,")
36 Copyright 2015 Functional Classification of Global Maritime Cargoes All Maritime Cargo General Cargo Bulk Cargo Break Bulk Neo-Bulk Containerized Liquid Bulk Dry Bulk Sacks, Cartons, Crates, Drums, Pallets, Bags Lumber, Paper, Steel, Autos Containers, Lift On/Lift Off (Lo/Lo), Roll On/Roll Off (Ro/Ro) LNG, Petroleum, Molasses, Chemicals, Vegetable Oil Grain, Sand & Gravel, Scrap Metal, Coal/Coke, Clinker, Fertilizer
 The Container Shipping Unit of Measure 1")

37 Copyright 2015 The TEU (Twenty Foot Equivalent Unit) The Container Shipping Unit of Measure 1 TEU = One 20 ft. ISO Container 1 FEU = 2 TEUs = One 40 ft. ISO Container 1 TEU 8 ft. to 9.5 ft 20 ft


 1,890")


38 Copyright 2015 How Much Can a Single Container Hold? (Example 40 ft. Container) 1,890 Cases Example Value $ $25.50/Case = $48,195 = = $299/TV = $94,185 10,000 $30/pair = $300,000 = 432,000 $4.00/Pack = $1,728,000


39 Copyright 2015 April 26, Modified 35-foot Truck Containers In 1955 Malcolm McLean, sold McLean Trucking, and secured a bank loan of US$42 million to build the world's first container ship.
 Full Cellular 2nd Generation (1970-1980) Panamax 3rd Generation (1985) Post")
 2,305 TEU 3,220 TEU 4,848 TEU 8,600 TEU 15,000+ TEU 6th")
40 Copyright 2015 World Container Ship Evolution TEU Capacity Ideal X 1st Generation (Pre ) Full Cellular 2nd Generation ( ) Panamax 3rd Generation (1985) Post Panamax 4th Generation ( ) Super Post Panamax 5th Generation ( ) Ultra Post Panamax 101 TEU (58-35 ft Containers) 2,305 TEU 3,220 TEU 4,848 TEU 8,600 TEU 15,000+ TEU 6th Generation ( )

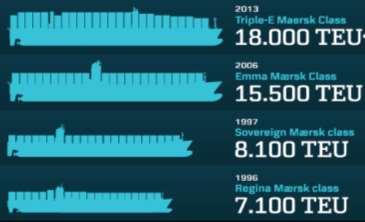
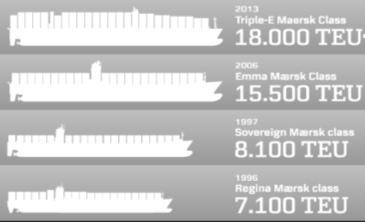
41 World Container Ship Evolution Copyright % increase in the average container ship size from 2008 to 2012 The Stage is set to Jump again to 22,000 to 24,000 TEU Mega Container Vessels 9,000 TEUs 12,000 TEUs 15,000 TEUs 18,000 TEUs


42 Maersk s New 30 Vessels (ordered) are 4 Times the Current Size of the Panama Canal & 1.5 times the Size of the Expanded Panama Canal Copyright 2015


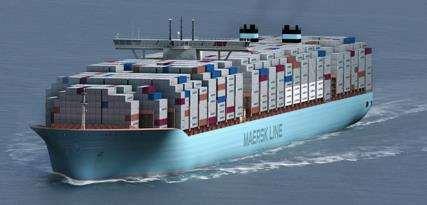
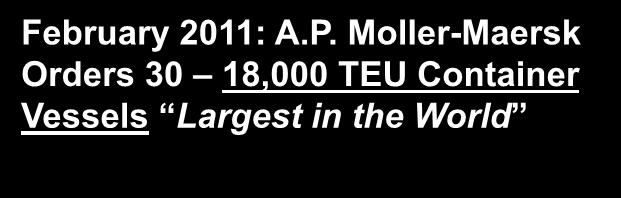

43 February 2011: A.P. Moller-Maersk Orders 30 18,000 TEU Container Vessels Largest in the World 23 Containers Wide 9 Tiers Above the Hatch Copyright 2015
, Evergreen, Seaspan and United Arab Shipping Company (UASC) are also looking at 20,000 TEUs")
44 2018: Ultra-Large TEUs Container Ships 2015: Maersk Planning Orders up to 10 New 20,000 TEU Ships ($1.5 Billion Order), Evergreen, Seaspan and United Arab Shipping Company (UASC) are also looking at 20,000 TEUs Copyright 2015


45 21,000 TEU Ultra Large Twin Engine Container Ship 23 Containers Wide Source: Alphaliner Newsletter Volume 2011 Issue 4 Copyright 2015

46 Containership Orders Country of Build (Orders Since January 2010) 92% Source: Alphaliner Newsletter Volume 2011 Issue 21 Copyright 2015
 Copyright Copyright 2015")
47 Panama Canal Expansion: New Capacity (Circa 2015) Copyright Copyright
 Source: ACP Data Copyright")
48 Panama Canal Transit & Tonnage Traffic (Transits and PCUMS Tonnage 1914 to 2009) Source: ACP Data Copyright 2015


49 Panama Canal Historical Tonnage Traffic Source: ACP Data Copyright 2015


50 The Panama Canal Circa 1914 Copyright 2015


51 Panama Canal Today Copyright 2015

52 Post 2016 Panama Canal Copyright 2015

53 Copyright 2015 Panama Canal Third Lane Expansion Circa 2016

54 Copyright 2015 Panama Canal Third Lane Expansion New Lane Existing Lanes

55 Panama Canal Third Lane Expansion Capabilities 2011: 4,800 TEU : 12,600 TEU Source: ACP Expansion Project Copyright 2015
56 Today Only The Port of Virginia Can Handle The New 2015 Panamax Vessels Fully Loaded JAX 38 ft 4,500 TEU By 2016: Savannah NY/NJ Savannah ft Miami & Charleston ft 8,500 TEU By 2015: NY/NJ Miami Baltimore Norfolk 50 ft Norfolk 55 ft (authorized) 10,000 to 12,500+ TEU Source: Virginia Port Authority (VPA) October 2011 Copyright 2015


57 Port Authority of New York & New Jersey Entrance Channel & Harbor Dredging Program ($1.6 Billion Program, Completion December 2014) Copyright 2015


58 Copyright 2015 Raising of the Bayonne Bridge (Estimated at $1 billion +/-) Future Clearance: 214 ft Current Clearance: ft Maximum Vessel: 7,000 TEUs Existing Level 64 feet

59 Emerging New Caribbean Transhipment Center Copyright Copyright


60 Copyright 2015 Panama Ports Annual Transhipment Growth Proposed New Port Projects Would More Than Double the Total in 5 Years

61 Copyright 2015 Panama Ports Container Transhipment Growth 6.8 Million TEUs 18.5 % Growth Rate


62 Non-Transit Panama Canal Feeder Services May Be the Real Boom from the Canal Expansion Copyright 2015 Weekly Through Transits Feeder Services No Transit Source: ACP and Compare, 2008 Data


63 The Panama Canal Expansion Will Move the Caribbean Transhipment Center Point to Panama Copyright 2015

64 New Panama Canal Pacific Entrance Ports Copyright 2015 More Capacity than all of the Port of Los Angeles


65 New Panama Canal Atlantic Entrance Port Copyright 2015 More Capacity than all of the Port of Houston

66 Panama Canal Expansion Impacts: Copyright Copyright


67 Copyright 2015 Panama Canal Vessel Deployments Will Determine New US Logistics Patterns The Distance to New Orleans and Savannah Via the Panama Canal is Identical But Each Port Has Very Different Access to the US Heartland. A Competitive & Robust Landside Access to the Gateway Port s Inland Market will be a Key Success Factor!


68 The Primary North American Competitor to the Panama Canal is the Class I Rail Intermodal System (Potential Increased Service Offerings and System Capacity) Source: USDOT Maritime Administration (MARAD) 2009 Copyright 2015


69 Today s US Market Penetration Panama Canal Economies of Scale with permit deeper market penetration into the US Reachable Market: 46% of US Population 4,000 TEU ship, all-water. Source: PB Consultants - CSX Transportation May 12, Director of Strategic Analysis Copyright 2015

70 Dramatic US Market Penetration after 2016 Panama Canal Economies of Scale with permit deeper market penetration into the US Reachable Market: 63% of US Population 8,000 TEU ship, all-water. Source: PB Consultants - CSX Transportation May 12, Director of Strategic Analysis Copyright 2015


71 Dramatic US Market Penetration after 2015 Panama Canal Economies of Scale with permit deeper market penetration into the US The State of Texas & Texas Ports Could be the Real Beneficiaries! Source: ACP Expansion Project Rodolfo Sabonge AAPA January 24, 2013 Copyright 2015

72 Panama Canal s Designation of Prime and Competitive Canal Markets Destinations Copyright 2015

73 A Growing Demand for Inland Ports Serving Gateway Ports Copyright Copyright

74 Emerging Major Inland Port Logistics Centers Throughput Capacities in Millions of TEUs Copyright 2015

 Import")

75 Copyright 2015 BNSF Logistics Park, Joliet. IL A New Model For Freight Logistics Centers Wal-Mart s New 3.4 million SF (78 acres under roof) Import Distribution Center The Cost of This Import Distribution Center was Paid for by the Savings in Truck Drayage Between the Warehouse & the Intermodal Rail Terminal

76 Copyright 2015 The Inland Port: With Integrated JIT Delivery: The Inland Port Can Significantly Increase a Region s Freight System Capacity at the same time Improving the Gateway Port Productivity

77 What Does All This Mean For The Northeast? Copyright Copyright
78 Key Factors Impacting the Northeast as a Result of the Panama Canal s Expansion Copyright 2015 New Inland Port Development Plans Higher Volumes on Truck Corridors Increased Development of Port Distribution & Warehouse Centers & Inland Port Logistics More Distribution Centers Focusing on Asian Trade New Competitive Pressures on Ports to Increase Productivity & Channel Depths More Inquiries from Midwest Shippers into Northeast Ports and Distribution Centers Air Quality and Other Environmental Concerns

79 Current US Capital Spending On Critical Infrastructure Copyright Copyright


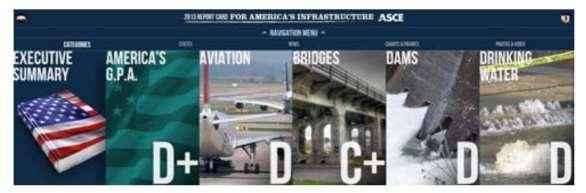
80 Copyright 2015 ASCE 2013 Report Card for America s Infrastructure Ports: C Railroads: C+


")

81 Copyright International Gross Fixed Capital Formation as a Percent of GDP (US is 32 nd in the World - Below OECD Nations) Organization for Economic Co-operation and Development (OECD)

82 Thank You Copyright Copyright


83 A Copy of this Presentation is Available at Our Web Site: (Go to Presentations Page to Download) Copyright