The U.S. Freight Railroad Industry. Ohio Conference on Freight Toledo, Ohio September 21, 2011
|
|
|
- Cuthbert Carr
- 5 years ago
- Views:
Transcription

1 The U.S. Freight Railroad Industry Ohio Conference on Freight Toledo, Ohio September 21, 2011


2 Assn. of American Railroads SLIDE 2
3 Integrated With Mexico and Canada ~140,000 route-miles in U.S., ~40,000 in Canada & Mexico (370,000 km) 1.6 million freight cars 31,000 locomotives Seamless across borders except for Customs SLIDE 3
4 America s Freight Railroads Type of Railroad The U.S. Freight Railroad Industry: 2009 Freight Miles Revenue Number Operated* Employees ($ billions) Class I 7 93, ,906 $46.1 Non-Class I ,197 17, Regional 23 12,804 6, Local Linehaul ,977 5, S&T 194 6,416 6, Canadian** n/a n/a Total , ,891 $49.4 *Excludes trackage rights. **Includes CN and CP operations that are not part of a CN- or CP-owned Class I carrier. Source: AAR SLIDE 4
 Productivity")

5 Big Changes Since 1980 (Index 1981 = 100) Productivity Staggers Act Passed Oct Volume Price Revenue Source: AAR SLIDE 5
6 Highest Share of Ton-Miles 45% 40% 35% 30% 25% 20% 15% 10% 5% 0% (% of Ton-Miles) Railroads Pipeline Water '80 '83 '86 '89 '92 '95 '98 '01 '04 '07 Pipeline excludes natural gas. Source: U.S. DOT Trucks SLIDE 6


7 Railroads in the U.S. Carry Just About Everything Total Class I Railroad Gross Revenue 2010: $57.4 billion *Estimated. Some intermodal revenue is also included in individual commodities. Source: AAR Coal $13.9 bil. Intermodal* $11.3 bil. Chemicals $8.1 bil. All Other $5.2 bil. Food $4.7 bil. Forest products $3.1 bil. Steel, iron, etc. $2.0 bil. Transp. Equip. $3.7 bil. Farm Products - $5.3 bil. SLIDE 7

 Data are for Class I")
8 Record Capital Spending Expected in 2011 U.S. Freight Railroad Capital Spending ($ Billions) Data are for Class I railroads. e estimate Source: AAR SLIDE 8


9 Double the Freight on Same Amount of Fuel! (Index 1980=100) *in freight service volume = revenue ton-miles. Source: AAR SLIDE 9


10 Class I Railroad Employment Source: AAR SLIDE 10


11 RR Employee Compensation is Far Higher Than Average (U.S. Railroad Average vs. Average All U.S. Workers) Data are Sources: Bureau of Economic Analysis SLIDE 11

")
 G =")

12 Two Things to Remember 1. Railroads are a derived demand industry. 2. GDP = C + I + G + (X-M) C = consumption (~70%) I = investment (~16%) G = government (~19%) X-M = exports - imports SLIDE 12
13 As the Economy Goes, So Goes Railroads SLIDE 13


14 Lower Consumer Confidence Since Early 2011 Index of Consumer Confidence (Jan. 1985=100) Source: Conference Board SLIDE 14


15 Little Improvement in Unemployment Rate U.S. Unemployment Rate Source: Bureau of Labor Statistics SLIDE 15
 Most = temporary")

16 Job Growth Still Weak Net New Jobs Created (000s) Most = temporary Census-related jobs Source: Bureau of Labor Statistics SLIDE 16

17 Housing is Still Terrible U.S. Housing Starts (seasonally-adjusted annual rate, millions) Source: Census Bureau SLIDE 17

")
18 ...Meaning Lower Rail Carloads of Lumber & Wood U.S. Housing Starts vs. U.S. & Canada Lumber Carloads Rail carloads (right scale) Housing starts (left scale, in 000s) Source: Census Bureau, AAR SLIDE 18
")

19 A Slight Increase in Auto Sales U.S. Auto Sales* (seasonally-adjusted annual rate, millions) Cash-for-clunkers *Passenger cars, SUVs, minivans, and pickups. Source: Bureau of Economic Analysis SLIDE 19


20 ...Is Reflected in Rail Carloads of Autos & Parts U.S. Auto Sales vs. U.S. & Canadian Auto Rail Carloads (Index Jan = 100) Rail carloads Auto sales correlation = 94% Source: Bureau of Economic Analysis, AAR SLIDE 20
21 Coal Stockpiles Are Down From Record Highs 220 Coal Stockpiles at Electric Utilities (Millions of Tons) Source: Energy Information Administration SLIDE 21


22 Industrial Production Trending Slowly Upward U.S. Industrial Production (Jan = 100) Data are seasonally adjusted. Source: Federal Reserve SLIDE 22


23 A Corresponding Uptick in Rail Traffic U.S. Industrial Production (Jan = 100) RR traffic Industrial production *Carloads + intermodal units Data are seasonally adjusted. Source: Federal Reserve, AAR SLIDE 23
")

24 Mfg. Sales and Inventories Manufacturing Sales and Inventories (seasonally-adjusted, $ billions) Manufacturing inventories Manufacturing sales Source: Census Bureau SLIDE 24


25 Inventories Now at a New Normal Level Inventory-Sales Ratio for Manufacturing Source: Census Bureau SLIDE 25


26 Still a Gap Between Rail Traffic and Inventory Levels The Manufacturing Inventory-Sales Ratio vs. U.S. Rail Traffic* (Index Jan = 100) Inventory-sales ratio correlation = -90% Rail traffic *Carloads + intermodal units. Data are seasonally adjusted. Sources: Census Bureau, AAR SLIDE 26


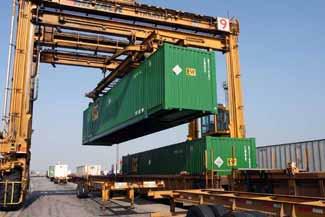
27 Much of Rail Intermodal is Consumer Goods SLIDE 27
28 U.S. Rail Intermodal Traffic (Trailers and Containers) 260, , , , , , , , , , (peak year) Jan Feb Mar Apr May Jun Jul Aug Sep Oct Nov Dec Data are weekly averages. Source: AAR Weekly Railroad Traffic SLIDE 28
29 Total U.S. Rail Carloads + Trailers and Containers 625, , , , , , , , , , (peak year) Jan Feb Mar Apr May Jun Jul Aug Sep Oct Nov Dec Data are weekly average originations. Source: AAR Weekly Railroad Traffic SLIDE 29

30 What s Next for the Economy? SLIDE 30
31 Assn. of American Railroads SLIDE 31