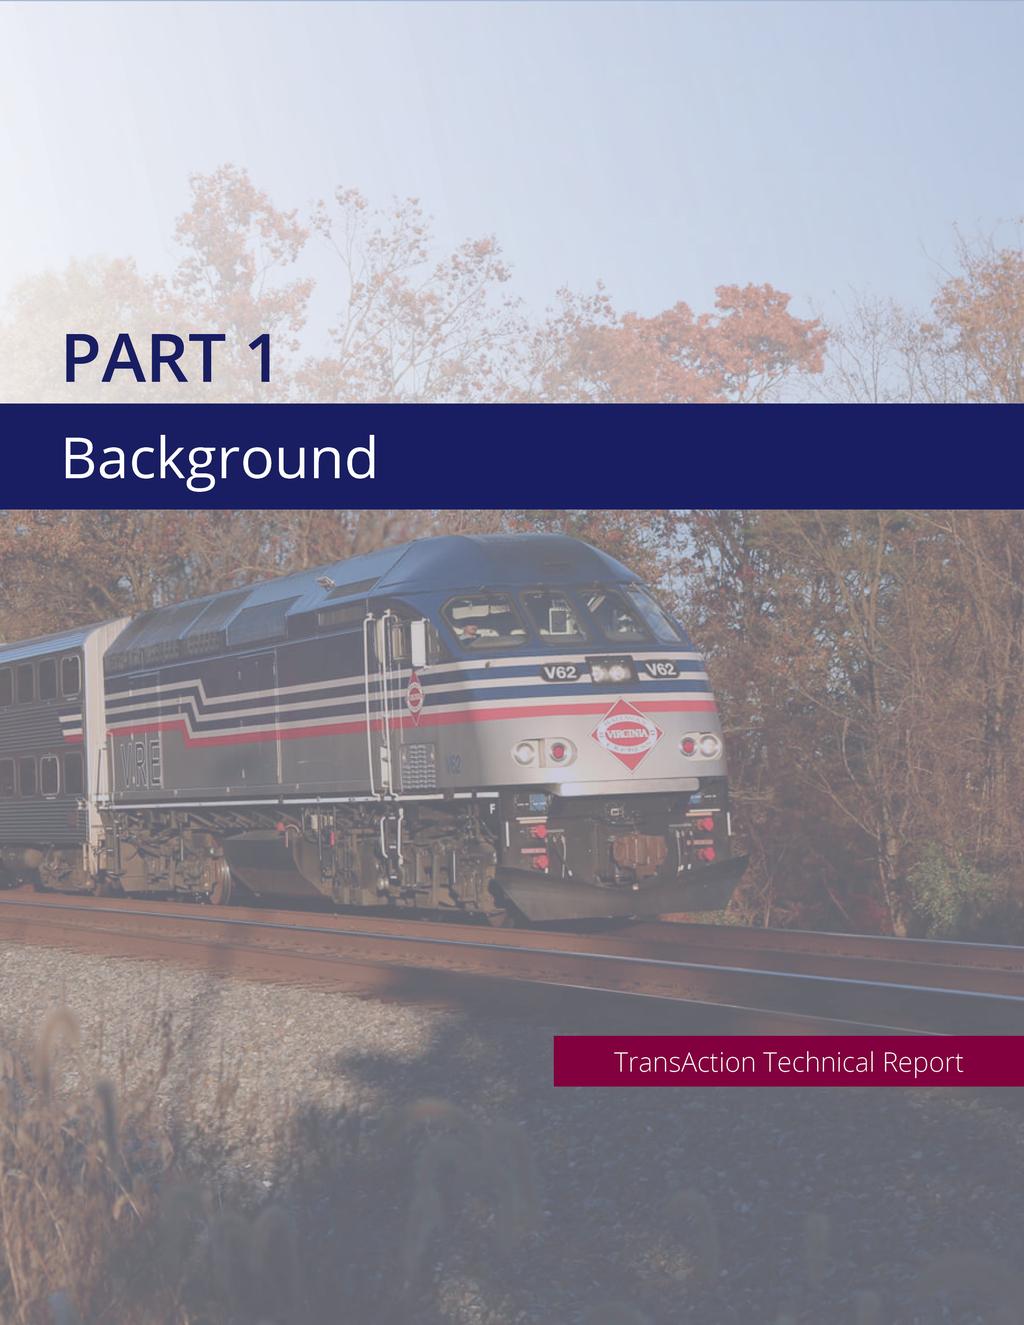
Transportation Action Plan for Northern Virginia. TransAction Technical Report
|
|
|
- Patricia Lang
- 5 years ago
- Views:
Transcription

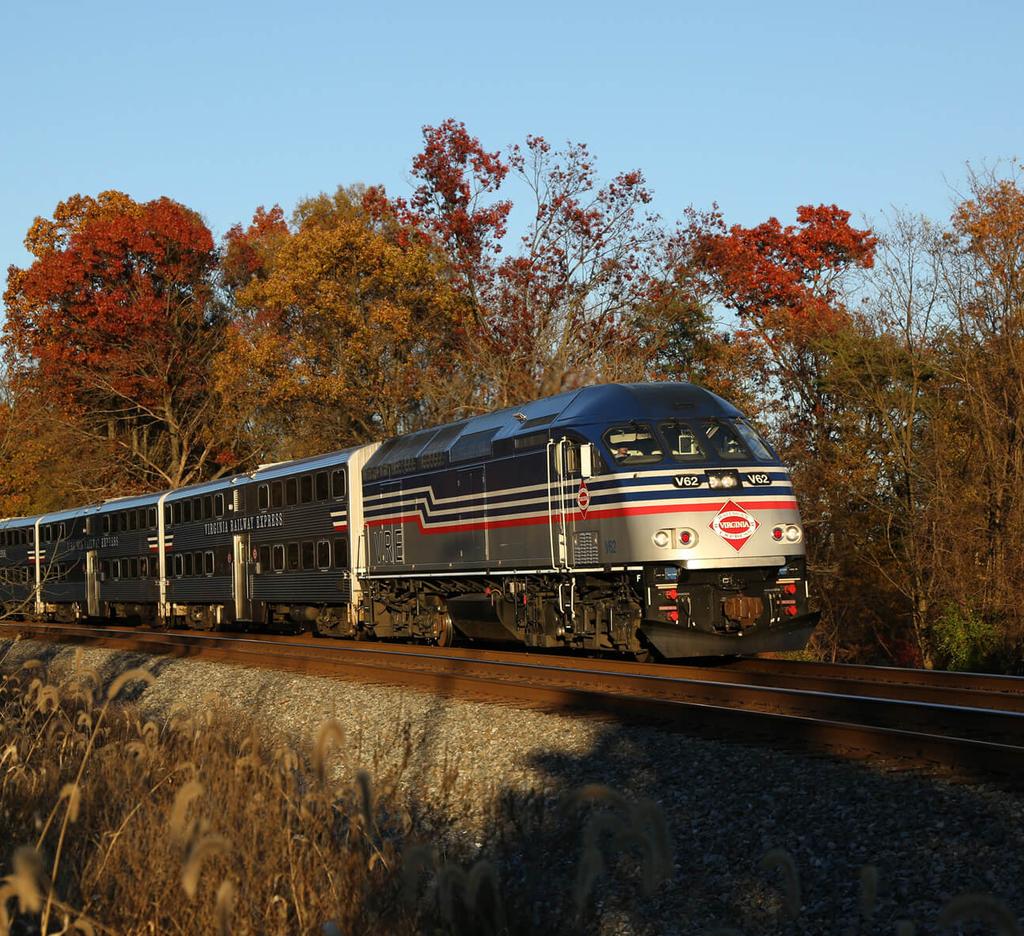
1 Transportation Action Plan for Northern Virginia TransAction Technical Report
2
3
4
5 CONTENTS Introduction Part 1: Background 1 Northern Virginia Growth and Transportation 2 The Regional Transportation Network 3 Future of Transportation What s New? 4 Public Perceptions About Transportation 5 Integrated Public Engagement Approach 6 Performance-Based Planning Part 2: Regional Transportation Needs 7 Stakeholder and Public Inputs 8 Regional Travel Patterns and Trends 9 Travel Conditions Part 3: Key Findings and Recommendations 10 Northern Virginia Transportation System 11 Findings and Evaluation 12 Managing Uncertainty and Risk i
6 Appendices A What s New? B Public Engagement Summaries C Literature Review and Best Practices D TransAction Goals, Objectives, Measures, and Weightings E Transportation Modeling F Detailed Modeling Results G Project List with Costs by Project H Scenario Analysis ii
7 INTRODUCTION This report details the scope and technical content of the TransAction planning effort. Whereas the TransAction Report and Project List constitute the formally adopted Plan, this Technical Report provides detailed discussion of the planning process, stakeholder engagement, and technical analysis that culminated in the TransAction Plan. The Technical Report includes appendices that provide further information on topics that informed the Plan. TRANSACTION LONG-RANGE TRANSPORTATION PLAN TransAction is the multimodal transportation master plan for Northern Virginia. It is a long range plan addressing regional transportation needs through The TransAction Plan focuses on eleven major travel corridors in Northern Virginia, and identifies over 350 candidate regional projects for future transportation investments to improve travel throughout the region. TransAction is developed and maintained by the Northern Virginia Transportation Authority ( NVTA or the Authority ). The NVTA is a regional body that is focused on delivering real transportation solutions and value for Northern Virginia s transportation dollars by bringing Northern Virginia jurisdictions and agencies together to prioritize projects and implement solutions. TransAction is not bound to any budget, and proposes more projects than can realistically be funded. The results of TransAction are used to inform the NVTA s Six Year Program for capital funding, guiding decisions about which transportation improvements the NVTA should prioritize for investment. Vision The adopted vision for TransAction states: In the 21st century, Northern Virginia will develop and sustain a multimodal transportation system that enhances quality of life and supports economic growth. Investments in the system will provide effective transportation benefits, promote areas of concentrated growth, manage both demand and capacity, and employ the best technology, joining rail, roadway, bus, air, water, pedestrian, and bicycle facilities into an interconnected network that is fiscally sustainable. The Authority s mandate, as authorized by the Code of Virginia, is to plan and program transportation improvements of regional significance in the Northern Virginia region (Figure 1). The TransAction plan is updated every five years to inform the NVTA s Six Year Program, which is updated every two years. iii
8 Goals and Objectives The overarching goals of TransAction are to: 1. Enhance quality of life and economic strength of Northern Virginia through transportation; 2. Enable optimal use of the transportation network and leverage the existing network; and 3. Reduce negative impacts of transportation on communities. These goals are supported by measurable objectives that aim to: 1.1 Reduce congestion and crowding; 1.2 Improve travel time reliability; 1.3 Increase access to jobs and other destinations; 1.4 Improve connections among and within areas of concentrated growth; 2.1 Improve the safety of the transportation network; 2.2 Increase integration between travel modes and systems; 2.3 Provide more route and mode options and travel choices; 2.4 Sustain and improve operations of the regional system; and 3.1 Reduce transportation-related emissions. iv

9 Figure 1: Northern Virginia, The NVTA Region v
10 AUTHORITY AND PLANNING CONTEXT Virginia Senate Bill 576 established the NVTA in 2002 to prepare Northern Virginia s long-range transportation plan. The bill outlined the responsibilities and directives for the Authority essential to its mission as a regional transportation organization. Prior to the establishment of the NVTA, the Northern Virginia long-range transportation plan was prepared by the Transportation Coordinating Council. Following the creation of the NVTA in 2002, the Authority began to manage the Plan, now titled TransAction. The first two TransAction plans had planning horizon years of 2030 and 2040 respectively; this TransAction update also has a planning horizon year of 2040, but uses more recent planning data than the previous plan that it replaces. The role and purview of the Authority and TransAction have evolved with direction from the Virginia General Assembly, which passed House Bill 2313 (HB 2313) in 2013 to establish the current transportation investment mechanism. As part of this directive, TransAction seeks to measure the extent to which transportation projects bring value to the NVTA region, including the degree to which they provide congestion reduction relative to capital cost. The Authority operates independently but in conjunction with its partner jurisdictions, the Commonwealth of Virginia and other regional agencies. The plan is updated every five years. There is a synergy between the TransAction and the NVTA programming processes. First implemented for the NVTA fiscal year (FY) 2014 Program, the Code of Virginia mandates that projects funded by the NVTA with regional revenue funds must be included in TransAction. Following the adoption of this current TransAction version, the Authority will issue a Call for Regional Transportation Projects for the NVTA s inaugural Six Year Program to be funded using regional revenues collected in FY2018 through FY2023 (Figure 2). PLAN ELEMENTS TransAction follows a pattern typical of comprehensive long-range transportation plans. In the context of ongoing regional population and employment growth, it analyzes current and future travel needs, assesses how well the system meets those needs, identifies a range of projects to better meet those needs, and gives decision-makers the information needed to select the most impactful projects over the next 25 years. TransAction is the multimodal transportation master plan for Northern Virginia. It is a long range plan addressing regional transportation needs through The Plan focuses on eleven major travel corridors in Northern Virginia, and identifies over 350 candidate regional projects for future transportation investments to improve travel throughout the region. The plan includes the following elements: Baseline data about the transportation system; A statement of goals and objectives; A set of performance measures to compare alternative strategies and track progress over time; Forecasts of future conditions or needs; and vi

11 A set of project investments, policies, and strategies to support attaining the desired transportation conditions. General Process To develop TransAction, the NVTA worked within a collaborative structure with public officials, jurisdictional and agency staff, regional stakeholders, and individual citizens providing input to the Plan. Technical analysis included a rigorous modeling process based on accepted regional growth inputs and recent traffic and ridership data. The findings and recommendations will be used to develop the NVTA Six Year Program for transportation capital investment. Figure 2: The NVTA Roles Best Practices There are a number of regions, transportation agencies, and states with similar characteristics that have best practice experience and innovative approaches, which informed this TransAction plan. Peer metropolitan regions including Chicago, Boston, Philadelphia, and Toronto are conducting intensive stakeholder outreach, applying multimodal tools to understand transportation dynamics, and testing future scenarios to understand the robustness of plan assumptions. The NVTA reviewed these programs in designing the TransAction planning process. vii


12 NVTA MEMBER JURISDICTIONS AND AGENCIES Jurisdictions The development of TransAction relied heavily on close dialogue and coordination with the NVTA s member jurisdictions (Table 1 and Figure 3), more specifically elected officials, jurisdiction staff, and community members. Figure 3: Northern Virginia Jurisdictional Boundaries Table 1: NVTA Jurisdictions Counties Arlington County Fairfax County Town of Herndon Town of Vienna Loudoun County Town of Leesburg Town of Purcellville Prince William County Town of Dumfries Cities City of Alexandria City of Fairfax City of Falls Church City of Manassas City of Manassas Park State and Regional Transportation Agencies Planning the transportation system and funding projects involves numerous actors and plans (Figure 4). Along with the Northern Virginia counties, cities, and towns, the NVTA coordinates with other agencies that are engaged in planning and implementing transportation improvements across the region, including the National Capital Region Transportation Planning Board (TPB) at the Metropolitan Washington Council of Governments (MWCOG), Northern Virginia Transportation Commission (NVTC), Potomac and Rappahannock Transportation Commission (PRTC), Virginia Department of Transportation (VDOT), Virginia Department of Rail and Public Transportation (DRPT), Virginia Railway Express (VRE), and the Washington Metropolitan Area Transit Authority (WMATA). viii

13 Figure 4: Regional Planning in Northern Virginia COLLABORATIVE PLANNING Stakeholders played important roles in the development of TransAction. A joint committee structure of regional and community leaders was set up to facilitate review and action by each committee at an appropriate level of technical detail and policy impact. TransAction Subcommittee: Comprised of technical staff from the NVTA localities and regional agencies, the Subcommittee actively guided every step in the creation of TransAction. Participants met monthly and as often as three times per month to inform the Authority as it shaped planning policies and goals, review outreach results, shape technical methodology, and confirm analysis findings. Technical Advisory Committee (TAC): Members of this committee are appointees with leadership and technical experience in transportation. Meeting monthly through the course of TransAction development, the TAC reviewed interim technical products and made recommendations regarding the goals, objectives, and ultimate evaluation measures for the plan. ix
14 Planning Coordination Advisory Committee (PCAC): Members of this committee are elected officials representing each of the 14 counties, cities, and towns with populations of 3,500 or more that comprise the NVTA region. Meeting monthly through the course of TransAction development, the PCAC reviewed interim technical products and made recommendations regarding the goals, objectives, and ultimate evaluation measures for the plan. Planning and Programming Committee (PPC): Comprised of five Authority members. The PPC reviews all plan-related matters before making final recommendations for consideration by the Authority. Meeting as needed, the PPC provided an opportunity for Authority members who are part of the PPC to be briefed in depth on key elements of TransAction, including plan objectives and evaluation measures, and public opinion surveys. The TransAction plan is coordinated with other transportation plans at the local, regional, and state levels. The initial Draft Plan was developed through a thorough review of jurisdiction transportation plans and programs. Numerous projects are common to both TransAction and the National Capital Region Constrained Long-Range Plan (CLRP, 2016). However, while TransAction is coordinated with other plans, it also includes new proposed projects and initiatives beyond those that individual jurisdictions and other agencies have developed. TransAction is a fiscally unconstrained plan, meaning that it is not bound to any budget, and proposes more projects than can be realistically funded. While TransAction is focused on Northern Virginia, it is also a geographically unconstrained plan. It includes projects beyond Northern Virginia that are potentially beneficial to the mobility of Northern Virginians. Referred to as extra-territorial projects, these projects are included in TransAction for the purposes of sound long range transportation planning. However, the NVTA is generally unable to fund extra-territorial projects. The NVTA is a unique transportation planning entity. While the NVTA has many of the characteristics of a Metropolitan Planning Organization (MPO), the NVTA is not constrained by federal planning and performance monitoring requirements, and therefore has the ability to make independent funding decisions. OUTCOMES This report describes the TransAction process, but more importantly, it lays out findings and recommendations for an improved regional transportation system. TransAction directly informs the NVTA Six Year Program for capital funding, and it will serve as a guide for the jurisdictions and other transportation agencies as they prioritize projects, programs and policies. x
15 GLOSSARY Term BRT CAV CLRP DRPT FAST Act HB 2313 HB 599 ICM ITS LRT MAP-21 Act Definition Bus Rapid Transit. Enhanced bus system that may include features such as dedicated bus lanes, off-board fare payment, specialized branding, and real-time arrival information at shelters. Connected and autonomous vehicles. Connected vehicles use technologies to communicate with each other, drivers, and roadside infrastructure. Autonomous vehicles use technologies to enhance or replace vehicle driving functions. Financially-Constrained Long-Range Transportation Plan Virginia Department of Rail and Public Transportation Fixing America s Surface Transportation Act. National funding and authorization bill enacted in 2015 to provide long-term funding for surface transportation planning and investment. State legislation that designates tax revenues for use by the NVTA and Northern Virginia jurisdictions to invest in transportation. State legislation that requires evaluation of congestion impacts of NVTA-funded transportation investments. Integrated Corridor Management: optimizes use of available infrastructure by directing travelers to underutilized capacity in a transportation corridor. Intelligent Transportation Systems use information and communications technologies to enhance operation and management of transportation systems. Light Rail Transit. Train system that uses similar rolling stock as a tram or streetcar but generally operates on a dedicated rightof-way at higher speeds. Moving Ahead for Progress in the 21 st Century Act. National funding and authorization bill for surface transportation projects enacted in xi
16 Term MWCOG Motorized/Non-motorized Trips No Build 2040 NVTA Regional Activity Centers (RACs) Six Year Program (SYP) TDM TPB TransAction VDOT VRE WMATA Definition Metropolitan Washington Council of Governments Transportation forecasting generally accounts for trips that people take by car (via single-occupant vehicles and highoccupancy vehicles) and by transit (via Metrorail, commuter rail, bus). Non-motorized trips are made by walking or bicycle. Anticipated transportation conditions in 2040, including already funded projects but excluding new projects in the TransAction plan. Northern Virginia Transportation Authority MWCOG-designated areas of concentrated population and employment for strategic planning purposes. The NVTA s program for prioritizing and funding multimodal transportation projects. Transportation Demand Management is the application of strategies and policies to reduce travel demand, redistribute this demand in space or in time, or encourage travel by shared mode options such as carpooling and transit. Used interchangeably with Travel (or Traffic) Demand Management. National Capital Region Transportation Planning Board. Serves as the federally-designated Metropolitan Planning Organization (MPO). The long-range regional multimodal transportation plan for Northern Virginia and the focus of this report. Virginia Department of Transportation Virginia Railway Express commuter rail system Washington Metropolitan Area Transit Authority or Metro xii
17
18
19 TransAction Draft Technical Report BACKGROUND Part 1 sets the context for Northern Virginia s Long-Range Transportation Plan. With significant ongoing population and employment growth, regional economic growth will continue, supported by a strong integrated transportation network. New mobility options are changing the way people travel, and the impending deployment of connected and autonomous vehicles (CAVs) presents a new dynamic for regional plans and transportation investments. The NVTA conducted surveys to measure how Northern Virginians transportation experiences affect their quality of life. This information gives a useful set of priorities to guide planners and decision makers. Part 1 describes how the NVTA integrated input from members of the public and major stakeholders with the technical analysis to identify Northern Virginia s transportation needs and priorities. The NVTA formulated a series of performance-based goals and objectives designed to meet these identified needs and priorities. The process also considered potential contingencies, such as the introduction of new technology. Part 1 contains the following chapters: Chapter 1: Northern Virginia Growth and Transportation Chapter 2: The Regional Transportation Network Chapter 3: Future of Transportation What s New? Chapter 4: Public Perceptions About Transportation Chapter 5: Integrated Public Engagement Approach Chapter 6: Performance-Based Planning 1-1
20 TransAction Draft Technical Report CHAPTER 1: NORTHERN VIRGINIA GROWTH AND TRANSPORTATION Northern Virginia is home to the largest centers of population and employment in the Commonwealth. The region s geographic and economic connections with Washington, DC are strong and have contributed to the growth of a robust workforce, an active business environment, and healthy residential communities over the past few decades. TRANSPORTATION AND THE REGIONAL ECONOMY Northern Virginia has undergone a dramatic economic transformation over the past thirty years. Since 1980, Northern Virginia has produced over half of the Washington metropolitan area s growth in new jobs and welcomed a comparable number of residents of working age. 1 This growth and development has resulted in an increase in travel demand as Northern Virginia residents travel throughout the region, as well as into Washington, DC and Maryland, to access jobs, schools, and recreation. This interconnectedness is what makes the Washington metropolitan area an economically vibrant destination; however, these strong regional connections also contribute to increasing travel and accompanying congestion. Improving transportation within and to Northern Virginia contributes to continued economic growth in the region. Multimodal transportation options that connect regional growth centers and alleviate bottlenecks will allow the region to continue adding jobs and households, strengthening the economic base and improving quality of life. SOCIO-ECONOMIC GROWTH PATTERNS/TRENDS Population/Employment Density The Washington metropolitan region is home to more than seven million residents and more than four million jobs. Northern Virginia accounts for approximately one third of that total, including 2.4 million residents and over 1.3 million jobs. 2 The TransAction Plan analysis focuses on the Regional Activity Centers (RACs) defined by the Metropolitan Washington Council of Governments (MWCOG). RACs are identified for strategic planning purposes as they account for a large share of the region s current and projected population and employment. Northern Virginia has 63 RACs that account for around ten percent of the region s land area, and are mostly concentrated in higher-density areas, particularly inside the Beltway (Figure 1-1). Over 65 percent of Northern Virginia jobs are located within a RAC. 1 Fuller, Stephen. S. Northern Virginia s Economic Transformation NOVA Exec Magazine, Summer MWCOG,
 Source: MWCOG Round 9.")
21 TransAction Draft Technical Report Figure 1-1: Population Density and Regional Activity Centers (2040) Source: MWCOG Round 9.0 Cooperative Land Use Forecasts 1-3
22 TransAction Draft Technical Report The Rosslyn-Ballston corridor in Arlington County, which spans five RACs, represents the largest area of high-density residential development in Northern Virginia, as well as one of the highest concentrations in the Washington metropolitan area. By 2040, many RACs outside the Capital Beltway (I-495) will have comparable residential density to locales within the Beltway. Downtown DC will continue to have the highest concentration of jobs in the metropolitan area. Meanwhile, continued employment growth throughout Northern Virginia will add significant numbers of jobs to already prominent RACs such as Tysons, Reston, Old Town Alexandria, and throughout Arlington County (Figure 1-2). 1-4

23 TransAction Draft Technical Report Figure 1-2: Employment Density and Regional Activity Centers (2040) 1-5
24 TransAction Draft Technical Report Overall, Northern Virginia has a significant range of residential and employment density. The distribution of population and employment growth had numerous implications for the TransAction plan technical process, including key assumptions for the transportation network model. The distribution of growth between RACs and lower density areas (including within jurisdictions) is a critical consideration as smaller, more densely developed jurisdictions will see most of their growth within RACs. Jurisdictions with large land areas will see growth distributed across the jurisdiction. Population Growth MWCOG forecasts the Washington metropolitan area to experience significant growth, with an additional 1.6 million residents, resulting in a total metropolitan population of 8.8 million in This 23 percent growth will be matched in Northern Virginia, which is estimated to grow by 24 percent to almost three million residents. As shown in Table 1-1, the largest number of residents will be added in Fairfax County, while Loudoun County and the City of Falls Church are expected to experience the highest growth rates (30 percent or higher). In 2040, population densities in Northern Virginia will still be highest in the inner jurisdictions, particularly clustered along Metrorail stations in Arlington and Fairfax Counties, and the City of Alexandria. Data shows that the majority of Northern Virginia s population growth will occur within RACs a higher portion than in the metropolitan area as a whole. Table 1-1: Population Growth 2016 to 2040 Jurisdiction 2016 Population 2040 Population Growth Percent Growth Portion of Growth in RACs City of Alexandria 149, ,824 40,877 27% 98% Arlington County 222, ,055 55,093 25% 96% City of Fairfax* 24,948 27,875 2,927 12% 100% Fairfax County 1,132,792 1,362, ,651 20% 77% City of Falls Church* 13,330 17,311 3,981 30% 100% Loudoun County 373, , ,760 32% 34% City of Manassas* 43,613 51,452 7,839 18% 100% City of Manassas Park* 14,591 15,864 1,273 9% 100% Prince William County 437, , ,991 28% 19% Northern Virginia Total 2,413,009 2,994, ,392 24% 60% Washington Metropolitan Total Source: MWCOG, ,150,948 8,788,431 1,637,483 23% 46% *The cities of Falls Church, Fairfax, Manassas, and Manassas Park are entirely within an RAC. 1-6
25 TransAction Draft Technical Report Employment Growth The metropolitan area is also forecast to experience robust employment growth by 2040, with an additional 1.2 million jobs, for a metropolitan total of 5.3 million jobs. The metropolitan area s growth of 29 percent will be exceeded by that of Northern Virginia, where estimated job growth of 37 percent will result in approximately 1.9 million total jobs in Northern Virginia alone. As shown in Table 1-2, the largest numbers of jobs will be added in Fairfax County, while Prince William and Loudoun Counties are expected to experience the highest growth rates (60 percent or higher). Employment in Northern Virginia is expected to remain clustered around major activity centers, with almost 70 percent of jobs located in Northern Virginia RACs. The highest density employment locations are forecast to be near Metrorail stations, including: Orange/Silver Line corridor from Rosslyn to Ballston; Yellow Line corridor from the Pentagon to Alexandria; and Tysons, Springfield, Merrifield, and Reston. Beyond the Metrorail system, high employment densities are forecast around the Mark Center, Fort Belvoir, Fairfax Center, Woodbridge, Innovation, Quantico, and portions of the cities of Fairfax and Manassas. Table 1-2: Employment Growth 2016 to 2040 Jurisdiction 2016 Employment 2040 Employment Growth Percent Growth Portion of Growth in RACs City of Alexandria 107, ,735 35,726 33% 97% Arlington County 210, ,641 57,322 27% 96% City of Fairfax 20,988 25,600 4,612 22% 100%* Fairfax County 663, , ,651 30% 87% City of Falls Church 12,458 18,300 5,842 47% 100%* Loudoun County 168, , ,953 62% 58% City of Manassas 27,200 31,551 4,351 16% 100%* City of Manassas Park 4,644 5, % 100%* Prince William County 147, ,889 96,463 65% 30% Northern Virginia Total 1,362,880 1,873, ,382 37% 72% Washington Metropolitan Total Source: MWCOG, ,066,099 5,253,305 1,187,206 29% 60% *The cities of Falls Church, Fairfax, Manassas, and Manassas Park are entirely within an RAC. 1-7

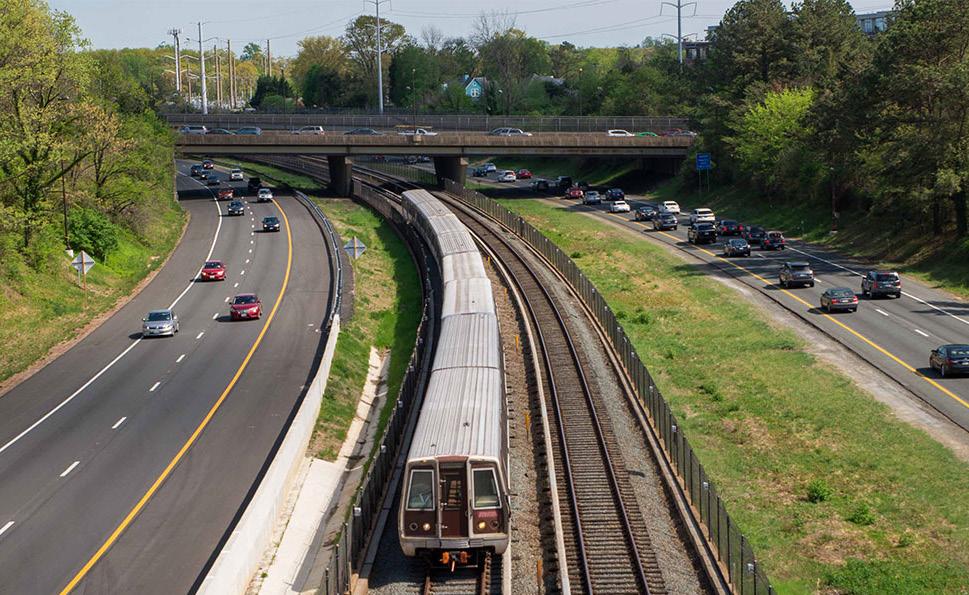
26 CHAPTER 2: THE REGIONAL TRANSPORTATION NETWORK TransAction Draft Technical Report Northern Virginia is located in one of the largest metropolitan areas in the country and has a complex and expansive transportation system to move people across the region. Figure 2-1 below highlights the major transportation infrastructure and services within the region. Table 2-1 on the following page provides a catalogue of major transportation infrastructure. Figure 2-1: Regional Transportation Network Map 1-8
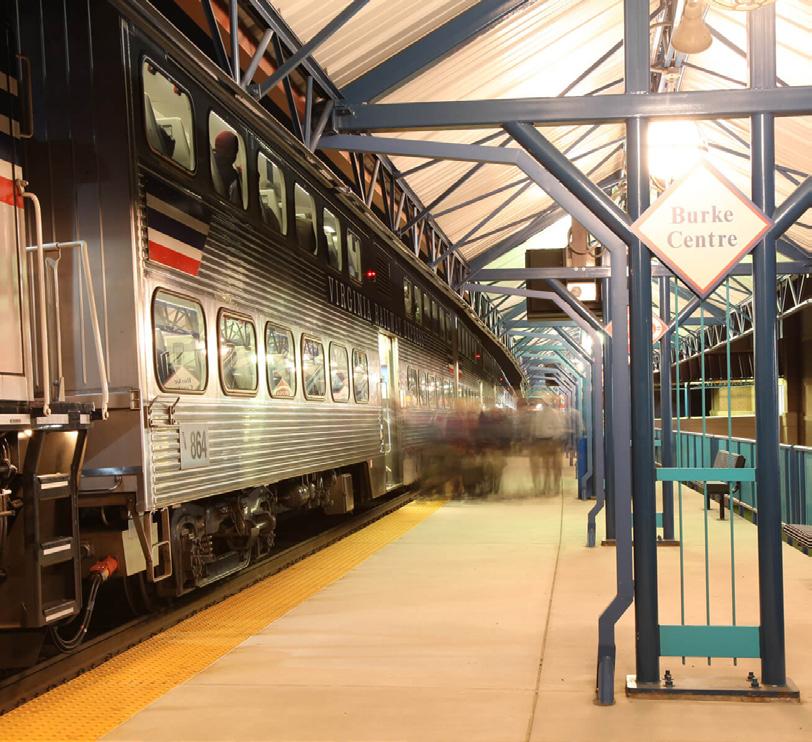
27 TransAction Draft Technical Report Table 2-1: Catalogue of Regional Transportation Facilities Mode Data Point Description Highway and Over 100 total Major Northern Virginia highways include: Express Lanes miles across the NoVa region o I-495 (Capital Beltway) segments within the City of Alexandria and Fairfax County with crossings of the Potomac River into Maryland at the American Legion Bridge and Woodrow Wilson Bridge; o I-395/95 segments within Arlington County, the City of Alexandria, Fairfax County, and Prince William County with a crossing of the Potomac River into DC at the 14 th Street Bridge; o I-66 segments within Arlington County, Fairfax County, and Prince William County, with a crossing of the Potomac River into DC at the Theodore Roosevelt Bridge; o Route 50 and Route 29 segments between Arlington County, and Loudoun and Prince William Counties, respectively; o Route 28 segments within Loudoun County, Fairfax County, and Prince William County; o Route 15 segments between Gainesville and Leesburg; o Route 1 segments between Arlington County and Prince William County; o Route 7 segments between the City of Alexandria and Loudoun County; o Fairfax County Parkway between Route 1 in southern Fairfax County and Route 7; o Route 267 Toll Road, consisting of the Dulles Toll Road and Dulles Greenway, between I-66 near the City of Falls Church and Route 15 in Leesburg; o I-495 Express Lanes between Tysons and Springfield; and o I-95 Express Lanes segment between Springfield and Prince William County. Arterial and Local Street Network Rail and Transit Over 10,000 total miles across the NoVa region 10 transit providers and over 200 routes All vehicular trips use this network for some or all of their journey; TransAction analysis shows that this network is essential to the regional transportation system. Rail Washington Metropolitan Area Transit Authority (WMATA) operates four heavy rail lines Blue, Orange, Silver, and Yellow within Northern Virginia as part of its Metrorail system. Each line offers services seven days per week. Virginia Railway Express (VRE), co-owned by NVTC and PRTC, operates two heavy rail commuter lines during weekday peak periods: Amtrak provides passenger rail service for trips between Northern Virginia and many national destinations. Bus Local and regional bus service is operated to, within, and between RACs by several NVTA member jurisdictions. Operators include ART, CUE, DASH, Fairfax Connector, LC 1-9
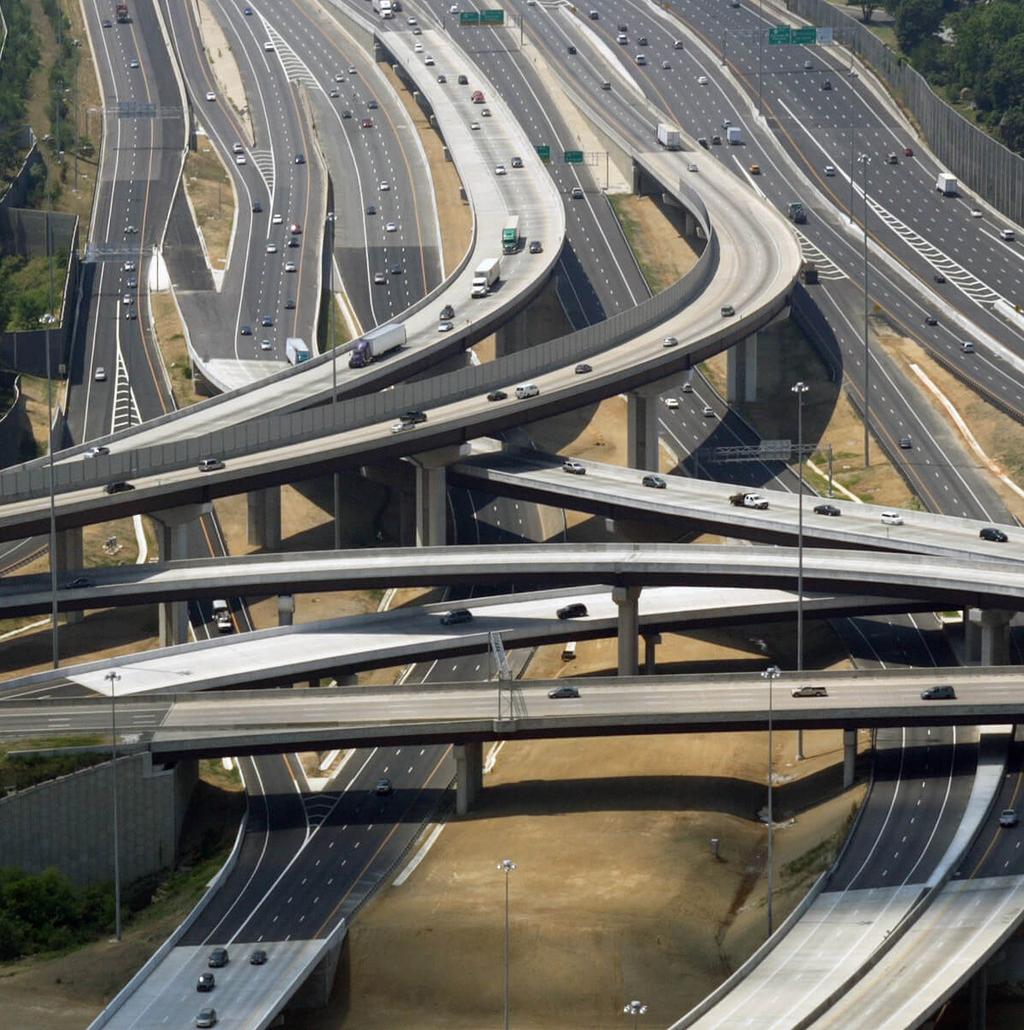
28 TransAction Draft Technical Report Transit, and PRTC. Within Northern Virginia, WMATA operates its Metrobus service within Fairfax County, Arlington County, the City of Fairfax, the City of Falls Church, and the City of Alexandria. WMATA also operates Metrobus service between Washington, DC and Washington Dulles International Airport in Loudoun County. Metroway bus rapid transit (BRT) line operating along the Route 1 corridor in Arlington County and the City of Alexandria; The District of Columbia Department of Transportation (DDOT) provides DC Circulator bus service between Rosslyn and Dupont Circle. Inter-city bus services are provided by privately run companies such as Vamoose, SprinterBus, Bestbus, and Washington Deluxe. Mode Data Point Description Other Shared Transportation Network Companies, such as Uber and Lyft, are Travel Modes becoming more popular alternatives to taxis. Slug lines allow commuters to save money and time and reduce emissions by meeting carpool requirements. Short-term car rental services, including ZipCar, Car2Go, and Enterprise CarShare, offer users the opportunity to rent a car for specific, short trips and errands. Bicycles and Pedestrians Freight Over 400 miles of paved and unpaved trails, bike lanes, and bikeways. Trucks carry about 75% of the freight tonnage within the Commonwealth of Virginia. Passenger Air Dulles International and Reagan National airports Bicycle Network Northern Virginia s bicycle network includes an extensive network of bikeways. Notable examples include the Mount Vernon Trail, Custis Trail, and Washington & Old Dominion Trail. Approximately 1/3 of the over 450 Capital Bikeshare stations throughout the Washington metropolitan area are located within Northern Virginia. Pedestrian Network Pedestrian networks, including sidewalks, trails, and street crossings, are extensive throughout Northern Virginia s dense and urban jurisdictions. These facilities are also common on major roads in Northern Virginia, including multi-use trails, sidewalks, or both outside urban areas. More than 16,000 miles of roadway carry more than 300 million tons of goods annually. Two Class I railroads operated by CSX Transportation and the Norfolk Southern Corporation consist of over 250 miles of mainline track and transport more than 47 million tons of local freight annually. One cargo airport Washington Dulles International Airport. Two major international airports Ronald Reagan Washington National Airport and Washington Dulles International Airport operated by the Metropolitan Washington Airports Authority 1-10
29 each serve over 20 million passengers annually. TransAction Draft Technical Report (MWAA). Manassas Regional Airport and Leesburg Executive Airport primarily serve private aircraft within the region. While the local jurisdictions are responsible for maintaining transportation plans for their roadway and transit systems, most county road networks are constructed, operated, and maintained by the Virginia Department of Transportation (VDOT). Conversely, Northern Virginia s cities and towns with populations over 3,500 maintain their own roads. Arlington County is the one local exception in that it is a county-level jurisdiction that maintains its own roads. 1-11
30 TransAction Draft Technical Report CHAPTER 3: FUTURE OF TRANSPORTATION WHAT S NEW? Transportation is evolving rapidly, with new technologies and new traveler preferences. Many of these changes take advantage of new technology, with some of the most dramatic changes yet to come, including CAVs. New transportation services are now available, including those operated by private providers, while the proliferation of shared mobility services provide ondemand and real-time transportation services. Meanwhile, evolving travel preferences are changing perceptions of what is possible in terms of public and private mobility services. From ride hailing and bike sharing to CAVs and micro transit, new technologies are providing mobility options that will significantly alter the transportation paradigm, including travel behavior, system performance, and future investments. Policy makers and transportation agencies will need to consider these complex issues as they develop plans and allocate resources. The following sections summarize the recent and emerging trends detailed in Appendix A and identify how they impact the TransAction Plan. REAL-TIME TRAVEL INFORMATION Travelers increasingly have real-time and multimodal information to take into consideration before making a trip. Information on congestion, travel times, and route options can be accessed by members of the public, helping them make informed choices about how to get around. Transit providers are also improving real-time data, both from GPS-equipped buses and time-stamped travel passes such as the region s SmarTrip card. With this robust new information, individuals and agencies can track decisions and provide real-time updates for travelers. This information can also support a series of dynamic actions, ranging from speed limits that vary based on expected congestion levels, to using tolls and transit fares that vary based on traffic volumes. This leads to a more efficient use of the overall regional transportation network. Transportation agencies have used Intelligent Transportation Systems (ITS) to help manage transportation operations for several decades. However, new sources of near real-time information from GPS-based probes and advances in wireless communication now make it possible to manage the transportation network in an integrated and dynamic fashion. As a result, agencies are developing a new, integrated set of tools to help manage traffic congestion and transportation in general. New data and traveler information has two sets of implications for TransAction. First, new and more comprehensive sets of performance measures, such as accessibility measures, are practical. Performance measures can be more robust than in the past given the significant increase in the volume and geographic distribution of available data. Second, the up-to-date, comprehensive, multi-modal information available for individual travel decisions may result in more reliable and cost-effective transportation choices and payment methods. 1-12
 on a shortterm or")
31 SHARING ECONOMY Shared mobility services, such as ZipCar, Capital Bikeshare, carsharing providers, among many others are now common in urban areas around the world, including Northern Virginia. Shared mobility refers to transportation services that allow individual users to access or share the use of a common vehicle (such as a bicycle, car, taxi, shuttle, bus, or scooter) on a shortterm or as-needed basis rather than using a private vehicle. Often, users access a pool of vehicles through the aid of a smartphone, computer, or tablet. Common examples of technology enabled shared mobility include ride hailing, carshare, bike-share, and shared shuttles. Across the country, this impressive growth in shared mobility points to strong demand for ownership of a trip rather than TransAction Draft Technical Report Did You Know? In October 2016, Fairfax County added 17 new Capital Bikeshare stations in Tysons and Reston. ownership of a personal vehicle. People are increasingly willing to forgo using a private vehicle for the comfort and ease of a shared option that meets their mobility needs. Shared mobility reduces the need for parking spaces, while less time spent looking for parking will reduce traffic congestion and emissions. However, the market for shared mobility is still evolving with new sharing models emerging all the time. The evidence is mixed regarding the growth of shared mobility options and implications for private care ownership and use. For example, while some shared mobility options serve as a complement to public transportation, it is unclear if the growth in sharing will eventually become a substitute for public transportation in some places, and reduce the effectiveness of buses and rail. Currently, the concentration of investment and availability of these new options is within core urbanized areas where activity levels are highest and where Metrorail and other transit services complement the new options. TRAVEL PREFERENCES Millennials now account for about 35 percent of the civilian labor force. Their travel patterns have changed from previous generations: only 46 percent of Americans have a driver s license by the time they are 19, versus 64 percent in More social interaction is carried out via social media, with 54 percent of Millennials reporting that they use social media to interact with friends rather than driving to meet in person. 3 Telecommuting continues to grow and on some surveys appears as the fastest growing mode of urban work trips. Additionally, 34 percent of the workforce is now employed as independent contractors or temporary workers, moonlight on more than one job, or operate small private firms with flexible hours. 3 Street Smart: The Rise of Cities and the Fall of Cars Sam Schwartz. 1-13
, an increase in telework options, and commercial availability")
32 TransAction Draft Technical Report Though demand for mass transit has increased nationwide, ridership growth in Northern Virginia (bus and rail) has stagnated in recent years. This is due, in part, to various challenges including Metrorail service reliability related to the SafeTrack repair program ( ), an increase in telework options, and commercial availability of transportation choices in the urban mobility landscape. However, local systems are responding by adding capacity and improving systems overall to be more customer focused. As a result, travelers in the region now have greater access to transit choices than ever before and greater latitude with when and how to travel. In sum, there appears to have been a decline in overall individual mobility. Increased use of social media, internet purchases, freelance employment, and reduced tendency to obtain drivers licenses mean that the future rate of per capita growth in automobile travel is likely to be slower than in past decades. VEHICLE TECHNOLOGY Vehicle technology is evolving rapidly. CAVs will include a range of functions that allow vehicles to automate the driving task, and communicate with roadside infrastructure and other vehicles. Advances in vehicle technology have the potential to improve safety, improve mobility for people with barriers to driving due to disability or age, and increase roadway capacity while allowing travelers to focus on other tasks. However, much remains unknown about the technology, including regulations, timing, and implementation requirements of CAVs and their impact on urban areas. Of course, it will take time for these new vehicles to spread Figure 3-1: Illustration of Connected and Autonomous Vehicle Features Source: National Highway Traffic Safety Administration through the fleet. Retrofitting, regulations, and market demand will be key in determining the pace of deployment. Planning implications include increased capacity per roadway lane, reduced car ownership rates, reduced transit operating costs, and the need for additional infrastructure investments. It is not yet clear the effect these new technologies will have on overall vehicle miles traveled or levels of congestion. Uncertainty about these effects, deployment timelines, and the regulatory framework make considerations in long-term plans, such as TransAction, difficult. 1-14
33 TransAction Draft Technical Report FUTURE SCENARIOS The trends described in this chapter have important implications for travel behavior, system performance, and future investments. Given uncertainty regarding the pace and breadth of new technologies and new mobility services, the TransAction Plan has incorporated analysis of several scenarios that cover the range of plausible possibilities. In developing the TransAction Plan, the NVTA has considered different possible futures, shaped in different ways by evolving technologies, behaviors, and policies. These scenarios, described and analyzed in Chapter 12, provide guidance on the range of possible futures, acting as a test of the Plan s resiliency as a whole. 1-15
34 TransAction Draft Technical Report CHAPTER 4: PUBLIC PERCEPTIONS ABOUT TRANSPORTATION The TransAction planning effort included multiple types of public and stakeholder input. This chapter summarizes two surveys conducted by the NVTA to understand public perceptions of transportation related to quality of life in Northern Virginia. Chapter 7 summarizes TransAction public involvement efforts focused on specific transportation problems and solutions across Northern Virginia. IT S ABOUT (YOUR) TIME OVERVIEW, PARTICIPATION, KEY TAKEAWAYS The NVTA conducted several surveys to understand public perceptions of transportation issues and projects in the Northern Virginia region. The goal was to document the range of public views so that the resulting plan could respond directly to public values and concerns. The TransAction Benchmark Survey conducted in October 2015 established an initial assessment of public perceptions of transportation issues and agencies; a follow-up Tracking Survey conducted in December 2016 measured changes in public opinion. Each survey had a sample size of 606 individuals across all age groups and across all Northern Virginia jurisdictions. Detailed survey results are presented in Appendix B. Quality of Life Perceptions Over the one-year tracking period, the perception of quality of life and optimism for future improvement in the context of transportation increased favorably. Overall interest and knowledge of transportation issues also increased. Among the transportation-related factors that affect quality of life for Northern Virginians, traffic flow and congestion continue to be of concern for the largest segment of respondents. Convenient access, transportation options, and the state of the transportation infrastructure were cited less often as the main factor influencing quality of life (Figure 4-1). The 2016 survey confirmed the growing importance of predictable trip times, increased travel options, and locating new growth near transit. 1-16


35 Figure 4-1: Transportation and Quality of Life Survey Findings ( ) TransAction Draft Technical Report Press Coverage Perceptions Press coverage of transportation issues in Northern Virginia is perceived as negative. Amongst residents who self-identify as aware of transportation issues, only a quarter of respondents cite positive press. Metro/WMATA safety, operations, ridership, and expansion are identified among the major transportation issues covered by the press. Surveyed residents also noted negative media coverage regarding the proposed I-66 toll lanes and general traffic congestion. Traffic Flow and Congestion Perceptions The Benchmark Survey and Tracking Survey evaluated personal transportation values of Northern Virginia respondents. Based on the surveys, traffic flow and congestion is the biggest factor contributing to quality of life. Residents believe the region is doing a poor job managing traffic flow and congestion (71 percent) and find the issue to be important due to time lost (81 percent). Respondents perceive that the region is doing a good job at addressing convenient access to transportation and is providing transportation options. Respondents had a more favorable view of maintenance and quality of transportation infrastructure (including roads, bridges, rail and trails): in 2016, 68 percent said that the region is doing mostly a good job, up from 43 percent in The percentage of respondents aware of the TransAction Plan doubled from eight percent to 15 percent over the year-long tracking period. 1-17
36 TransAction Draft Technical Report Survey results attributed high importance with poor performance, signifying that the region should prioritize improvements to poor-performing areas of the transportation network. Priorities for survey respondents included: Reducing trip times; Offering an affordable transportation system; Improving predictability of trip times; Investing in new highways and road improvements; and Utilizing new technologies to make the system more efficient and safer. The survey determined that reducing travel time has the most support and interest among residents, particularly among those who live and work in different jurisdictions. 1-18

37 TransAction Draft Technical Report CHAPTER 5: INTEGRATED PUBLIC ENGAGEMENT APPROACH The TransAction Plan incorporates stakeholder input and community dialogue to identify regional transportation needs and solutions. Throughout the planning process, stakeholder outreach and technical analysis complemented and informed one another to generate a balanced and effective transportation plan for Northern Virginia (Figure 5-1). STAKEHOLDERS The NVTA engaged a wide range of stakeholders across Northern Virginia to gather feedback, inform the technical process, and develop the TransAction Plan. Feedback was solicited using multiple communication platforms and in various forums throughout the region. Public meetings, pop-up events, workshops, and online engagement were strategically planned throughout the nearly two-year process to inform the technical process. Figure 5-1: Integrated Technical/Public Engagement Approach The TransAction planning effort facilitated ongoing dialogue with state, regional, and local government organizations, all of which have an active interest in Northern Virginia s future transportation system. Other stakeholders included: business improvements districts; chambers of commerce; and bicycle, environmental, and special interest advocacy groups. This outreach played an important role throughout the TransAction process. Stakeholder engagement activities in spring and fall 2016 resulted in over 4,000 public comments and responses. Analysis of public input informed the identification of regional needs and the prioritization of projects by conveying public attitudes and values related to transportation investments. 1-19


38 TransAction Draft Technical Report PUBLIC ENGAGEMENT The public engagement initiative behind TransAction featured three phases of public engagement, along with a preliminary benchmark survey and mid-point public perception tracking survey. These were staged to align with the ongoing technical analysis: needs identification, project prioritization, and consensus-building. For each phase, outreach activities ran in tandem with the plan s technical analysis and direction. Throughout all three phases of outreach, the TransAction team posted on social media sites, such as Twitter and Facebook, to inform the public of the plan s progress and participation opportunities. Similarly, the TransAction team communicated by to a large mailing list of interested Northern Virginians. These e-blasts included in-depth articles explaining different technical aspects of the planning process. Phase 1: Needs Assessment Public engagement began in fall 2015 when TransAction was introduced to the region with a press event and website launch. The website, NVTATransAction.org, included background on the plan, opportunities to participate, calendar, news, and contact information. It was directly linked to the primary NVTA website. The first phase of public engagement in spring 2016 focused on identification of transportation needs. It consisted of 12 pop-up events and five workshops held throughout Northern Virginia. Activities and boards focused around a central question: What s your transportation problem? Participants provided over 1,400 responses to this question, letting the NVTA know about their transportation needs and concerns (Appendix B). Public input was collected in parallel to Young people want to work in urban areas with walkability, bikeability, and public transportation. the technical modeling analysis. These simultaneous efforts were used to generate lists of major transportation needs by corridor and sub-area within Northern Virginia. These needs lists were subsequently used to brainstorm potential solutions. Phase 2: Solution Assessment The second phase of outreach focused on prioritization of solutions related to the transportation needs identified during the first phase of the outreach process. It consisted of an online survey with almost 2,800 responses; one stakeholder workshop, three workshops on George Mason University campuses, four pop-up events; an online poll; and four professionally led focus groups two comprised of residents from inside the Beltway and two comprised of residents 1-20
39 TransAction Draft Technical Report from outside the Beltway (Appendix B). Public input on solutions was used to aid project prioritization. Projects employing solutions preferred by the public were given greater priority in the selection process. Benchmark Survey and Tracking Survey The benchmark survey was conducted in December 2015 to gauge general attitudes and opinions towards transportation in Northern Virginia. A follow-up tracking survey in December 2016 highlighted changes in public perceptions over the course of the first year of public outreach. Phase 3: Plan Assessment The third and final phase of outreach centered around receiving feedback on the TransAction Draft Report. To publicize the TransAction public comment period and public hearing, the NVTA implemented a communications plan through print and online mediums, as well as multiple town hall forums and jurisdictional presentations across the region. The TransAction Draft Plan was released on June 9, 2017, with the subsequent comment period ending on July 23, The Authority s July 13 public hearing also featured on open house with information about the TransAction Plan, process, and implementation schedule. 1-21


40 CHAPTER 6: PERFORMANCE-BASED PLANNING TransAction Draft Technical Report WHAT IS PERFORMANCE-BASED PLANNING? Performance-based planning is a data-driven, strategic approach that allows agencies to weigh the tradeoffs between competing packages of transportation investments. It allows policies and goals to be expressed in quantifiable terms and creates an analytical framework to determine the degree to which different investment packages meet the policies and goals. This approach is intended to lead to a more systematic and analytical selection process for investment priorities. It also allows for ongoing monitoring of the performance of investments to inform future decision-making and to enable adjustments to be made as necessary over time as the plan is updated every five years. Vision: The vision statement articulates a preferred idealized state. Goals: Goals focus on priorities and outcomes the region desires to move toward. Objectives: Objectives are measurable and targeted actions that result in incremental but tangible advancement toward the stated goals. Performance Measures: Performance measures are used to evaluate potential performance of the transportation network. They derive from the stated objectives. Objectives can and should change over time as the region progresses and diverse aspects of goals become more pronounced in response to contemporary issues or understanding. A performance-based planning process includes setting a strategic direction ( where do we want to go? ) built on a foundation of data from monitoring and evaluation of system performance ( where are we now? ), followed by analysis of how the region will move toward achieving its goals through investments and policies ( how are we going to get there? ). Appendix C goes into more detail about existing literature, case studies, and best practices on performance-based planning. MAP-21 AND FAST ACT REQUIREMENTS Across the country, there is increasing emphasis on using performance management approaches in federal and state programs, planning requirements, and funding opportunities. Recent MAP-21 and FAST Act legislation 4 established a transportation performance management program. These laws establish national performance goals and require states and regions to invest resources in projects that collectively advance national goals. The performance planning process is systematically applied, creating a regular ongoing process of communicating key information to decision makers to help them understand the consequences of investment decisions across transportation assets and modes. 4 The Moving Ahead for Progress in the 21 st Century (MAP-21) Act and Fixing America s Surface Transportation (FAST) Act are federal funding and authorization bills enacted in 2012 and 2015, respectively. 1-22
41 TransAction Draft Technical Report As previously mentioned, the NVTA is not required to follow such federal legislation but chooses to do so as to utilize best practices for long-range transportation planning. For the TransAction planning, the NVTA incorporated the performance- and goal- based planning standards as established in the legislation to align the TransAction plan with current best practices. VISION, GOALS, AND OBJECTIVES The adopted vision for TransAction states: In the 21st century, Northern Virginia will develop and sustain a multimodal transportation system that enhances quality of life and supports economic growth. Investments in the system will provide effective transportation benefits, promote areas of concentrated growth, manage both demand and capacity, and employ the best technology, joining rail, roadway, bus, air, water, pedestrian, and bicycle facilities into an interconnected network that is fiscally sustainable. The TransAction regional vision is articulated through goals and objectives, and the Plan components are quantified through performance measures, which can support multiple goals and objectives. These goals and objectives are intended to be nuanced and flexible enough to reflect changing and uncertain conditions in the real world, while at the same time being simple and reliable enough to be consistently evaluated with available data and tools. In addition, they must be readily understood by stakeholders and decision-makers. Objectives are measurable and targeted actions that result in incremental but tangible advancement toward the stated goals. Objectives will evolve over time and in subsequent updates to the TransAction Plan. The region will continue to change, and different goals will become more pronounced in response to contemporary issues. The objectives address a range of different transportation needs. Performance by location and by objective varies across the region. The performance measures facilitate quantitative comparison and discussion about which improvements are best for the given context. PERFORMANCE MEASURES AND WEIGHTS The TransAction Subcommittee, the NVTA Planning and Programming Committee, the NVTA Technical Advisory Committee, and the NVTA Planning Coordination Advisory Committee provided input on the definition and weighting of performance measures. The set of measures and weights establishes continuity between TransAction and the NVTA s FY Six Year Program. 5 The approach, approved on February 9, 2017, also strives for simplicity in explaining measures and weights to the public while respecting the priorities identified by the committees. The measures and weights ultimately adopted by the NVTA for TransAction are shown in Table 6-1. Refer to Appendix D for more detailed information on goals, objectives, performance measures, and weights. 5 Virginia Code mandates that the NVTA is responsible for developing and maintaining the long range transportation plan fornorthern Virginia. Any project to be included in the NVTA Six Year Program must be evaluated in accordance with a state-mandated process referred to as HB 599, which takes its name from legislation enacted by the Virginia Assembly in
42 TransAction Draft Technical Report Table 6-1: Weighted Measures Goals Objectives Performance Measures 1 Goals Supported 2 NVTA Adopted Weights Goal 1: Enhance quality of life and economic strength of Northern Virginia through transportation Goal 2: Enable optimal use of the transportation network and leverage the existing network Goal 3: Reduce negative impacts of transportation on communities and the environment 1.1 Reduce congestion and crowding experienced by travelers in the region 1.2 Improve Travel Time Reliability Increase access to jobs, employees, markets, and destinations Improve connections among and within areas of concentrated growth Improve the safety of transportation network Increase integration between modes and systems Provide more route and mode options to expand travel choices and improve resiliency of the system Sustain and improve operation of the regional system Reduce transportation-related emissions Total Person Hours of Delay (HB599) 10% Transit Crowding (HB599) 5% Person Hours of Congested Travel in Automobiles % (HB599) Person Hours of Congested Travel in Transit Vehicles (HB599) 5% Congestion Severity: Maximum Travel Time Ratio 5% Congestion Duration (HB599) 10% Percent of jobs/population within 1/2 mile of high frequency and/or high performance transit Access to Jobs within 45 mins by auto or within 60 mins by transit (HB599) Average travel time per motorized trip between Regional Activity Centers Walkable/bikeable environment within a Regional Activity Center 5% 5% 5% 5% Safety of the transportation system 5% First and last mile connections 10% Travel by non-sov modes 10% Person hours of travel caused by 10% increase in PM peak hour demand (HB599) 5% Vehicle miles traveled (VMT) by speed 10% [1] HB599 indicates measure used by VDOT during the HB599 Evaluation and Rating process for the FY and FY2017 Programs. [2] TransAction performance measures are designed to support multiple goals. See below for distinction between primary and secondary goals, as supported by each measure. indicate primary goal supported by each measure. indicate other goals supported by each measure. 1-24

43
44
45 REGIONAL TRANSPORTATION NEEDS Residents of Northern Virginia overwhelmingly agree that transportation plays a critical role in their quality of life. The results of stakeholder outreach validate and reaffirm TransAction s goals and measures, and informed the technical analysis used to create the Plan. Between 2016 and 2040, daily vehicular trips in Northern Virginia are anticipated to increase by 1.6 million (21 percent). Modeled trip patterns forecast high growth in travel among RACs in Northern Virginia, and lower growth in trips to the traditional DC core. Similarly, 2040 travel conditions reflect increasing congestion on regional roadways and transit lines within Northern Virginia further from the DC core. This part contains the following chapters: Chapter 7: Stakeholder and Public Inputs Chapter 8: Regional Travel Patterns and Trends Chapter 9: Travel Conditions 2-1
46 CHAPTER 7: STAKEHOLDER AND PUBLIC INPUTS The NVTA sought to engage stakeholders and members of the public in a meaningful and effective way to develop the TransAction Plan. The NVTA invested in a thorough public opinion survey to gauge the attitudes of Northern Virginians towards transportation. The NVTA designed each phase of the two-year planning and public engagement process to define, then act upon, transportation needs, priorities, and solutions within Northern Virginia. WHAT S YOUR (TRANSPORTATION) PROBLEM? Phase 1 of the public engagement approach involved a needs assessment. To gather public input on regional transportation needs for TransAction, the NVTA held twelve pop-up and five workshop events in three counties and five municipalities in Northern Virginia. In addition to pop-ups and workshops, the public also had the opportunity to submit their feedback online at NVTATransAction.org. I ve lived here 60 years, and watched the evolution of the Metro region to become the 6 th largest Metro area. -Online survey respondent The NVTA sought to include participants from all counties and municipalities within Northern Virginia. Two events were located at Metrorail stations to capture the opinions of transit users. Participation at the annual Bike to Work Day event allowed the NVTA staff to engage with cyclists. The Authority also sought to include people of all backgrounds and ages, such as senior citizens, Spanish-speakers, millennials, and families. Comments were collected via comment sheets, an activity board, and the project website. Future Transportation Trends The NVTA engaged with the public to discuss five transportation trends that may impact congestion by the year These trends encompass changes in technology and evolving work and consumer habits, including: Population and employment growth Increased cost of driving Increased ubiquity of ridesharing and connected and autonomous vehicles Increased use of information technology Reduction in travel for work and shopping Congestion on Interstate 95 An overwhelming percentage of the 270 online and in-person respondents (approximately 87 percent) identified population and employment growth as the trend most likely to contribute to worsening congestion. Opinions of the transportation trends most likely to decrease congestion were less unanimous. Half of the respondents indicated that a declining need to travel for work and shopping would have the most significant impact for improved future congestion. Respondents attributed this impact to the growing popularity of online shopping and 2-2

47 teleworking. Around 20 percent of respondents believed an increase in the cost of driving would be the future transportation trend most likely to improve congestion in the region. Travel Choices and Travel Time The benchmark survey indicated that the average Northern Virginian resident makes around seven nonwork vehicular trips per week, each of which may include multiple destinations. An important part of the TransAction plan is understanding travelers mode of transportation when taking non-work trips. A modal choice activity was conducted to determine how travel time and destination affected which mode participants used to complete these non-work trips. 72 percent of the VRE s Burke Centre Station 800 participants indicated they use a car for non-work trips, a figure higher than the overall commute rate. Many individuals indicated that convenience and travel time motivated the decision to travel by car, while others made their decision based on accessibility to options and safety considerations. In general, however, reducing travel time was influential in determining which mode to take, as nearly 60 percent of non-work car trips by the respondents were less than 20 minutes. What one thing would you change about transportation in Northern Virginia? Participants also had the opportunity to respond to the question: What one thing would you change about transportation in Northern Virginia? This activity garnered 1,373 comments, of which 418 were submitted online. The comment responses, illustrated by type in Figure 7-1, reflected the multimodal nature of transportation in Northern Virginia. Respondents were particularly concerned with improving the coverage, reliability, and safety of the transit network in Northern Virginia, as well as increasing the capacity of roadways to help relieve congestion. Other respondents felt that bicycle facilities could be improved throughout the region. 2-3


48 Figure 7-1: Responses by Type to Survey Question: What One Thing Would You Change About Transportation in Northern Virginia? 9% 2-4

49 PRIORITIES AND SOLUTIONS Initial TransAction outreach in spring 2016 confirmed a general perception regarding the state of transportation in Northern Virginia: it is not easy to get around the region. In response, NVTA staff engaged with regional stakeholders and citizens during fall 2016 to learn how the public values and prioritizes transportation improvements, and more importantly, the measures required to evaluate whether these improvements will effectively alleviate congestion and improve mobility within the region. An extensive outreach approach, including a second online public survey, targeted workshops, and focus groups, was undertaken by the NVTA to gain a greater understanding of the public priorities towards transportation in Northern Virginia. A key strategy of the outreach plan was to distinguish specific subregions of Northern Virginia for improved public input. Public Survey A separate public online survey to gauge opinions about transportation improvements was conducted in fall 2016 and garnered over 2,800 individual responses. The survey provided participants with an opportunity to voice their opinions about regional transportation priorities in Northern Virginia. While the survey was accessible online, the NVTA also appeared at locations throughout the region to perform on-site surveys targeting demographic groups, including multilingual communities, often underrepresented by online outreach. In particular, the NVTA engaged with Spanish and Vietnamese-speaking populations at these on-site outreach events. The key takeaway from the public survey is that Northern Virginians find all TransAction measures relevant and important indicators for an improved transportation network and quality of life. The confirmation of regional values validated the technical approach to developing Northern Virginia s transportation plan. The results demonstrated the importance of transit and alternative commute options in Northern Virginia. Both access and capacity improvements to transit were identified as priorities. Improved connections and mode capacity to regional activity centers within Northern Virginia and the DC core were also a shared priority for respondents. Roadway safety and capacity were concerns for all major corridors, most notably the I-95 corridor. Respondents felt that travel reliability and reduced delays were the most important indicators of an improved transportation network, as well as an improved quality of life. These opinions were consistently expressed throughout Northern Virginia subregions with differing existing 2-5
50 transportation infrastructure and were not specific to a mode. Likewise, increasing the number of multi-modal travel options was deemed a high priority to the public. Focus Groups and Workshops In October 2016, the NVTA invited business and transportation interest groups to participate in facilitated round-table discussions on regional transportation priorities. Regional differences in transportation priorities varied by distance from DC, as well as by current access to transit. Inside the Beltway residents identified reduced crowding on bus and rail as an important measure for the TransAction plan. Outside the Beltway residents viewed improved safety for crash reduction as an important measure. Although these priorities differed slightly based on the existing transportation network of the respective areas, the priorities were both viewed as important to achieving the regional goal of improved reliability and more travel options. Overall, priorities for inside the Beltway residents and outside the Beltway residents had more similarities than differences. Figure 7-2 ranks priorities by importance among participants; Figure 7-3 shows generalized needs for areas within the region. Figure 7-2: Top Regional Transportation Priorities Reduce delays during commute hours 18% Increase the number of travel options (e.g. bus, rail, rideshare) Increase connections between business/residential centers Increase travel time reliability throughout the day 16% 15% 15% Increase access to rail stations for pedestrians, bikes, and buses 12% Reduce number of single-occupancy vehicles during commute hours 8% Improve roadway safety to reduce vehicle crashes 6% Reduce impacts of transportation on the environment Reduce crowding on bus and rail 4% 4% Reduce transportation costs 3% Future Technologies 1% 0% 5% 10% 15% 20% Percentage Respondents 2-6
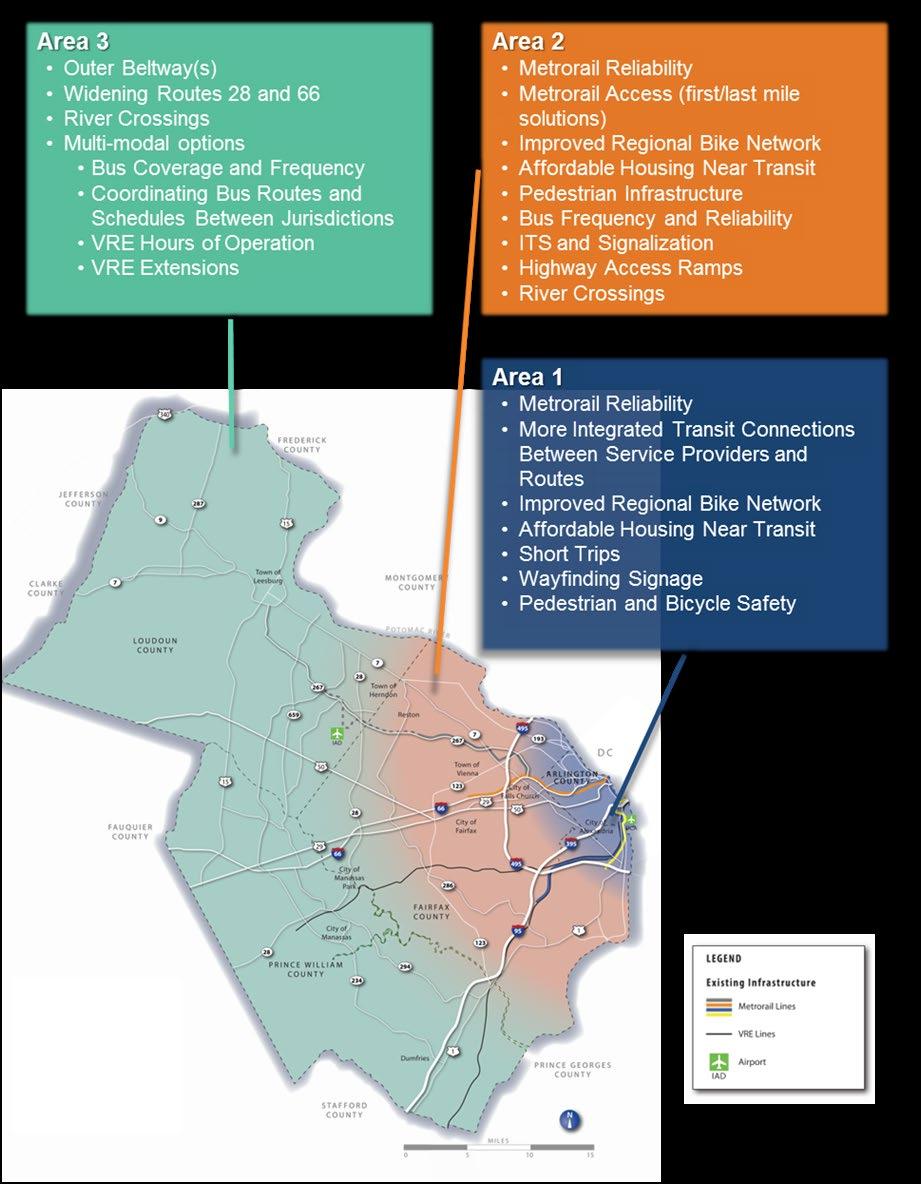
51 Figure 7-3: Transportation Needs by Geography 2-7
52 In November 2016, the NVTA conducted four focus group discussions of regional transportation issues and priorities to identify objectives to guide the TransAction plan. These focus group discussions represented a cross-section of Northern Virginia residents, with two discussions oriented towards residents living inside the Beltway and two discussions oriented towards residents living outside the Beltway. The transportation priorities and issues identified at the November focus groups were generally consistent with the findings from the October workshop. Reducing delays during commute hours was the greatest priority for participants, followed by increasing travel time reliability. Mode choice use and priority was determined by the travel destination and origin. Public transportation was deemed a viable option for trips to and from DC; however, travel by automobile was found to be the most prevalent mode of respondents to get around Northern Virginia. While residents living inside the Beltway were more likely to use and prioritize transit, participants living outside the Beltway were also supportive of transit and other multi-modal travel options as means to help relieve congestion. Participants in the focus groups agreed that congestion has a significant impact on their daily routines and life decisions, including where they choose to live and work, and how much time they get to spend with family. Investments in multi-modal transportation improvements throughout Northern Virginia were therefore deemed critical to addressing increases in congestion within the region. Additionally, NVTA conducted workshops at George Mason University locations in the City of Fairfax and Arlington County to engage a younger demographic. Most participants belonged to the millennial generation. Attendees at the workshop included students from various academic disciplines, including some students familiar with engineering, transportation systems, and emerging trends in technology. Feedback on priority objectives was comparable to both the general public as well as key stakeholders. Reliability and reduced delays were the highest priority. The key difference was the higher importance of transportation impacts on the environment, as well as the reduction of Single Occupancy Vehicles (SOVs) during commute hours. This may reflect differing generational values and/or a more adept knowledge of transportation analysis. Reduced transportation costs were the lowest priority; which is notable considering the limited income and working status common of students. JURISDICTION AND AGENCY PLANS To assess the perceived needs of these various jurisdictions and agencies, an extensive review of jurisdictional comprehensive master plans, transit development plans, transportation demand management plans, and regional plans for Northern Virginia was conducted. Additionally, joint meetings between the Authority, representative staff from each jurisdiction/agency, and the consultant team included discussions of needs. 2-8
53 CHAPTER 8: REGIONAL TRAVEL PATTERNS ANDTRENDS TransAction Technical Report Northern Virginia is projected to grow by an additional 510,000 residents and 580,000 jobs by With this anticipated growth comes additional travel on Northern Virginia s transportation facilities. TRAVEL TRENDS In 2016, over 7.5 million vehicular trips, which includes travel by automobile and transit, were made daily within Northern Virginia. Commute trips accounted for 1.7 million daily trips, or 23 percent of daily total trips. However, a clear majority of trips within Northern Virginia are made for non-work purposes, such as shopping, school trips, or doctor s visits. These trips occur almost entirely within Northern Virginia and generally take place within 5 miles of the traveler s home. These figures include trips with their starting and/or ending location in Northern Virginia. MWCOG forecasts that total daily vehicular trips within Northern Virginia in 2040 will surpass 9.1 million vehicular trips. Over one half million more commute trips will occur daily on Northern Virginia transportation facilities in 2040, increasing to 2.2 million trips. Commute trips will Projected Travel Growth in Northern Virginia, Vehicular trips: +27% Commute +20% Non-commute Non-motorized trips: +85% Commute +50% Non-commute account for 24 percent of all vehicular trips made in Furthermore, an additional 1.1 million non-work trips are anticipated to occur daily for non-work purposes. For more detail on transportation modeling techniques used to derive these and other future numbers, refer to Appendix E. Non-motorized transportation modes, which includes bicycle and pedestrian travel, make up a relatively small, but rapidly increasing share of commute trips within Northern Virginia. An extensive regional trail network, expansion of bikesharing facilities, and improvements to the bicycle and pedestrian environment within activity centers have made non-motorized travel an appealing option for many commuters. In 2016, approximately 3 percent of commute trips originating in Northern Virginia were made by bicycle or pedestrian modes. By 2040, the number of non-motorized commute trips is anticipated to nearly double, bringing their regional share of daily commute trips up to 5 percent. Among residents living and working within RACs, higher non-motorized shares apply. REGIONAL TRAVEL PATTERNS Given the sustained development in population and employment centers throughout Northern Virginia and across the greater DC metropolitan area, a diverse set of commute trip patterns exists in the region today. Figure 8-1 illustrates the various locations where Northern Virginians travel to and from on their daily commutes. 2-9

54 Figure 8-1: 2016 Vehicular Commute Trip Patterns Within Northern Virginia TransAction Technical Report Fairfax County is the largest contributor to vehicular travel in Northern Virginia, with more than half of all trips in Northern Virginia starting and/or ending within the county. This is perhaps unsurprising considering that Fairfax County also accounts for nearly half the population and employment within Northern Virginia. Fairfax County is a major attractor of trips from Prince William and Loudoun Counties, as well as trips originating within Fairfax County. Arlington County and DC are also significant attractors of commute trips for trips originating in Northern Virginia. Approximately one-third of commute trips stay within the city or county where they originated. These points altogether indicate that many people both work and live in Northern Virginia. 2-10
55 Between 2016 and 2040, the region is forecasted to experience significant growth in the number of commute trips traveling to/from counties and cities within Northern Virginia, as shown in Table 8-1 and Table 8-2, respectively. While growth is anticipated throughout Northern Virginia, Fairfax County is forecast to see the greatest absolute increase in commute trips. While not contributing the absolute totals of Fairfax County, Loudoun and Prince William Counties are anticipated to have the largest relative growth in commutes between 2016 and This growth in commute trips within the region places additional stress on a transportation system that is already highly utilized during peak periods and subject to increasingly severe and recurring congestion and crowding on its roadway and transit facilities. Table 8-1: Commute Trips Originating in Northern Virginia Jurisdiction Difference % Growth Table 8-2: Commute Trips Destined for Northern Virginia Jurisdiction Difference % Growth City of Alexandria 98, ,510 22,407 23% City of Alexandria 82, ,741 24,482 30% Arlington County 138, ,813 27,299 20% Arlington County 273, ,990 76,705 28% Fairfax County 709, , ,009 21% Fairfax County 696, , ,811 27% Loudoun County 209, ,362 70,994 34% Loudoun County 128, ,797 71,653 56% Prince William County 275, ,702 80,480 29% Prince William County 171, ,240 82,374 48% District of Columbia 308, ,407 84,514 27% District of Columbia 1,017,300 1,188, ,071 17% Between 2016 and 2040, sustained, concentrated growth for both population and jobs is anticipated for RACs throughout the DC metropolitan area and particularly within Northern Virginia. In 2016, over four million vehicular trips, including one million commute trips, either started and/or ended within a RAC within Northern Virginia. By 2040, the number of trips starting and/or ending within a RAC will increase to over 5.4 million vehicular trips and 1.5million commute trips daily. While growth is expected throughout nearly all RACs in Northern Virginia by 2040, the most substantial increases in population and employment are anticipated in Tysons, Reston Town Center, the Rosslyn-Ballston and Dulles-Route 28 corridors, and emerging RACs within eastern Loudoun County, and along the I-66 and I-95 corridors in Prince William County. Table 8-3 and Table 8-4 summarize the Northern Virginia RACs anticipated to be the largest employment and residential centers, respectively, in

56 Table 8-3: Major Employment Centers Activity Center % Growth Table 8-4: Major Residential Centers Activity Center % Growth Dulles South 152, ,942 25% City of Manassas 120, ,832 10% Merrifield / Dunn Loring 130, ,268 31% Fairfax Center 108, ,320 13% Tysons Central , ,791 11% Merrifield / Dunn Loring 70,440 97,193 38% Fairfax Center 147, ,197 5% Fairfax City 83,782 92,956 11% Crystal City 110, ,456 25% City of Manassas 123, ,995 4% Bailey's Crossroads / Western Gateway Landmark / Van Dorn 66,226 80,523 22% 70,960 77,702 10% TRIP LENGTH Within Northern Virginia, home-based commute trips are generally longer than trips made for non-commuting purposes, such as shopping, doctor s appointments, or trips to school. The average length of daily commute trips varies widely by jurisdiction within Northern Virginia. Commute trips from Prince William and Loudoun counties on average exceed 18 miles one-way in 2016, while the average commute from Arlington County or the City of Alexandria is less than nine miles. However, non-commute trips, which are more localized in nature, vary minimally throughout Northern Virginia; shoppers travel nearly the same distance to run errands throughout the region. Over 50 percent of non-commuting trips made daily within Northern Virginia are less than five miles in length. As shown in Figure 8-2, commute trips in 2040 will still be lengthy for many commuters, but given increasing densities of housing and employment in major activity centers within Northern Virginia, the average distance a commuter will travel daily will decrease slightly. For similar reasons, the average length of a non-commuting trip within Northern Virginia is anticipated to change little from 2016 conditions. Figure 8-2: Average Trip Length in Northern Virginia 2-14
57 CHAPTER 9: TRAVEL CONDITIONS The TransAction analysis includes a detailed assessment of travel conditions along major travel corridors within Northern Virginia, as shown in Appendix F. Needs for both the existing and future transportation systems in the year 2040 are identified by assessing the impacts of travel congestion and transit crowding along regional travel corridors. EXISTING CONDITIONS Travel Congestion along Regional Corridors Currently, over 8.7 million motorized trips are made daily throughout Northern Virginia. This includes over 7.8 million trips by automobile and 870,000 trips by transit. Altogether, transportation facilities within the region accommodate nearly 105 million person miles of travel on a daily basis. The region s interstate highways--i-66, I-95, I-395, and I-495 are heavily utilized. Figure 9-1 shows daily traffic volumes along major roadways across Northern Virginia. Analyses of commute trip patterns for selected links on I-95 and I-66 approaching the Capital Beltway are shown in Figure 9-2 and Figure 9-3, respectively: Northbound travelers on I-95 approaching the Capital Beltway mostly originate in Fairfax County and to a lesser extent, Prince William County, but there is also a significant amount of traffic originating from Stafford County and points south. Travelers using I-95 to commute are mostly heading to locations in Arlington, Alexandria, and DC, although some travelers continue across the American Legion or Woodrow Wilson Bridge into Maryland. Most of the eastbound traffic on I-66 approaching the Beltway originates in Fairfax and Prince William counties. Most these trips are bound for DC. While Maryland is a major generator and attractor of trips using I-66 outside the Beltway, a much smaller number of trips travel to/from points west in Virginia and West Virginia. Each weekday, Northern Virginians collectively experience over one million person-hours of delay. Person-hours of Delay quantifies the excess daily travel time, relative to trips experiencing no traffic delays, added to auto and transit trips because of congested conditions. This measure, illustrated in Figure 9-4, highlights the travel corridors within Northern Virginia where congestion is most detrimental to travel conditions, both in terms of severity and the volume of vehicles impacted. Currently, Northern Virginia experiences severe congestion resulting in significant person-hours of delay on many of the region s travel corridors, for example: I-95 south of Dumfries Road (Route 234) towards Fredericksburg; I-95 approaching the Occoquan River from Prince William County; I-395 within the Capital Beltway; I-495 between the American Legion Bridge and Woodrow Wilson Bridge; I-66 between the City of Fairfax and I-495 and locations near Falls Church; 2-15
58 Route 28 along the Dulles corridor and approaching I-66 near Centreville; Route 267 between Town of Herndon and Tysons; Route 50 both inside and outside the Capital Beltway; Route 7 in eastern Loudoun County and at key junctions within the Capital Beltway; Activity centers including: Tysons, City of Alexandria, Arlington County, City of Fairfax, City of Falls Church, Seven Corners, Sterling, Fort Belvoir; Reston Parkway and Dulles Greenway Toll Plaza. Transit Ridership In 2016, just over one million transit boardings occurred each weekday within Northern Virginia. Transit accounts for approximately ten percent of all vehicular travel within the region. Figure 9-5 shows average weekday ridership on transit corridors within Northern Virginia. Transit corridors with the highest daily ridership include: Metrorail Orange/Silver corridor experiences ridership >50,000 east of Ballston; Metrorail Blue/Yellow corridor experiences ridership >30,000 approaching Pentagon; VRE Manassas and Fredericksburg Lines; I-395 approaching Pentagon and Columbia Pike are the bus corridors with the highest ridership; Local Metrobus, ART, and DASH service inside the Capital Beltway; Local Metrobus and Fairfax Connector service on Richmond Highway. Transit Crowding Travelers in Northern Virginia are experiencing increasingly crowded conditions on transit vehicles during their daily commutes. Transit Crowding occurs when local buses are at 100% seating capacity, express buses are at 90% seating capacity, commuter rail train cars are at 90% seating capacity, and when Metrorail trains have at least 100 passengers per car. Figure 9-6 shows locations where transit crowding currently exists, with darker shades indicating corridors that experience the most significant recurring congestion on a single transit bus or Metro route or occurring on multiple transit routes. Significantly crowded transit corridors include: Metrorail Orange, Blue, and Silver Lines, and bus transit routes on the Rosslyn-Ballston corridor; Columbia Pike corridor; Pentagon-Crystal City-Potomac Yard corridor; US 1 corridor between Fort Belvoir and the Beltway; Connector service to the Wiehle-Reston East Metrorail station; Transit service along Route 123 and Gallows Road approaching Tysons. 2-1
59 Figure 9-1: 2016 Daily Traffic Volumes in Northern Virginia 2-2


60 A select link analysis conducted on regional highway facilities within Northern Virginia, including I-66 and I-95, indicates travel patterns for vehicles passing through a selected location in the highway network. Figures 9-2 and 9-3 show traffic volumes and facilities used on trips by vehicles approaching the Capital Beltway on I-95 and I-66, respectively. The thickness of the lines indicates the magnitude of trips using a particular facility that also traveled on the selected highway link just outside the Capital Beltway. Figure 9-2: Traffic Volumes and Trip Patterns for Vehicles Traveling on I-95 at Franconia- Springfield Parkway near Springfield Figure 9-3: Traffic Volumes and Trip Patterns for Vehicles Traveling on I-66 at Nutley Street near Vienna 2-3
61 Figure 9-4: 2016 Congestion in Northern Virginia 2-4
62 Figure 9-5: 2016 Weekday Daily Transit Ridership 2-5
63 Figure 9-6: 2016 Transit Crowding 2-6
64 FUTURE CONDITIONS Given the continued growth within Northern Virginia, traffic and crowding levels across the transportation network are projected to worsen considerably by No Build The 2040 No Build transportation system includes existing transportation facilities in Northern Virginia, as well as all transportation improvements that are fully committed to be constructed or implemented by Transportation improvements assumed as part of the 2040 No Build transportation system include: Metrorail Silver Line Phase 2 six stations west of the current terminus at Wiehle- Reston East to Ashburn in eastern Loudoun County. Transform 66 Inside the Beltway implementation of dynamically tolled express lanes on I-66 between I-495 and Route 29 in Rosslyn during peak commuting periods in peak directions, as well as an additional eastbound lane between the Dulles Connector Road and Fairfax Drive/Glebe Road (Exit 71). Transform 66 Outside the Beltway new dynamically tolled express lanes on I-66 between Haymarket and I-495, new and expanded park-and-ride lots, and improved bus service along I-66. I-395 Express Lanes Extension extension of I-395 Express Lanes from Edsall Road to Eads Street in Arlington, including three reversible dynamically tolled express lanes (currently two reversible high occupancy vehicle lanes) and implementation of active traffic management. Metrorail Infill Station at Potomac Yard station served by Metrorail Blue and Yellow Lines. VRE Infill Station at Potomac Shores station served by VRE Fredericksburg Line. Traffic Volumes Travel volumes are projected to increase significantly between 2016 and Figure 9-7 shows the projected volumes of motorized travel for the No Build 2040 condition; Figure 9-8 shows the differences between current conditions and No Build Growth in traffic volume is highest along several of the region s major travel corridors, including: Route 267 and Silver Line corridor between Tysons and Dulles Airport I-66 and I-95 corridors, especially within Prince William County; and Fairfax County Parkway between Route 50 and Route 267 Person Hours of Delay Congestion and corresponding vehicular delays are anticipated to become much more severe in Northern Virginia by 2040 in the absence of additional transportation improvements. Total person-hours of delay on roadways in Northern Virginia are forecast to triple from one million to three million hours daily between 2016 and the 2040 No Build condition. Figure 9-7 shows that the most severe delays would be anticipated on I-95, I-495, and I-66 outside I
65 Figure 9-10 indicates that delays would be worse across nearly all major travel corridors in Northern Virginia, as well as local facilities throughout the region. Much of the increase in delay is forecast for areas outside the Beltway, particularly in Loudoun County, the Town of Leesburg, the City of Manassas, the City of Manassas Park, and Prince William County. Projected reductions in delay, anticipated at some spot locations along I-66, I-395, and parallel arterial facilities, are partially attributable to transportation improvements associated with the Transform 66 and I-395 Express Lanes projects. Likewise, some reductions in delay near Sterling and the Route 28 corridor may occur as travelers choose to ride the Silver Line Phase 2 extension instead of driving. Transit Ridership Given the committed projects and expected demographic growth, transit ridership is expected to increase by more than 36% between 2016 and Table 9-1 shows the projected growth in transit ridership for the range of regional transit modes. Bus and Metrorail services will account for the majority of ridership growth, adding some 337,000 daily riders. Figure 9-11 shows the weekday daily transit ridership for the No Build 2040 condition. Figure 9-12 shows the change in weekday daily transit ridership between 2016 and the No Build 2040 condition. Table 9-1: 2016 and 2040 No Build Daily Transit Boardings by Mode Daily Boardings No Build Change between 2016 and 2040 No Build % Change between 2016 and 2040 No Build Metrorail 690, , ,400 23% VRE 18,700 26,800 8,100 43% Bus Rapid Transit (BRT) 4,100 14,600 10, % Local / Express Buses 288, , ,400 62% Total 1,002,300 1,358, ,400 36% Transit Crowding With sustained growth forecast for transit usage between 2016 and 2040, transit crowding is expected to become a more serious issue for the future No Build transportation system. Figure 9-13 shows transit crowding for the No Build 2040 condition, while Figure 9-14 shows the change in transit crowding between 2016 and the No Build 2040 condition. Throughout the region, the total number of transit route miles experiencing crowded conditions is anticipated to double. While the extension of the Silver Line to Ashburn Metrorail station relieves some crowding on buses traveling to Wiehle-Reston East Metrorail station, overall, crowding on transit vehicles is anticipated to get worse throughout Northern Virginia. Crowded transit conditions are forecast to be most prevalent within the Capital Beltway, but crowding is 2-8
66 anticipated to worsen on bus and rail corridors in portions of Fairfax County, Prince William County, and eastern Loudoun County. Major bus and rail corridors with crowded transit conditions in 2040 No Build include: Metrorail Orange, Silver, Blue, and Yellow Lines Route 1 and Route 7 bus services VRE Manassas and Fredericksburg Lines Tysons Manassas; and Southern Fairfax County 2-9

67 Figure 9-7: 2040 No Build Vehicular Volumes Figure 9-8: Change in Vehicular Volumes, 2016 to 2040 No Build 2-10
68 Figure 9-9: 2040 No Build Delay Figure 9-10: Change in Delay, 2016 to 2040 No Build 2-11

69 Figure 9-11: 2040 No Build Weekday Daily Transit Ridership Figure 9-12: Change in Weekday Daily Transit Ridership, 2016 to 2040 No Build 2-12
70 Figure 9-13: 2040 No Build Transit Crowding Figure 9-14: Change in Transit Crowding, 2016 to 2040 No Build 2-13
71 NEEDS ASSESSMENT To address current and future transportation needs, different subregions within Northern Virginia (depicted in Figure 9-16) require distinct combinations of transportation infrastructure investments. Combining extensive public input with detailed technical analysis, general areas of need emerge for each subregion, outlined in Table 9-2. Figure 9-15: Needs Assessment by Subregion 2-14
72 Table 9-2: Transportation Needs by Subregion Needs Subregion A: Inside the Beltway Improve transit core capacity and frequency to improve transit service and reduce crowding on bus and rail Improve multi-modal connections between regional activity centers Address severe, recurring congestion on I-66 and I-395, and along major arterial links Provide improvements to the bicycle and pedestrian environment throughout the area Subregion B: Northern Fairfax County Improve the street grid, transit service, and pedestrian environment in Tysons and Reston Address recurring congestion resulting from additional growth in Tysons and along the Reston-Herndon corridor Provide multi-modal options to support travel patterns on I-495, Route 7, Route 267, and Route 123 Subregion C: Central/Western Fairfax County, City of Fairfax Facilitate local connections and movement of through travelers on I-66 and major arterial roadways, including Route 29, Route 50 and Route 236 Improve pedestrian and bicycle environment within City of Fairfax and Town of Vienna Increase access to transit and transit service to support radial and cross-county travel patterns Subregion D: Southern Fairfax County Relieve severe, recurring congestion on I-95/Route 1 corridor during weekday commute and weekend periods Support forecasted growth near Springfield and along Route 1 corridor Improve access to Fort Belvoir Improve access to transit and improve local transit circulation in high growth areas along Route 1 corridor Subregion E: Western Loudoun County Preserve rural character of transportation facilities, but address additional congestion due to forecasted growth in the area Improve connections between Northern Virginia, Maryland and West Virginia to relieve congestion Subregion F: Eastern Loudoun County, Western Fairfax County Construct transportation network to anticipate future growth in area and facilitate movements on Route 50 and Route 7 corridors Address recurring congestion and provide transit service along Route 28 to anticipate growth in Dulles corridor Provide multi-modal access improvements to Metrorail Silver Line Phase 2 stations and Dulles International Airport Subregion G: Western Prince William County, City of Manassas, City of Manassas Park, Western Fairfax County Relieve severe congestion on I-66 corridor and improve access to transit along the corridor Facilitate growth in activity centers near Innovation District, Gainesville, and Manassas Improve connections to support major travel patterns to Loudoun and Fairfax Counties Subregion H: Eastern Prince William County Relieve severe, recurring congestion on I-95/Route 1 corridor entering the NVTA region from points south and at bottleneck near the Occoquan River Improve travel connections between cross-county and radial travel patterns, particularly near Prince William Parkway and Dumfries Road Support forecasted growth in Potomac Town Center and Potomac Shores and provide additional transit access and service, including new and additional park-and-ride capacity along corridor 2-15
73
74
75 KEY FINDINGS AND RECOMMENDATIONS Part 3 presents the results and findings of the analyses that have been conducted as part of TransAction. The three chapters included in this part are: Chapter 10: Northern Virginia Transportation System Chapter 11: Findings and Evaluation Chapter 12: Managing Uncertainty and Risk 3-1
76 CHAPTER 10: NORTHERN VIRGINIA TRANSPORTATION SYSTEM TransAction is the multimodal transportation master plan for Northern Virginia. It is a long range plan addressing regional transportation needs through The Plan focuses on eleven major travel corridors in Northern Virginia, and identifies over 350 candidate regional projects for future transportation investments to improve travel throughout the region. TransAction is not bound to any budget, and proposes more projects than can realistically be funded. In addition, while TransAction is focused on Northern Virginia, it is also a geographically unconstrained plan. It includes extra-territorial projects, or those beyond Northern Virginia, that are potentially beneficial to the mobility of Northern Virginians. The NVTA is generally unable to fund these projects, but they are nonetheless considered in order to ensure a more robust planning process. The results of TransAction are used to inform the NVTA s Six Year Program for capital funding, guiding decisions about which transportation improvements the NVTA should prioritize for investment. This Plan incorporates a comprehensive review of regional transportation needs. The results of the Needs Assessment described in Chapter 9 provide a basis for identifying candidate transportation projects that address these needs. 3-2
77 2040 NO BUILD TransAction is consistent with the MWCOG Transportation Planning Board (TPB) Constrained Long Range Plan (CLRP, 2016). Fully funded CLRP projects are assumed to be part of the baseline condition, 2040 No Build, as these projects do not require additional NVTA regional funds. Table 10-1 lists selected major projects included as part of the 2040 No Build conditions. Table 10-1: Selected Transportation Improvements in No Build 2040 I-395 Express Lanes Improvements I-95 Express Lanes Southern Extension Metrorail Potomac Yard Infill Station Metrorail Silver Line Phase II Transform 66 Inside the Beltway Transform 66 Outside the Beltway VRE Potomac Shores Infill Station DEVELOPMENT OF THE TRANSACTION PLAN Following the Needs Assessment, the NVTA compiled a comprehensive list of partially funded or unfunded regional transportation improvements included in: The previous TransAction 2040 Plan (2012); TPB s CLRP (2016); Local jurisdictional Comprehensive and Transportation Master Plans; Local Transit Development Plans; and Transportation Demand Management (TDM) Plans. The NVTA conducted several rounds of technical analysis in coordination with technical staff from regional jurisdictions and transportation agencies to identify existing or new projects that would address regional transportation needs. In coordination with the Needs Assessment, the NVTA recommended additional candidate projects for inclusion in the Plan to address identified needs that were not specifically or adequately addressed by improvements identified in existing transportation plans. The TransAction Plan includes 352 regionally-significant transportation improvement projects within Northern Virginia. Transportation improvements included in the Plan comprise a variety of multi-modal elements including roadway, transit, bicycle and pedestrian, intelligent transportation system (ITS), Integrated Corridor Management (ICM), and transportation demand management (TDM) improvements. The project totals shown in Figure 10-1 recognize the fact that some projects fall into more than one modal category. The circles in the graphic are not specific to the number or scale of projects. 3-3

78 The projects vary in scope from small scale intersection and sidewalk improvements at specific locations to mega-projects involving the expansion of freeway facilities and extension of heavy rail transit lines. Readiness of the project for implementation ranges from shovel ready to long-range planning studies with significant lead times. Figure 10-2 shows the locations of all transportation improvements included in this Plan. All projects included focus on addressing specific regional transportation needs such as reducing congestion and improving the efficiency of transportation facilities along regional travel corridors. Figure 10-1: Modal Elements in the TransAction Plan (representation is not precise) 3-4
79 TransAction Technical Report Figure 10-2: Projects in TransAction Plan 3-5
80 ROADWAY ELEMENTS Figure 10-3 illustrates the roadway elements of the TransAction Plan. These include the construction of new facilities, capacity improvements, and upgrading of existing facilities. The following are some of the roadway improvements included in the Plan: Capacity improvements on roadway facilities throughout the region, but mostly outside the Beltway; Build-out of street grids in Tysons and Reston; Expansion of express lanes on Capital Beltway across both bridges into Maryland; HOV lanes on Route 28, Fairfax County Parkway, Franconia-Springfield Parkway; Limited access freeway segments on US 50 and Route 7 in Loudoun County; Complete streets and intersection improvements within activity centers; and Potomac River crossings into Maryland at Route 28 (connecting to Montgomery County) and near Route 234 (connecting to Prince George s County). 3-6

81 Figure 10-3: Roadway Elements of the TransAction Plan 3-7
82 TRANSIT ELEMENTS Figure 10-4 illustrates the transit elements of the TransAction Plan. These include Metrorail extensions, new Light Rail Transit (LRT) and Bus Rapid Transit (BRT) lines, improvements to existing bus and rail services, and access improvements. Selected transit elements in the Plan include: Express buses on major regional travel corridors; Expansion of local bus service to feed into Metrorail, VRE and activity centers; Intermodal transit centers and transit maintenance facilities needed to implement service improvements; Additional Park-and-Ride facilities along the I-66 and I-95 corridors, particularly in Prince William County; Metrorail core capacity improvements including the 2 nd Potomac tunnel and eight car trains; Orange and Blue line Metrorail extensions to Centreville and Potomac Mills; Increased peak VRE service, reverse peak service, third track and Long Bridge widening; BRT network including Alexandria s West End Transitway, Route 7, Route 1, Route 28, US 29, Duke Street/Route 236, Gallows Rd, US 50 inside the Beltway, Columbia Pike, and Legion Bridge to Maryland; and LRT across the Woodrow Wilson Bridge to Maryland. 3-8
83 Figure 10-4: Transit Elements of TransAction Plan 3-9
84 NON-MOTORIZED ELEMENTS Figure 10-5 displays an array of bicycle and pedestrian projects were included in the TransAction Plan, identified to address location-specific issues or to augment non-motorized connectivity at a regional level. Some of the elements included are: Multimodal transit station access; Dedicated bicycle lanes; Regional trail connectivity and expansion; Bikesharing facilities such as bicycle parking, lockers, and/or shelters; and Improvements in bicycle and pedestrian facilities, access, and safety in activity centers. 3-10
85 Figure 10-5: Bicycle and Pedestrian Elements of the TransAction Plan 3-11
86 ITS/ICM ELEMENTS Figure 10-6 illustrates the Intelligent Transportation Systems (ITS) and Integrated Corridor Management (ICM) elements of the TransAction Plan. ITS utilizes technologies to process and communicate traffic information, in order to optimize operations, provide information to travelers in real-time, and improve the safety, efficiency, and service levels on roadway facilities. ICM optimizes use of available infrastructure by directing travelers to underutilized capacity in a transportation corridor. It uses ITS technologies and transportation demand management (TDM) services to address congestion. Managing demand and providing traveler decision support are considered cost-effective methods for improving operations on existing roadway facilities. The following ITS and ICM improvements are included as part of the TransAction Plan: Active traffic management on freeway facilities including dynamic ramp metering, reversible lanes, and hard shoulder running lanes; Intelligent signal monitoring/control technology on parallel arterial facilities; Multimodal traveler information and parking management; Decision support systems for corridor management; and Infrastructure improvements to support connected and autonomous vehicle technologies. 3-12
87 Figure 10-6: ITS/ICM Elements of the TransAction Plan 3-13
88 TDM ELEMENTS Figure 10-7 illustrates the TDM elements of the TransAction Plan. TDM is a set of services designed to provide commuters with alternative options to driving alone by providing information, programs, and incentives to encourage shifts in traveler mode, route, time of travel, and need to travel. Within Northern Virginia, TDM services are provided through a partnership between the Department of Rail and Public Transportation (DRPT), Virginia Department of Transportation (VDOT), Commuter Connections, local jurisdictional programs like the Arlington County Commuter Services (ACCS), and Transportation Management Associations (TMAs), such as the Dulles Area Transportation Association (DATA). The NVTA recognizes that implementation of TDM strategies within Northern Virginia can help address the stated goals of TransAction by reducing the number of daily commute trips in the region and shifting travel away from single-occupancy vehicles. TransAction specifies the introduction or expansion of TDM policies and programs within 12 focus areas throughout Northern Virginia, as shown in Figure These areas are forecast to have high concentrations of employment and population in 2040, and are locations where TDM strategies can be most effectively marketed to commuters. 3-14
89 Figure 10-7: TDM Focus Areas of the TransAction Plan 3-15
90 CHAPTER 11: FINDINGS AND EVALUATION The regional benefits of the TransAction Plan are quantified by comparing the 2040 No Build condition with the Plan. The 2040 No Build includes the existing 2016 transportation system as well as fully-funded projects that are currently under construction or planned for completion by TRANSACTION CORRIDORS AND SEGMENTS Public feedback and thorough analysis of travel needs indicated that the most effective strategy to reduce congestion in Northern Virginia, and to attain the other goals outlined in TransAction, is to focus on improving travel along several major travel corridors within the region. These travel corridors contain the roadways and transit lines that carry the heaviest volumes of travelers and experience the most severe congestion and delay within Northern Virginia. Providing more efficient travel through these corridors is necessary to relieve congestion throughout the whole region. Because these travel corridors are regional in extent and influence, they were subdivided into smaller corridor segments that better reflect the travel patterns and transportation infrastructure present along a particular portion of each regional corridor. Figure 11-1 shows the locations of the 11 regional travel corridors and 28 corridor segments used to quantify and evaluate the impact of the TransAction Plan within Northern Virginia. The analysis develops solutions and reports results at the corridor segment level to focus on the combined impact of individual projects. 3-16

91 Figure 11-1: TransAction Corridors and Segments 3-17