The Global Supply Chain and Greenhouse Gases: a North American Perspective
|
|
|
- Cora Hopkins
- 5 years ago
- Views:
Transcription
1 The Global Supply Chain and Greenhouse Gases: a North American Perspective Annie Protopapas, Ph.D. Multimodal Freight Transportation Texas Transportation Institute
2 Background Foundation Paper Summary Greening North American Transportation Corridors
 emissions - state-of-the-practice in measurement/estimation of GHGs - available")
3 Background TTI conducted two projects for the tri-national Commission for Environmental Cooperation (CEC) Foundation Paper Part of larger CEC report under Article 13 Towards Sustainable Freight Transportation in North America - freight transportation system in North America as it relates to greenhouse gas (GHG) emissions - state-of-the-practice in measurement/estimation of GHGs - available GHG mitigation strategies - opportunities for GHG mitigation on a NA front Greening North American Transportation Corridors - developed methodology to measure corridor level emissions - issues and opportunities to improve air quality - case study determined the air quality impact of truck and rail freight movement along the Mexico City to Montreal corridor
4 Foundation Paper Overview Transportation is one of the major contributors to the release of GHGs in the atmosphere, producing more than 1/3 of the total GHGs released in North America Canada is #1 US trading partner and Mexico is #3 US trading partner Truck is the dominant mode for goods movement between the three countries US Land Trade with Canada and Mexico (billion US$) Rail 300 Truck


5 Foundation Paper Cross-Border Trade Approximately 50% of the total truck and rail traffic by value in North America was handled by 3 land ports of entry At the US-Canadian border, more than 75% of the surface trade was handled by 5 land ports of entry At the US-Mexican border, 75% of the total trade was handled by 4 ports of entry 2008 US-Canada and US-Mexico Major Ports of Entry
6 Foundation Paper Correlation between Freight Transportation and GHGs The primary fuel of freight truck and rail is diesel a petroleum product i.e. a fossil fuel GHGs are byproducts of combustion of fossil fuels e.g. oil and coal Direct positive relationship between fossil fuel use and GHG production the more the fuel burned the more the GHGs produced GHGs emitted by freight rail and truck consist of 96% carbon dioxide (CO 2 ) by volume. The remaining GHGs are methane (CH 4 ), nitrous oxide (N 2 O), and fluorinated gases (HFCs, PFCs, SF 6 )

7 Foundation Paper Freight Transportation GHGs in NA **On-road includes light duty gasoline and diesel trucks and vehicles, motorcycles, and heavy duty gasoline and diesel vehicles ***Data for all three countries in the same year were not available ****Table only includes vehicle classes for which data in all three countries were available
8 Foundation Paper Freight Transportation GHGs in the USA US transportation GHG emissions are 12x Canada s and 16x Mexico s Trends in the U.S. and Canada are similar: GHGs from passenger cars and trucks have been decreasing GHGs from freight trucks have been increasing in recent years 2,500 2,000 Non-Transportation Mobile Sources Lubricants million Mt CO2e 1,500 1, Boats/Ships, Rail, and Pipelines Aircraft Medium- and Heavy-Duty Trucks and Buses Light-Duty Trucks Passenger Cars/Motorcycles

9 Foundation Paper GHG Emission Reduction Challenges & Strategies Reducing GHGs from freight modes may be more challenging than reducing GHGs from passenger modes or stationary sources Little or no discretionary freight movement Implications for the economy and global competitiveness Slower freight vehicle fleet turnover so slower rate of introduction of new technologies Due to economic competition, freight carriers already have significant incentive to minimize fuel costs and GHGs Freight VMT expected to grow faster than passenger VMT Source: AASHTO


10 Greening NA Transportation Corridors Case Study: Mexico City to Montreal Corridor Study Corridor Distance by Country and Mode (miles) Mode Canada U.S. Mexico Total Truck 531 1, ,847 Rail 575 1, ,194
11 Greening NA Transportation Corridors Data Requirements for Corridor Level Air Quality Analysis of Freight Movement Truck Freight Activity - Annual truck VMT on each link (from annual truck volume) - Annual truck volumes at ports of entry - Fleet characteristics e.g. age distribution, VMT share - Speed profile for trucks crossing US ports of entry Emission Rates - Aggregated exhaust emission rates based on vehicle registration data and MOBILE6.2 - PEMS measurements Rail Freight Activity - Annual ton-mile commodity flow between each major origindestination pair Emission Rates - Exhaust emission rates based on national average rates
12 Analysis Process for Emissions along the Corridor Highway Link and Truck Data Rail Freight Movement Data National Rail Network Select and Export Study Corridor Data Sort and Export Data for Major Cities Select and Export the Study Rail Lines Emission Rates by Type Emission Rates by Type Calculate Emissions (Truck Flow Emission Rates) Calculate Emissions (Commodity Flow Emission Rates) Annual Truck Emission Dataset Annual Rail Emission Dataset FAF Network GIS Base Map Rail Network GIS Base Map Join and Classify Emissions Data Truck Join and Classify GIS Data Rail Final Maps for Annual Truck Emissions Final Maps for Annual Rail Emissions

13 Greening NA Transportation Corridors

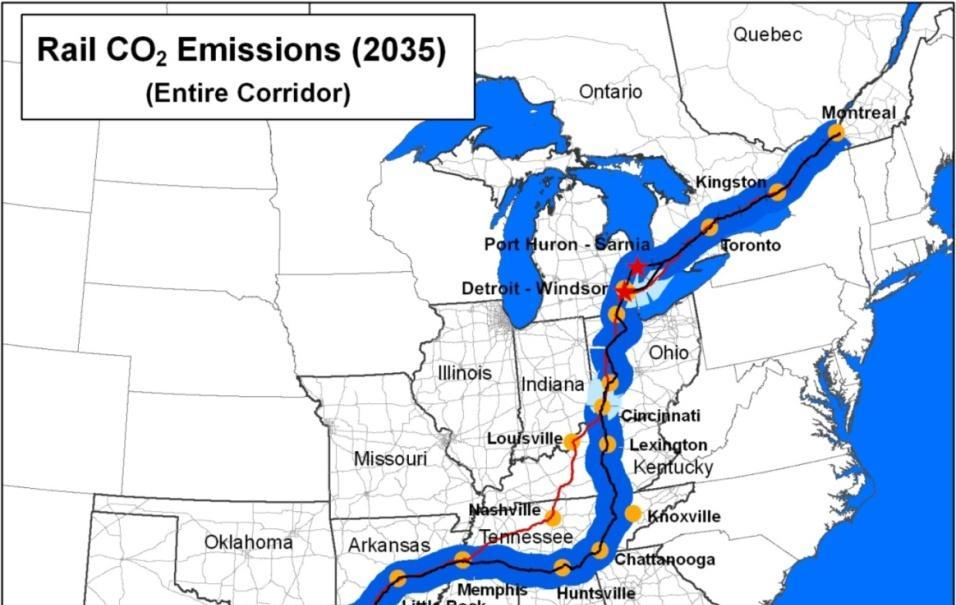
14 Greening NA Transportation Corridors
15 Greening NA Transportation Corridors Total Annual Freight Emissions on the Mexico City to Montreal Corridor Annual Emissions Year CO 2 (kt) CO (metric ton) NOx (metric ton) THC (metric ton) PM (metric ton) Truck Rail ,508 10,746 76,733 2, ,218 4,209 17,015 3, , ,
16 Greening NA Transportation Corridors Data Requirements and Data Sources Corridor data are highly uncertain, or even non-existent Freight Data Sources FHWA/BTS databases most reliable sources Canadian and Mexican data difficult to obtain e.g. Transport Canada data & Canadian data sharing rules Data collection efforts & level of granularity vary in each country
17 Greening NA Transportation Corridors Data Requirements and Data Sources (cont.) Trucking Activity FAF truck volume data do not include vehicle weight or load factor EPA Smartway fleet performance data not publicly available Uncertainty in emissions estimates: emissions rates of empty trucks might be underestimated Network and Routing Data GIS network data for highway and rail are publicly available Truck volume data: publicly available hence higher reliability Rail routing & movement data: proprietary hence greater uncertainty
18 Greening NA Transportation Corridors Data Requirements and Data Sources (cont.) Truck Emissions Rates MOBILE6.2 truck emissions rates are aggregate distancebased rates for different average speeds Suitable for medium- and large-scale analyses; not sensitive to changes in driving conditions at constant average speeds CO 2 and PM rates in M6.2 are not sensitive to speed; not very suitable for link level analyses EPA s newest model MOVES is capable of fine-scale analyses Requires disaggregate activity data not currently available; no standard collection procedures developed yet
19 Greening NA Transportation Corridors Data Requirements and Data Sources (cont.) Freight Rail Movement and Emissions High levels of uncertainty in freight rail movement data Available emissions estimation methods are aggregate procedures based on national average values that consider the total weight of hauled cargo to obtain fuel consumption and emissions
20 Overall Conclusions & Opportunities Short Term More rigorous public investment - Catalyst to lower tech cost; large & small operators Freight-specific GHG regulation - Fuel efficiency standards for heavy duty trucks Cooperation with private sector - Tri-partisan relationship with tech R&D and operators Technology & Expertise Transfer in NA - Development & standardization in data & methods - Development of NA level GHG performance measures Medium-Long Term Feasible alternative energy sources for freight modes Carbon emissions pricing (cap and trade, carbon pricing...)
21 For further information please contact: CEC Foundation Paper Annie Protopapas Juan Villa Greening NA Transportation Corridors Josias Zietsman