Project Prioritization for Urban and Rural Projects TEAM CONFERENCE March 7, 2018
|
|
|
- Robert Merritt
- 5 years ago
- Views:
Transcription

1 Project Prioritization for Urban and Rural Projects 2018 TEAM CONFERENCE March 7, 2018


2 Challenge Limited funding for transportation improvements requires strategic selection of projects to ensure resource allocation is optimized.
3

4 thehill.com


5 Solution Develop project prioritization and implementation planning criteria to inform transportation investment decision-makers.


6 Project Prioritization Approach Identify Goals & Performance Measures Conduct Data Collection Develop Evaluation & Prioritization Criteria Conduct Scenario Planning & Evaluation Prepare Recommendations & Implementation Plan Strategies Quantitative Measures Qualitative Measures Benefit-Cost or Monetization BIG Data & Travel Time Reliability Stakeholder Input


7 Examples Rural and urban case studies demonstrating project prioritization.

8 Recommend and prioritize locations for passing lanes along TH 15 based on: TH 15 Passing Lane Assessment Hutchinson, Minnesota Need for improved safety and mobility Minimal ROW needs Low risk for drainage/wetland and environmental impacts Low risk for other project delivery issues
 TH 15 Passing Lane")
9 Data Collection Traffic Characteristics: 2017 daily traffic = 4,600 AADT 2045 daily traffic projection = 7,000 Existing heavy trucks = 9% Existing No Passing Zones: Northbound = 25% Southbound = 21% Passing Lanes Considered: 3- lane passing lane heading south from Kimball 3- lane passing lane heading north from Kingston 4-lane passing lane (north of TH 24) TH 15 Passing Lane Assessment

10 Prioritization Approach 1. Ranked based on mobility, safety, and economic criteria (i.e. Benefit- Cost ). 2. Considered regional traffic and spacing of passing lanes. 3. Potential risks identified. TH 15 Passing Lane Assessment
 3 Priority #4 Priority #3 Segment 5 4- lane passing lane mid- segment Priority #4 Segment 4 3- lane passing lane heading north from Dassel 4 4 Priority #3 TH 15 Passing")
11 Segment Prioritization Priority #1 Priority #1 Segments 1/ 2 3- lane passing lane heading north from Kimball 3-lane passing lane heading south from I-94 Priority #2 4 4 Priority #2 Segment 3 4-lane passing lane (north of TH 24) 3 Priority #4 Priority #3 Segment 5 4- lane passing lane mid- segment Priority #4 Segment 4 3- lane passing lane heading north from Dassel 4 4 Priority #3 TH 15 Passing Lane Assessment

12 Prioritize locations for widening shoulders of roadway segments that are not currently built to MnDOT Standards. D4 Shoulder Widening Prioritization Detroit Lakes, Minnesota Includes all two-lane twoway State roadways within District 4 with shoulder widths less than six feet.
13 Evaluation Criteria Multimodal Syst em Preservation Environmental Impacts Mobility Constructability Safety Evaluation Functionality D4 Shoulder Widening Prioritization


14 Evaluation Criteria Safety Crash Rates Existing crash rates and critical crash rates were calculated. Predicted future year crash rates were calculated. Segments with largest reduction in future year predicted crash rates received the highest score. District Safety Plan Identified high priority segments from MnDOT s District 4 Safety Plan. High Priority Segments with the largest number of risk factors scored the highest D4 Shoulder Widening Prioritization


15 Evaluation Criteria Multimodal Accommodations Bicycle Corridors MnDOT District Bicycle Plan Sustainability Analysis routes were identified. Segments were rated in the plan as good, fair, or poor based on user comfort. Unique Travel Corridors Includes unique travel corridors (i.e. Amish users, corridors within American Indian Reservations, high pedestrian corridors, etc.) that would benefit from wider paved shoulders. Heavy Commercial Route Heavy commercial percentages were calculated. Shoulders provide an area for emergency parking and improve lateral separation for vehicles. Agricultural or Recreational Route District 4 staff identified corridors with heavy agricultural or recreational use. D4 Shoulder Widening Prioritization

16 Evaluation Criteria System Preservation Maintenance Issues District 4 staff identified maintenance issues: Steep slopes Narrow shoulders Loose shoulder material Shoulders prone to erosion Segments with identified maintenance issues received the highest score. D4 Shoulder Widening Prioritization
17 Prioritization Scenario Evaluation 1: Project Need 2: Project Delivery 30% 30% 30% 30% 15% 10% 5% 5% 5% 5% 15% 5% 10% 5% 3: Benefit-Cost Analysis D4 Shoulder Widening Prioritization

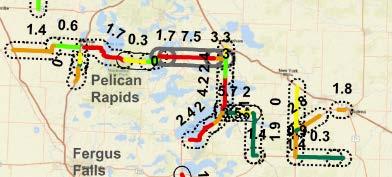
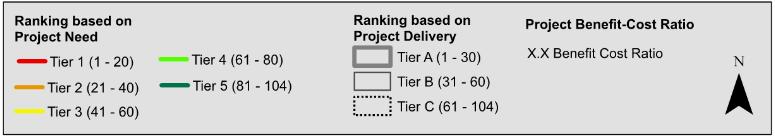
18 D4 Shoulder Widening Prioritization


19 Develop a vision for an east-west arterial roadway design. Develop implementation plan to address existing issues and accommodate future development needs. Bailey Road Corridor Management Wash. Co., Minnesota

20 Bailey Road Corridor Bailey Road Corridor Management

21 Corridor Priorities NEIGHBORHOOD GROUP Bailey Road Corridor Management
22 Prioritization Process Objectives Evaluation Criteria Measures Prioritization Safety Crash History Predicted Crashes based on Highway Safety Manual Crash Rate or Correctable Crashes Number of Crashes or Crash Modification Factor 20% Mobility Future Traffic Growth 2025 No Build Corridor Operations LOS Improvement to Side- Street Delay Growth Percentage from existing to 2040 AADT Reduction in Number of Intersections with Side- Street LOS E/ F in AM or PM peak hours 20% Capacity Reserve Capacity in 2025 No Build Volume/ Capacity 20% Pedestrian Network Connectivity Reduction in Number of Gaps in Pedestrian Network Multimodal Accommodations Additional Pedestrian Crossings Improved Pedestrian Crossings Number of Additional Crossings of Bailey Rd Delay of Pedestrians at Crossings Safety of Pedestrian Crossings 20% Development Timing of Development Intensity of Development Year of Construction Number of Units 20% Bailey Road Corridor Management

23 Corridor Vision & Implementation Plan Priority 1 Priority 2 Ability to Leverage Local Funds Bailey Road Corridor Management

24 Prioritize locations for the potential installation of ramp metering. I-64 Ramp Metering Feasibility Study St. Louis, Missouri Strategically select locations where benefit is realized without major impacts.
25 Why Ramp Metering? 1. Capacity improvement opportunities limited to non-existent in certain sections of I History has shown increasing capacity not always the best answer for congestion problems. 3. Ramp Metering systems have a long track record of being a cost-effective success nationwide. I-64 Ramp Metering Feasibility Study
26 Prioritization Criteria 1. The severity of congestion and or crash hazard caused by the bottlenecks or interchange merging s. The key element here is this should match driver s perception that a significant problem exists. 2. The degree that a particular metering strategy can resolve the issue from a high-level perspective. 3. The effect, if any, on downstream corridor segments. 4. The ability to coordinate the improvement recommended with existing infrastructure and future maintenance/ construction activities. 5. The ability of parallel routes to accommodate any potential traffic diversions. 6. The recommendation is consistent with MoDOT s policies, goals and objectives. I-64 Ramp Metering Feasibility Study
27 Screening Process 1. The severity of congestion and or crash hazard caused by the bottlenecks or interchange merging s. The key element here is this should match driver s perception that a significant problem exists. 2. The degree that a particular metering strategy can resolve the issue from a high-level perspective. 3. The effect, if any, on downstream corridor segments. 4. The ability to coordinate the improvement recommended with existing infrastructure and future maintenance/ construction activities. 5. The ability of parallel routes to accommodate any potential traffic diversions. 6. The recommendation is consistent with MoDOT s policies, goals and objectives. Corridor Speeds Densit y/ LOS Crashes I-64 Ramp Metering Feasibility Study
 Minimal")
28 Benefits both AM Peak and PM Peak Re-evaluate conditions post I-64 widening west of I-270 Likely to require modifications to outer roads (impacts to ramp length, location, and access) Benefits both AM Peak and PM Peak Constrained area that could be impacted by capacity improvement projects elsewhere along the corridor Expected to improve downstream conditions (EB and WB I-64) Minimal improvements to existing ramps Consider implementation post I-64 widening west of I-270 Directional peak period benefit Re-evaluate conditions post I-64 widening west of I-270 Minimal improvements to existing ramps Phase IA Phase IV Phase IB Phase IA Evaluate during future downtown freeway reconstruction projects

29 Strategically develop lower- cost/ highbenefit solutions targeting high-priority problem locations. Congestion Management Safety Plan 4 Twin Cities, Minnesota

30 Performance Measures Recurring Congestion Loop detector and INRIX speed data Data obtained from MnDOT 2015 Congestion Report Segments mapped to MnDOT highway line layer Analyze data in coordination with other measures Congestion Management Safety Plan 4

31 Performance Measures Travel Time Reliability One year of travel time data (full year 2015) Includes all conditions Weather Crashes Road Work Standard deviation of travel time distribution Congestion Management Safety Plan 4

32 Performance Measures Crash Density 3 years of crash records (Jul 2012-Jun 2015) Individual crashes assigned by highway milepost and direction Densities show high crash concentrations Congestion Management Safety Plan 4
33 Monetization of Performance Measures Congestion Cost Vehicle speeds Traffic volume Influence distance Congestion duration Value of time Reliability Cost Travel time standard deviation Traffic volume Influence distance Value of reliability Crash Cost Number of crashes by severity Crash cost by severity Congestion Management Safety Plan 4
34 Prioritization Criteria Methodology: Project Return Period Cost of Improvements Annual User Benefits Delay Reliability Safety Years until return on investment is realized Congestion Management Safety Plan 4
35 CMSP Opportunities 20 Return period years until return in investment is realized (user cost savings equates to project cost). Recommended spot mobility locations: 50 locations with desirable return period Locations carried forward to Transportation Policy Plan Return Period (years) RP: >12 yrs 26 projects RP: 4-12 yrs 22 projects RP: <4 yrs 38 projects Project Number (ranked) Congestion Management Safety Plan 4


36 Key Takeaways Lessons learned.
37 What you should remember Prioritization of projects allows for efficient use of transportation investment dollars. Tailor approach/ methodology to scope of project/ need. Leverage existing data sources to the extent possible. Leverage planned and programmed projects to the extent possible. Understand local priorities. Reach out to ALL stakeholders (i.e. other agency departments, public, businesses). Include scenario planning and evaluation to build consensus. Use best practices and innovation with evaluation measures. Be open minded and flexible!
38 Thank You! Leif Garnass, PE (MN IA MO), PTOE Senior Associate