STORMWATER RETROFIT AND LID COMPETITIVE GRANT PROGRAM G
|
|
|
- Erik Miller
- 5 years ago
- Views:
Transcription

 798-2725 Fax")
1 STORMWATER RETROFIT AND LID COMPETITIVE GRANT PROGRAM G THE STATE OF WASHINGTON DEPARTMENT OF ECOLOGY AND PIERCE COUNTY SURFACE WATER MANAGEMENT CLARKS CREEK BASIN STORMWATER RETROFITS DESIGN REPORT, YEAR 2013 PROJECTS March 13, 2012 June 17, 2013 Pierce County Surface Water Management 2702 South 42 nd Street, Suite 201 Tacoma, WA Office (253) Fax (253)
2 Pierce County Surface Water Management 2702 South 42 nd Street, Suite 201 Tacoma, WA Office (253) Fax (253) Clarks Creek Basin Stormwater Retrofit Projects FY th Ave Court East Porous Pavement Retrofit - 59 th Ave E/ 86 th Street East Stormwater Pipe Outfall Retrofit Design Report Project Manager: Al Zehni P.E. Pierce County Surface Water Management Design Engineer: Brian Bennett Pierce County Surface Water Management Introduction The purpose of this project is to retrofit stormwater systems in the Clarks Creek Basin to treat polluted runoff and improve the water quality. The retrofits will consist of constructing stormwater treatment facilities that will remove sediment, metals, nutrients (including phosphorus and nitrogen), and other pollutants. The projects included in this design report are scheduled for construction during Basin The Clarks Creek Basin lies within Pierce County and drains approximately 10.7 square miles (6,828 acres) of north central Pierce County to the Puyallup River, of which 4.9 square miles (46 percent) exist within unincorporated Pierce County. The remaining 5.8 square miles (54 percent) lie in the City of Puyallup. The Clarks Creek Basin is divided into four sub-basins; Rody Creek; Diru Creek; Woodland Creek; and Clarks Creek (Clear/Clarks Creek Basin Plan, 2006). See Figure 1. Land Use Existing land use within the Clarks Creek Basin consists of both urban and rural zoning, including residential, commercial, and some agricultural uses. There is a mixture of grass pastures and lawns associated with rural/residential landscape. Existing development consist of high, moderate, and low-density residential areas of houses, with densities generally from six or more houses per acre to less than one house per acre. Small farms are scattered throughout the basin. Currently the basin consists of approximately 25% impervious area. Under future land-use conditions, the impervious area of the built-out basin is expected to be approximately 35% (Clear/Clarks Creek Basin Plan, 2006). Soils Soils within the Clarks Creek Basin consist of three main types: Alderwood-Everett, Kapowsin and Puyallup-Sultan. The Natural Resources Conservation Services (NRCS) classifies soils into four hydrological soil types (A, B, C and D) based on the soils runoff potential. Type A soils have a very high infiltration capacity and generate the least amount of runoff potential. Conversely, Type D soils have the lowest infiltration capacity and the highest runoff potential. Soils within the 1
3 basin consist of primarily Type C and Type D soils. Soils within the Western part of the basin consist of primarily Kapowsin soils, which are generally classified as Type D soils. Rainfall within the basin occurs primarily October through April, during which 78% of the precipitation occurs. The mean annual precipitation for the watershed is 40.7 inches per year. Typical storms for the region arrive from the west or southwest as large frontal storms and are generally low intensity and long duration. (Clear/Clarks Creek Basin Plan, 2006). Site Selection Methodology Site Selection Criteria: Treatment prior to discharge, Site location (within unincorporated Pierce County) Construction feasibility Cost and benefit. More information on site selection methodology can be obtained in the first design report of this grant titled Clarks Creek Basin Stormwater Retrofits Final Design Report This design report is to document the additional projects considered for construction during Preliminary Design Selected sites: Proposed Stormwater Treatment Sites: Intersection of 59 th Avenue East and 86 th Street East, Puyallup, WA (R2) 64 th Ave Court East (D3) These projects were selected based on above criteria previously outlined in the Site Selection Methodology section of this report. The first site will add one hydrodynamic separator filter vault along 86 th Street East to intercept and treat the roadway runoff to pre-treatment standards. Treated water will be discharged into the existing catch basin containing Rody Creek. Excessive flows will bypass the stormwater filter vault and discharge directly into Rody Creek using the existing stormwater system. The second site located along 64 th Ave Court East will involve removal of the existing roadway and replacement with porous asphalt pavement. This will reduce approximately 50% of the discharge from 64 th Ave E from entering Diru Creek. 2
4 Rody Creek Watershed 59 th Avenue East and 86 th Street East (R2) Site Characteristics 86 th Street East is located in unincorporated Pierce County at approximately th Street East. The land use of the drainage area is medium density residential. Currently runoff from approximately 1200 feet of 86th Street East is collected from two catch basins located in the roadway. Total basin runoff area is approximately 1.08 acres, generated from the streets and driveways, which accounts for approximately 1.08 acres. The edges of the roadway have raised pavement curb which limits the run-on from the adjacent pervious areas (residential parcels). Therefore we are not including the pervious areas in the calculations for two reasons. 1) The raised pavement curb effectively limits the run-on from the previous areas onto the roadway. This has been observed in the field during moderate intensity rainfall. 2) The natural slope of the land directs the water to run parallel to the roadway and eventually away. Therefore very little run-on is present. Runoff collected from the roadway and driveways is conveyed through a 12 pipe approximately 50 LF to Rody Creek located to the west of the project. No treatment of the stormwater runoff is provided. Soils The primary soil type in the area is Alderwood gravelly sandy loam and is nearly level to undulating, moderate to poorly drained soil. Proposed Design The proposed water quality treatment system is designed using the MGS Flood hydraulic modeling software. It is designed to meet the Washington State Department of Ecology (WSDOE) requirements to treat the 15-minute water quality flow rate. This site was chosen due to its proximity to Rody Creek and because it discharges untreated stormwater. Modeling using MGS Flood estimates the 15-minute water quality flow rate to be 0.17 cfs (see attached data). The proposed design uses a hydrodynamic separator to treat the 15-minute water quality flow rate. Flows in excess of the treatment flow rate will be bypassed internally within the vault and discharged into Rody Creek. Hydrodynamic separation was chosen because the depth of the pipe containing Rody Creek is shallow and doesn t have the necessary drop for a stormfilter vault to operate correctly. Only Washington Department of Ecology GULD approved systems meeting pre-treatment will be specified in the bid documents. Performance Any hydrodynamic separator used will meet WSDOE requirements for pre-treatment. Since any product used will be GULD approved, the performance claims have already been verified by WSDOE. Specific performance data on the proposed system is impossible to describe in this report due to the construction contract bidding process, Pierce County will not know the manufacture of the system until construction begins. 3
5 Maintenance Initially the hydrodynamic separator unit will be checked every 3 months or after significant rainfall events to assure adequate function and performance is met. The manufacture of the system will provide operating and maintenance guidelines. Maintenance requiring extraction of trapped sediment will be done as-needed until enough data is obtained to determine the proper interval. County maintenance crews will maintain the system. The maintenance interval will depend on sediment loads, but at this time no data exists documenting the sediment loads entering the current system. Maintenance is expected the will be done yearly. Cost The estimate construction cost of the project is expected to be approximately $100,000 - $120,000. Revision This project is eliminated because after further discussion with the manufacture of the hydrodynamic separator the performance of the system would not be acceptable during high flows. During high flows water flowing through the pipe which conveys Rody Creek would cause water the backwater into the filter vault. This is because the grade of the pipe from the creek to the filter vault is very flat. Additionally the increase in hydraulic grade line from the addition of the filter will create a backwater situation in the catch basins upstream, causing them to flood the roadway. Raising the roadway is not an option at this location. Additional field work will be conducted during 2013 to identify other locations suitable for stormwater retrofits. Construction of any additional sites would occur during A separate design report will be prepared for 2014 projects. 64 th Ave Court East (D3) Site Characteristics 64 th Avenue Court East is located approximately 5 miles west of Puyallup, Washington. It is located within the Diru Creek drainage basin which is a tributary of Clarks Creek. The existing roadway is a paved residential street with raised edge on the left and right shoulders. All drainage is collected in two catch basins and piped 500 feet to the east into Diru. Stormwater is not treated prior to entering Diru Creek. Soils The primary soil type in the area is Alderwood gravelly sandy loam and is nearly level to undulating, moderate to poorly drained soil. The design infiltration rate used is inches/hour. Soils listed in the Soil Survey of Pierce County Area published by the USDA NRCS, the expected infiltration rate is between 0.6 in/hr and 2.0 inch/hr, and depth to groundwater is 60 inches or greater. Using a safety factor of ½ the infiltration rate results in 0.6 in/hr x 0.5 = 0.3 in/hr. Because this is the first porous pavement project used for a roadway by the County it was decided to error on the cautious side and use in/hr for the Pierce 4
6 County BMP calculator. This will increase the subgrade reservoir thickness and reduce the likelihood of the project failing in the future. Proposed Design This site was chosen because of its proximity to Diru Creek and discharges of untreated stormwater. All stormwater improvements will be located in the right-of-way. The proposed design will remove approximately 1340 lf of pavement and replace it with porous asphalt. The existing impervious surfaces (roadway and driveways) total 1.42 acres, and replacement of the roadway with porous asphalt would reduce the impervious surface to 0.61 acres (driveways only). Replacement of the impervious surfaces with porous pavement reduces the impervious surfaces by 0.81 acres onsite. Because this project is a pilot project for Pierce County using porous asphalt the existing drainage system and raised asphalt edge will be left in place. This is to serve two purposes; 1) The raised edge will be left in place to avoid the expense and difficulty of reconstructing driveway approaches; 2) It will function as a redundant drainage system if infiltration through the porous asphalt decreases in the future. A new underdrain will be constructed and connected to the existing system. Initially the underdrain will be plugged, but can be utilized if excessive subsurface water retention in the reservoir section is observed. Contributing runoff from the existing driveways will be conveyed along the flowline of the raised edge and will be discharged to the existing system. Performance Significant reductions in flow will be achieved using porous pavement. Modeling results using MGS Flood predict a 50% reduction in discharge flows, compared to the existing site. Filtering of pollutants will occur in the reservoir section below using the existing ground if the cation exchange capacity is 5 milliequivalents/100 grams of dry soil; or a 6 layer of sand with be added on top of the subgrade if the soils are unsuitable. The depth of the reservoir section was sized using the Pierce County BMP Sizing Tool for Flow Control developed by Pierce County in conjunction with Herrera Environmental Consultants and the Washington Department of Ecology. Maintenance Initially the pavement will be checked every 3 months or after significant rainfall events to assure proper function is achieved. Semi-annual sweeping of the pavement will be performed to prevent clogging of the surface and maintain maximum performance. Yearly inspection and vacuuming of the catch basins will be performed if necessary. Cost The estimate construction cost of the project is expected to be approximately $425,000- $500,000. References Clear/Clarks Creek Basin Plan (2006). Clear/Clarks Creek Basin Plan Volume 1 Basin Plan & SEIS. Pierce County, WA 5


7 Diru Creek Canyon Creek CANYON RD E Canyon Creek 84TH ST E 52ND ST E PIONEER W Y E 7 2ND ST E Clarks Creek?u@ 167?u@ 161 STEWART AV E Woodland Creek Fife NORTH LEVEE RD E 76TH AV E S FRUITLAND Puyallup River W STEWART W PIONEER Puyallup Legend VALLEY AV NW N LEVEE RD Edgewood Cities in Pierce County N MERIDIAN S MERIDIAN?u@ 167 E PIONEER 48T H ST E Clarks Creek Drainage Areas Clarks Creek Diru creek Lower Clark Rody Creek 5TH ST NE B E Woodland Creek MILWAU KEE AV E VALLEY AV E?u@ 167 NSTO N DR E E MAIN E PIONEER 90TH ST E 96TH ST E Clarks Creek 23RD AV SE 104TH ST E FRUITLAND AV E 31ST AV SW 9TH ST SW Woodland Creek?u@ TH ST E 39TH AV SW 37TH AV SE 43RD AV SE 39TH AV SE ¹ Rody Creek 62ND AV E WOODLAND AV E 74TH AV E 78TH AV E 86TH AV E 128TH ST E 94TH AV E 118TH ST E?u@ TH AV E 111TH AV E 122ND ST E Clarks Creek Draiange Areas Miles Figure 1
8 HYDRAULIC MODELING DATA 6
9 MGS FLOOD PROJECT REPORT Program Version: MGSFlood 4.12 Program License Number: Run Date: 12/10/2012 8:33 AM Input File Name: 59th-86th.fld Project Name: D413-59th and 86th Analysis Title: Comments: hydraulic calc for 15-minute WQ flow rate PRECIPITATION INPUT DELETED Computational Time Step (Minutes): 15 Extended Precipitation Timeseries Selected Climatic Region Number: 3 Full Period of Record Available used for Routing Precipitation Station : Puget West 40 in_5min 10/01/ /01/2097 Evaporation Station : Puget West 40 in MAP Evaporation Scale Factor : HSPF Parameter Region Number: 1 HSPF Parameter Region Name : USGS Default ********** Default HSPF Parameters Used (Not Modified by User) *************** ********************** WATERSHED DEFINITION *********************** SCENARIO: PREDEVELOPED Number of Subbasins: Subbasin : Subbasin Area(Acres) Number of Subbasins: 1 Till Forest Till Pasture Till Grass Outwash Forest Outwash Pasture Outwash Grass Wetland Green Roof User Impervious Subbasin Total SCENARIO: POSTDEVELOPED
10 Subbasin : Subbasin Area(Acres) Till Forest Till Pasture Till Grass Outwash Forest Outwash Pasture Outwash Grass Wetland Green Roof User Impervious Subbasin Total ************************* LINK DATA ******************************* SCENARIO: PREDEVELOPED Number of Links: 0 ************************* LINK DATA ******************************* SCENARIO: POSTDEVELOPED Number of Links: Link Name: New Channel Lnk1 Link Type: Open Channel Downstream Link: None Left Overbank Upper Sideslope (z) : Upper Width (ft) : Middle Sideslope (z) : Middle Width (ft) : Mannings n : Main Channel Lower Sideslope Left (z) : Lower Width Left (ft) : Lower Sideslope Right (z) : Lower Width Right (ft) : Mannings n : Base Width (ft) : 10.0 Elevation (ft) : Channel Slope (ft/ft) : Channel Length (ft) : Right Overbank Upper Sideslope (z) : DELETED
11 Upper Width (ft) : Middle Sideslope (z) : Middle Width (ft) : Mannings n : Massmann Infiltration Option Used Hydraulic Conductivity (in/hr) : 0.0 Depth to Water Table (ft) : Bio-Fouling Potential : Low Maintenance : Average or Better Structure Stage, Storage Discharge Tables Link: Lnk1 New Channel Lnk1 Elev Storage Discharge Infilt Discharge (ft) (ac-ft) (cfs) (cfs) DELETED
12 DELETED
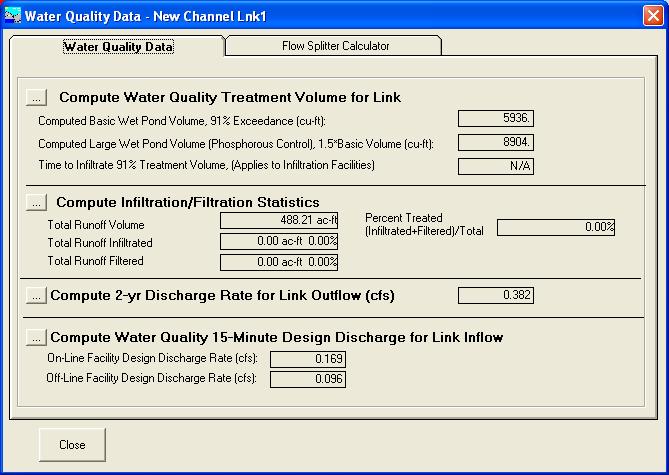
13 **********************FLOOD FREQUENCY AND DURATION STATISTICS******************* SCENARIO: PREDEVELOPED Number of Subbasins: 1 Number of Links: SCENARIO: POSTDEVELOPED Number of Subbasins: 1 Number of Links: 1 ***********Water Quality Facility Data ************* SCENARIO: PREDEVELOPED Number of Links: SCENARIO: POSTDEVELOPED Number of Links: 1 ********** Link: New Channel Lnk1 ********** Basic Wet Pond Volume (91% Exceedance): cu-ft Computed Large Wet Pond Volume, 1.5*Basic Volume: cu-ft 2-Year Discharge Rate : cfs DELETED 15-Minute Timestep, Water Quality Treatment Design Discharge On-line Design Discharge Rate (91% Exceedance): 0.17 cfs Off-line Design Discharge Rate (91% Exceedance): 0.10 cfs Infiltration/Filtration Statistics Total Runoff Volume (ac-ft): Total Runoff Infiltrated (ac-ft): 0.00, 0.00% Total Runoff Filtered (ac-ft): 0.00, 0.00% Percent Treated (Infiltrated+Filtered)/Total Volume: 0.00% ***********Compliance Point Results ************* Scenario Predeveloped Compliance Subbasin: Subbasin 1
14 Scenario Postdeveloped Compliance Link: New Channel Lnk1 **Point of Compliance Annual Maxima Flow Data ** Predevelopment Runoff Postdevelopment Runoff Date Annual Max Q (cfs) Date Annual Max Q (cfs) /30/ /27/ /17/ /02/ /15/ /15/ /23/ /23/ /23/ E-03 10/29/ /07/ /07/ /05/ /02/ /02/ /20/ /21/ /18/ /22/ /16/ /03/ /03/ /09/ /08/ /30/ /29/ /08/ /30/ /22/ /19/ /07/ /25/ /06/ /07/ /25/ /24/ /16/ /16/ /24/ /12/ /28/ /28/ /24/ /23/ /17/ /05/ /03/ /25/ /01/ /17/ /19/ /04/ /06/ /17/ /19/ /13/ /04/ /23/ /03/ /29/ /14/ /13/ /06/ /05/ /27/ /27/ /13/ /24/ /15/ /11/ /26/ /27/ /03/ /02/ /24/ E-03 10/28/ /15/ /17/ /04/ /08/ /15/ /14/ /26/ /21/ /06/ /06/ /05/ /28/ /24/ /03/ /11/ /06/ /18/ /18/ /24/ /26/ /14/ /11/ /05/ /21/ DELETED
15 01/09/ /09/ /04/ /24/ /27/ /27/ /23/ /22/ /03/ E-03 09/03/ /19/ /30/ /09/ /08/ /02/ /27/ /30/ /29/ /25/ /04/ /26/ /26/ /20/ /07/ /02/ /03/ /06/ /06/ /23/ /01/ /07/ /05/ /27/ /16/ /14/ /14/ /21/ /21/ /17/ /17/ /06/ /10/ /17/ /30/ /01/ /15/ /20/ /20/ /27/ /06/ /12/ /17/ /04/ /04/ /24/ /14/ /31/ /25/ /14/ /09/ /08/ /12/ /10/ /24/ /20/ /20/ /02/ /02/ /19/ /08/ /22/ /14/ /09/ /09/ /27/ /27/ /19/ /19/ /04/ /11/ /16/ /19/ /30/ /24/ /20/ /20/ /23/ /23/ /15/ /12/ /21/ /17/ /04/ /04/ /08/ /15/ /15/ /24/ /07/ /03/ /14/ /14/ /25/ /21/ /20/ /11/ /31/ /18/ /13/ /03/ /27/ /02/ DELETED
16 02/16/ /07/ /01/ /24/ /11/ /02/ /05/ /31/ /04/ /04/ /17/ /02/ /20/ /25/ /04/ /04/ /24/ /01/ /17/ /27/ /07/ /07/ /19/ /31/ /24/ /24/ /28/ /25/ /19/ /15/ /10/ /01/ /03/ /03/ /29/ /16/ /23/ /21/ /05/ /29/ /13/ /27/ /19/ /05/ /18/ /05/ /04/ /23/ /14/ /20/ /14/ /27/ /27/ /28/ /25/ /25/ /16/ /09/ /20/ E-03 08/27/ /24/ /24/ /12/ E-03 08/24/ /25/ /14/ /25/ /03/ /17/ /17/ /21/ /20/ /14/ /31/ /19/ /29/ /03/ /28/ /14/ /06/ /18/ /23/ /21/ /26/ /14/ /14/ /05/ /05/ /06/ /16/ /04/ /27/ /31/ /28/ /22/ /15/ /01/ /23/ /27/ /25/ /14/ /02/ /29/ /12/ ****Point of Compliance Ranked Maxima Flow Data **** DELETED Predevelopment Postdevelopment
17 Tr (yrs) Q (cfs) Tr (yrs) Q (cfs) E E E E E E E E E E DELETED
18 DELETED
19 DELETED *** Point of Compliance Flow Frequency Data *** Recurrence Interval Computed Using Gringorten Plotting Position Predevelopment Runoff Postdevelopment Runoff Tr (Years) Discharge (cfs) Tr (Years) Discharge (cfs) Year Year 0.382
20 5-Year Year Year Year Year Year Year Year Year Year Year Year ** Record too Short to Compute Peak Discharge for These Recurrence Intervals *** Point of Compliance Flow Duration Data *** Predevelopment Runoff Postdevelopment Runoff Discharge Exceedance Discharge Exceedance (cfs) Probability (cfs) Probability E E E E E E E E E E E E E E E E E E E E E E E E E E E E E E E E E E E E E E E E E E E E E E E E E E E E E E E E E E E E E E E E E E E E E E E E E E E E E E E E E E E E E E E E E E E E E E E E E E E E E E E E E E E E E E E E-04 DELETED
21 E E E E E E E E E E E E E E E E E E E E E E E E E E E E E E E E E E E E E E E E E E E E E E E E E E E E E E E E E E E E E E E E E E E E E E E E E E E E E E E E E E E E E E E E E E E E E E E E E E E E E E E E E E E E E E E E-06 DELETED
22 E E E E E E E E E E E E E E E E E E E E E E E E E E E E E E E E E E E E E E E E E E E E E E E E E E E E E E E E E E E E E E E E E E E E E E E E E E E E E E E E E E E E E E E E E E E E E E E E E E E E E E E E E E E E E E E E-07 DELETED
23 E E E E E E E E E E E E E E E E E E E E E E E E E E E E E E E E E E E E E E E E E E E E E E E E E E E E E E E E E E E E E E E E E E E E E E E E E E E E E E E E E E E E E E E E E E E E E E E E-07 DELETED **** Flow Duration Performance According to Dept. of Ecology Criteria **** Excursion at Predeveloped ½Q2 (Must be Less Than 0%): 577.1% FAIL Maximum Excursion from ½Q2 to Q2 (Must be Less Than 0%): % FAIL Maximum Excursion from Q2 to Q50 (Must be less than 10%): % FAIL Percent Excursion from Q2 to Q50 (Must be less than 50%): 100.0% FAIL
24 POND FAILS ONE OR MORE DURATION DESIGN CRITERIA: FAIL DELETED
25 MGS FLOOD PROJECT REPORT Program Version: MGSFlood 4.28 Program License Number: Run Date: 01/31/2013 1:59 PM Input File Name: 64th.fld Project Name: 64th Ave E Analysis Title: Comments: Comparison of runoff between pre dev. HMA road section and Porous Asphalt. PRECIPITATION INPUT Computational Time Step (Minutes): 15 Extended Precipitation Timeseries Selected Climatic Region Number: 3 Full Period of Record Available used for Routing Precipitation Station : Puget West 40 in_5min 10/01/ /01/2097 Evaporation Station : Puget West 40 in MAP Evaporation Scale Factor : HSPF Parameter Region Number: 1 HSPF Parameter Region Name : USGS Default ********** Default HSPF Parameters Used (Not Modified by User) *************** ********************** WATERSHED DEFINITION *********************** SCENARIO: PREDEVELOPED Number of Subbasins: Subbasin : Subbasin Area(Acres) Till Forest Till Pasture Till Grass Outwash Forest Outwash Pasture Outwash Grass Wetland Green Roof User Impervious Subbasin Total SCENARIO: POSTDEVELOPED Number of Subbasins: 1
26 Subbasin : Subbasin Area(Acres) Till Forest Till Pasture Till Grass Outwash Forest Outwash Pasture Outwash Grass Wetland Green Roof User Impervious Subbasin Total *Note: Till Forest Flow not included in calculations because the area is replaced with porous asphalt and therefore not contributing to runoff. Runoff link disconnected in MGS to the point of compliance. ************************* LINK DATA ******************************* SCENARIO: PREDEVELOPED Number of Links: 0 ************************* LINK DATA ******************************* SCENARIO: POSTDEVELOPED Number of Links: Link Name: New Copy Lnk1 Link Type: Copy Downstream Link: None Structure Stage, Storage Discharge Tables **********************FLOOD FREQUENCY AND DURATION STATISTICS******************* SCENARIO: PREDEVELOPED Number of Subbasins: 1 Number of Links: SCENARIO: POSTDEVELOPED Number of Subbasins: 1 Number of Links: 1 ***********Groundwater Recharge Summary ************* Recharge is computed as input to Perlnd Groundwater Plus Infiltration in Structures
27 Total Predeveloped Recharge During Simulation Model Element Recharge Amount (ac-ft) Subbasin: Subbasin Total: Total Post Developed Recharge During Simulation Model Element Recharge Amount (ac-ft) Subbasin: Subbasin Link: New Copy Lnk1 Not Applicable Total: Total Predevelopment Recharge is Less than Post Developed Average Recharge Per Year, (Number of Years= 158) Predeveloped: ac-ft/year, Post Developed: ac-ft/year ***********Water Quality Facility Data ************* SCENARIO: PREDEVELOPED Number of Links: SCENARIO: POSTDEVELOPED Number of Links: 1 ***********Compliance Point Results ************* Scenario Predeveloped Compliance Subbasin: Subbasin 1 Scenario Postdeveloped Compliance Link: New Copy Lnk1 **Point of Compliance Annual Maxima Flow Data ** Predevelopment Runoff Postdevelopment Runoff Date Annual Max Q (cfs) Date Annual Max Q (cfs) /27/ /27/ /02/ /02/ /15/ /15/ /23/ /23/ /29/ /29/ /07/ /07/ /02/ /02/ /20/ /20/ /18/ /18/ /16/ /16/ /03/ /03/ /08/ /08/ /29/ /29/ /30/ /30/
28 12/19/ /19/ /25/ /25/ E-02 10/07/ /07/ /24/ /24/ /16/ /16/ /12/ /12/ /28/ /28/ /23/ /23/ /05/ /05/ /25/ /25/ /17/ /17/ /04/ /04/ /17/ /05/ /13/ /13/ /23/ /23/ /15/ /03/ /13/ /13/ /05/ /05/ /27/ /27/ /24/ /24/ /11/ /11/ /27/ /26/ /02/ /02/ /28/ /28/ /17/ /17/ /08/ /08/ /14/ /14/ /21/ /21/ /06/ /06/ /28/ /28/ /14/ /14/ /06/ /06/ /18/ /18/ /26/ /26/ /01/ /01/ /21/ /21/ /09/ /09/ /04/ /04/ /27/ /27/ /22/ /22/ /03/ /03/ /30/ /30/ /08/ /08/ /27/ /27/ /29/ /29/ /04/ /04/ /26/ /26/ /07/ /07/ /03/ /03/ /06/ /06/ /01/ /01/ /05/ /05/ /16/ /16/ /14/ /14/ /21/ /21/ /17/ /17/
29 06/10/ /10/ /30/ /30/ /15/ /15/ /20/ /20/ /06/ /06/ /17/ /17/ /04/ /04/ /14/ /14/ /25/ /25/ /09/ /09/ /12/ /12/ /24/ /24/ /20/ /20/ /02/ /02/ /08/ /08/ /14/ /22/ /09/ /09/ /30/ /27/ /18/ /18/ /11/ /11/ /19/ /04/ /24/ /24/ /20/ /20/ /23/ /23/ /12/ /12/ /21/ /21/ /06/ /04/ /15/ /15/ /24/ /24/ /03/ /03/ /14/ /14/ /21/ /21/ /11/ /11/ /18/ /31/ /05/ /05/ /02/ /02/ /07/ /07/ /24/ /24/ /02/ /02/ /31/ /31/ /04/ /04/ /02/ /02/ /25/ /25/ /04/ /04/ /01/ /01/ /27/ /27/ /08/ /07/ /31/ /19/ /24/ /24/ /25/ /25/ /15/ /15/ /01/ /01/ /03/ /03/ /16/ /16/ /30/ /30/ /29/ /29/
30 06/27/ /27/ /05/ /05/ /05/ /05/ /23/ /23/ /20/ /20/ /27/ /27/ /28/ /28/ /25/ /25/ /09/ /16/ /27/ /27/ /24/ /24/ /24/ /24/ /14/ /14/ /03/ /03/ /17/ /17/ /20/ /20/ /31/ /31/ /29/ /29/ /28/ /28/ /06/ /06/ /23/ /23/ /26/ /26/ /14/ /14/ /05/ /05/ /16/ /16/ /27/ /27/ /28/ /28/ /18/ /18/ /23/ /23/ /25/ /25/ /10/ /10/ /12/ /12/ ****Point of Compliance Ranked Maxima Flow Data **** Predevelopment Postdevelopment Tr (yrs) Q (cfs) Tr (yrs) Q (cfs) E
31
32
33 *** Point of Compliance Flow Frequency Data *** Recurrence Interval Computed Using Gringorten Plotting Position Predevelopment Runoff Postdevelopment Runoff Tr (Years) Discharge (cfs) Tr (Years) Discharge (cfs) Year Year Year Year Year Year Year Year Year Year Year Year Year Year ** Record too Short to Compute Peak Discharge for These Recurrence Intervals *** Point of Compliance Flow Duration Data *** Predevelopment Runoff Postdevelopment Runoff Discharge Exceedance Discharge Exceedance (cfs) Probability (cfs) Probability E E E E E E E E E E E E E E E E E E E E-02
34 3.620E E E E E E E E E E E E E E E E E E E E E E E E E E E E E E E E E E E E E E E E E E E E E E E E E E E E E E E E E E E E E E E E E E E E E E E E E E E E E E E E E E E E E E E E E E E E E E E E E E E E E E E E E E E E E E E E E E E E E E E E E E E E E E E E E E-04
35 E E E E E E E E E E E E E E E E E E E E E E E E E E E E E E E E E E E E E E E E E E E E E E E E E E E E E E E E E E E E E E E E E E E E E E E E E E E E E E E E E E E E E E E E E E E E E E E E E E E E E E E E E E E E E E E E-06
36 E E E E E E E E E E E E E E E E E E E E E E E E E E E E E E E E E E E E E E E E E E E E E E E E E E E E E E E E E E E E E E E E E E E E E E E E E E E E E E E E E E E E E E E E E E E E E E E E E E E E E E E E E E E E E E E E-07
37 E E E E E E E E E E E E E E E E E E E E E E E E E E E E E E E E E E E E E E E E E E E E E E E E E E E E E E E E-07 **** Flow Duration Performance **** Excursion at Predeveloped 50%Q2 (Must be Less Than 0%): -96.2% PASS Maximum Excursion from 50%Q2 to Q2 (Must be Less Than 0%): -96.2% PASS Maximum Excursion from Q2 to Q50 (Must be less than 10%): -75.0% PASS Percent Excursion from Q2 to Q50 (Must be less than 50%): 0.0% PASS MEETS ALL FLOW DURATION DESIGN CRITERIA: PASS **** LID Duration Performance **** Excursion at Predeveloped 8%Q2 (Must be Less Than 0%): Maximum Excursion from 8%Q2 to 50%Q2 (Must be Less Than 0%): -61.2% PASS -61.3% PASS MEETS ALL LID DURATION DESIGN CRITERIA: PASS

38
39
40 Project Information: 64th Ave E Pierce County BMP Sizing Calculator for Flow Control Precipitation Zone Puget East get Site Mean Annual Precipitation 40 in Soil Type Till New and Replaced Impervious Area 35,284 sf Flow Control Standard Achieved? YES LID Runoff Reduction Methods Facility Size Credit Area Mitigated Partial Dispersion Downspout, Sheet Flow, or Concentrated Dispersed Impervious Area sf x ( x + ) = sf *enter dispersed area* Green Roof >4" Growth Medium Green Roof Area sf x ( x + ) = sf *enter green roof area* Permeable Pavement Surface Subgrade Slope 2% Permeable Pavement Area 35,284 sf x 100% = 35,284 sf Design Infiltration Rate in/hr Aggregate Storage Depth for Flow Control = 0.65 ft Subgrade Slope 2-5% Permeable Pavement Area 35,284 sf x ( x ) = 12,617 sf Design Infiltration Rate in/hr Aggregate Storage Depth for Flow Control = 0.65 ft LID Infiltration Facilities Area Mitigated by LID Runoff Reduction Methods Facility Size Equation Area Mitigated 47,901 sf Bioretention Cell (without Underdrain) Ponding Depth in Bioretention Bottom Area sf ( x + ) = sf Design Infiltration Rate in/hr *enter ponding depth* Permeable Pavement Facility Design Infiltration Rate in/hr Permeable Pavement Area sf ( + ) = sf Run-on Area sf *enter design infiltration rate* Aggregate Storage Depth for Flow Control = ft Area Mitigated by LID Infiltration Facilities 0 sf Notes: Total Area Mitigated Flow Control Standard Achieved? YES 47,901 sf LID - low impact development sf - square feet in - inch precip - precipitation ft - feet in/hr - inch per hour min - minimum Herrera Environmental Consultants (1) Average subsurface ponding depth in aggregate storage reservoir. Version:
41 PRELIMINARY PROJECT PLANS 7
42

43