AAPA Port & Marine Terminal Operator Perspectives January 29, 2015
|
|
|
- Madeline Russell
- 5 years ago
- Views:
Transcription

1 AAPA Port & Marine Terminal Operator Perspectives January 29, 2015


2 Thriving California Hub Top 11% of US Ports For containerized and noncontainerized Cargo

3 Port Governance Commercial Trade Gateway


4 Port Governance Created in 1937 by an Act of the Legislature Special District H&N Code Board of 5 Elected Commissioners City of Port Hueneme City of Oxnard Oxnard Population 200,000 Port Hueneme Population 22,500 We get the job done. The Port has a flexible, can do attitude, with an open door policy and easy access to Port management and decision makers
5 Why Hueneme?

6 Prime Location Commercial Trade Gateway to North, Central and South America, Asia, Europe and Scandinavia

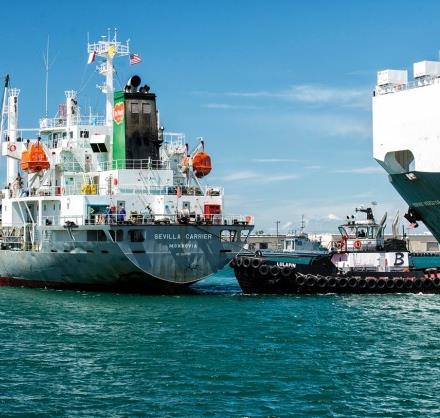
7 Port Overview

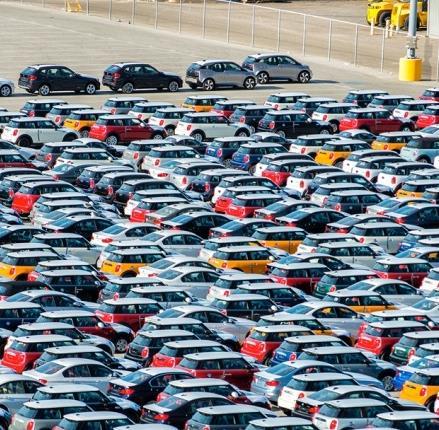
8 World Class Distribution Centers Del Norte Distribution Seaboard Lineage Logistics The Port of Hueneme Vehicle Processing Channel Islands Cold Storage 279 Acres Private / 15 Acres Public

9 VCRW: LLC

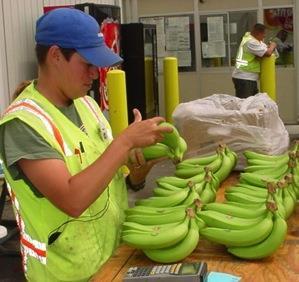
10 Cargo Performance Vital Niche Market Port


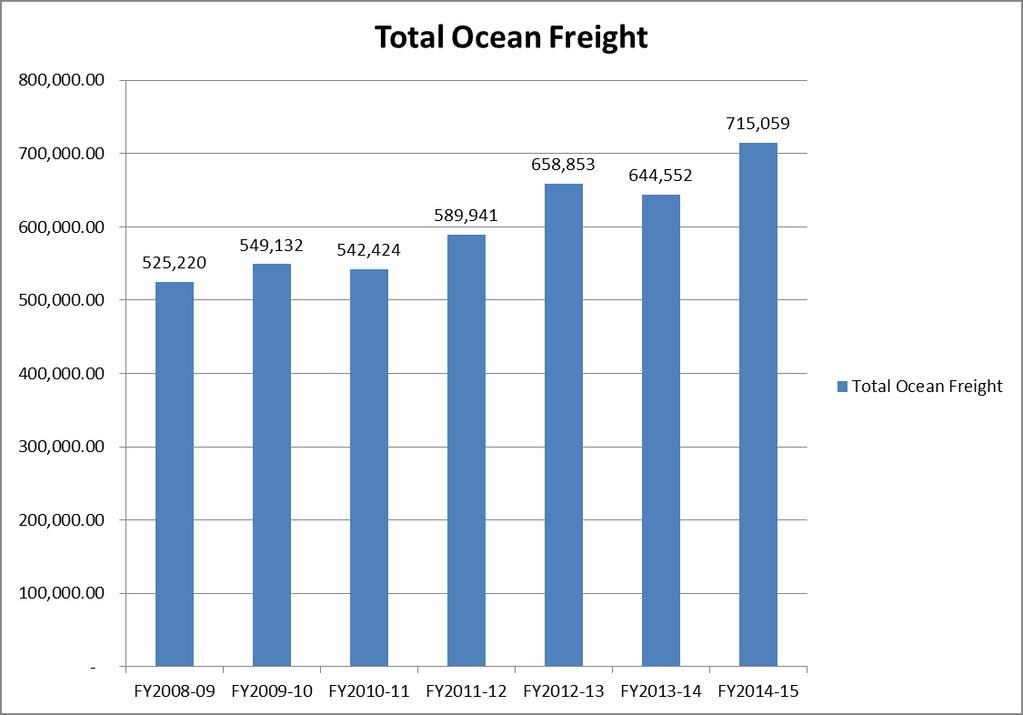
11 Tonnage By Commodity


12 Total Ocean Freight Cargo Performance 1,600, Total Ocean Freight 1,400, ,338,737 1,338,936 1,200, ,183,941 1,143,412 1,133,071 1,219,904 1,000, ,033, , , , , FY FY FY FY FY FY FY Up 198 Tons! Another Benchmark Year!

13 1 st & 2 nd Quarter Performance FY
14 Ports: Vital Economic Engines Why We Need to Invest in Our Nation s Seaports and Intermodal Corridors!
15 Value of US Seaports Move $3.8 Billion Goods 13 Million Jobs 650 Billion Personal Income $200 Billion in Federal, State, and Local Tax Revenue Trade projected to double by 2020 and quadruple after 2030 We Need to Invest to Remain Globally Competitive Keep Pace or Lose Market Share
16 Value of California Ports Over 40% of the total containerized cargo entering the United States arrives at a California port. Almost 30% of the nation s exports originate from a California port. Nationwide, more than 2 million jobs are linked to a California port. half-million jobs people in California, and generate an estimated $7 billion in state and local tax revenues annually. Transportation Corridors Need to Be a Priority at the State Level


17 Port Hueneme: Local Impacts $1.1 Billion Total Economic Activity 10,226 Total Direct, Induced, Indirect and Related Jobs. $69 Million in State and Local Taxes From Maritime Activity.


18 Preparing for the Global Change Vision

19 What s Happening in the World And Happening Fast! New Global Shipping Line Alliances and their expansions Sizes of new vessel orders continues to grow Demographic Trends Industry shifts--china, India and South America global seaborne trade will double by 2030 Technology E-Commerce; Automation; Oil and energy prices impacted by new technology; LNG Bunkering Environmental Sustainability- long term growth and profitability of the global supplychain will depend on ethical sourcing


 Comprehensive Port Sign Plan Design standards Way")
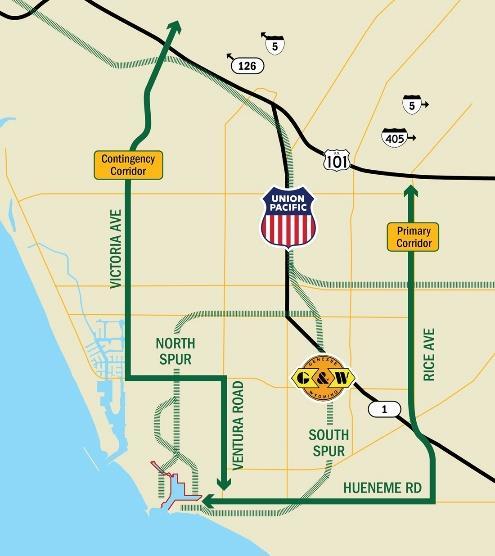
20 Global Trends, Local-Port Response Traffic Management Planning and Implementation Traffic Management to Ensure Safe Flow of Freight New Pavement Markings Stenciling in travel lanes to support way finding Designate truck queuing areas Speed limits in travel lanes Define through-traffic lanes Blue Light During Auto Operations Heightened awareness Expect higher speeds and caravans Variable Message Signs On-terminal Communications Intercept inbound trucks early if Gate blocked (Offterminal) Comprehensive Port Sign Plan Design standards Way finding with current customers


21 2020 Strategic Plan: Prudent Investment The Local and Regional Economic Impacts of Port of Hueneme Port of Hueneme Market Strategy Strategic Business Plan - Port of Hueneme Short Sea Shipping/America s Marine Highway Research Traffic Management Study - Port of Hueneme 5-Year Capital List - Port of Hueneme December 5, 2012 May 20, 2013 April 3, Ongoing December 12, Completed Baseline Efforts Market Focus International Trade Mission Business Development Port Customers Analysis Markets Existing New Funding Federal State Local Plan Elements Projects Transportation Equipment Facilities Short Sea Shipping Domestic/International Trading Partners, Shippers, Operators, Funding Return on Investment Financial Evaluations Cost/Benefit Analysis Plan Formulation 2020 Strategic Plan Profile of Existing Port Operations Opportunities & Constraints Baseline Financial Modeling Port Competiveness Master Plan Economic Returns
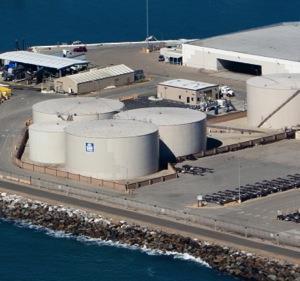
22 Getting Local Support to Invest Containers (50,000 Unit) 836 jobs, $6.5m in taxes, $69.4 m in local revenue Break-Bulk (350,000 tons) 114 direct jobs, $15.6m in local revenue Auto / Roll-on Roll-off (120,000 autos) 724 jobs, $6.0m in taxes, $36.5m in local revenue Liquid Bulk (50,000 tons) 80 jobs, $600,000 in taxes, $3.2m in local revenue Aggregate (200,000 tons) 56 jobs, $464,000 in taxes, $72m in local revenue Fish (Existing Operation) 1,375 jobs, $10.8m in taxes, $55.5m in local revenue
23 Improvement Project = Local Prosperity Harbor Deepening: current customers can bring in more cargo resulting in more jobs and revenue to the local economy Project allows for the Port to attract new class vessel fleet and increase capacity to handle 229,000 tons more cargo annually Helps generate 563 new direct and indirect jobs in the region $28 million in positive revenue impact and $4.6 million more in taxes Dredge materials to support beach nourishment at community beaches


24 National Freight Infrastructure Policies NFAC & MTSNAC

25 National Freight Advisory Committee Charter The objective of this committee is to provide information, advice, and recommendations to the U.S. Secretary of Transportation on matters relating to freight transportation in the United States and the implementation of the freight provisions of the Moving Ahead for Progress in the 21st Century Act (MAP-21), Pub. L. No Broad public and private sector membership State DOT Secretaries Elected officials from across the country Representatives of all freight modes Shippers Researchers Labor Environmental advocates Community advocates
 International Freight Strategies and Operations (IFSO) First and Last Mile (FLM) Ports participate on PDO and")
26 NAFC Subcommittees NFAC Subcommittees Conditions, Performance, and Data (CPD) Safety, Security, and Environment (SSE) Project Delivery and Operations (PDO) Research, Innovation, and Technology (RIT) International Freight Strategies and Operations (IFSO) First and Last Mile (FLM) Ports participate on PDO and FLM
 grant program Harbor Maintenance Tax Tax Exemption on")

27 NFAC Deliverables to Date Participated in 2-day brain storming session to provide input to the national freight plan Adopted 3 Resolutions Transportation Investment Generating Economic Recovery (TIGER) grant program Harbor Maintenance Tax Tax Exemption on Municipal Bonds Commented on the primary freight network Delivered 81 Recommendations on National Freight Strategic Plan Recommendations on MAP21 Reauthorization Themes: Multi-Modal Transportation Corridors Dedicated Funding for Freight Invest in US Transportation Infrastructure

28 Most Current Work of NFAC White paper on Federal Policy Recommendations for Multijurisdictional Planning-holistic approach to federal policy to foster appropriate consideration of freight in the planning process for multi-state corridors and Ports infrastructure White paper on Workforce Recommendation- Across six modal subsectors, the transportation industry faces major demographic challenges with job growth, retirement and turnover. US DOT finalizing National Freight Strategic Plan Framework to be reviewed by NFAC in spring
29 MTSNAC
30 MTSNAC: Objectives and Scope of Activities Advisory Council to provide advice and make recommendations to the Secretary: Make recommendations to expand the use of the marine transportation system for freight and passengers; Ensure an environmentally responsible and safe system that improves the global competitiveness and national security of the U.S. ; Influence the development of a national freight policy from a marine transportation perspective
31 Subcommittee Work Marine Highway Subcommittees American Marine Highways should be recognized as part of the Surface Transportation System All states touching on navigable waters should have a maritime coordinator in their respective Departments of Transportation Create demand for Marine Highway services Port Advisory Subcommittee Development of national freight strategy Coordination of federal agencies on ports Funding mechanism for ports Ship Building Developed recommendations to strengthen the U.S. commercial shipbuilding industrial base Worked to improve the effectiveness and transparency of the Title XI loan guarantee program Encourage the development of a comprehensive LNG bunkering terminal network to support the emerging LNG-powered U.S.-flag fleet


32 National Maritime Strategy Met September 11, 2014 held in Washington DC; Brainstorming White Board Meeting Comprehensive Plan to promote the growth and efficiency of the US Merchant Marine, U.S. Shipbuilding and Repair Industry and the Marine Transportation System Infrastructure to support international trade in the future, the Inland Waterway System, Coasts, Great Lakes, AMH
33 Thank You