Michigan Competitive Logistics and Benchmarking
|
|
|
- Percival Rich
- 5 years ago
- Views:
Transcription
1 Michigan Competitive Logistics and Benchmarking Business Leaders for Michigan September 7, 2012
2 Michigan Competitive Logistics and Benchmarking 1. Project Objective/Methodology 2. Executive Summary 3. Stakeholder Interviews: Key themes 4. Midwest Freight Analysis 5. Overview and Assessment of Michigan s Logistics System 6. Competitive Positioning Analysis 7. Summary Observations 8. Suggested Actions 2
3 Project Objective To identify strategic priorities to enhance Michigan s ability to compete as a logistics center 3
4 Methodology Reconnaissance - Interviews Local Policy Makers Shippers Logistics Industry Asset Owners Conducted a Scan of Pertinent Data Developed an Overview of Michigan s Logistics System Custom Designed Competitive Benchmarking Tool Interpretation and Integration of Data, System & Benchmarking Observations and Opportunities 4
5 Executive Summary Key Takeaways Support Existing Business Michigan must accelerate efforts to support and retain its existing industry base Promote Business Growth Create customized business strategy to grow sweet spot niche segments Identify and deliver world-class infrastructure Increase competitiveness and improve key infrastructure for connections to important global markets within the Midwest region 5
6 Executive Summary Michigan faces strong competition from other Midwest markets and globalization and this creates challenges for legacy industries Michigan has several advantages to meet these challenges, including Large consumption and production market Access to Canadian market and seaports Extensive underlying transportation infrastructure Challenges include: Geographic position for transcontinental motor carrier and train routes Qualitative comparison to Midwest competition Missing infrastructure components causing time, reliability and cost problems Moving forward, Michigan should focus on: Protecting and building upon its strong base Defining sweet spot industry/niche growth opportunities Investments for key infrastructure projects to streamline for reliability, time and cost advantages 6
7 Executive Summary Aerotropolis Take advantage of world-class passenger airport asset Exploit global gateway status and comparatively low-congestion hinterland Capitalize on growth as passenger and air cargo hub Develop airport district as international business service center and global product movement center Opportunity Develop DTW airport region to a national-level, multi-faceted business hub Requirements Tightly defined business strategy tied to planning (inside gate and district) New, modern air cargo infrastructure Attract new air cargo players Attract business niches Intersect cargo and passenger route development business development 7
8 Rail Infrastructure Executive Summary Detroit Intermodal Freight Terminal (DIFT) Streamline rail intersections between multiple rail carriers Improve time, cost and reliability of rail movements Improve competitiveness of truck to rail transfer (growing importance of intermodal) Assess the potential of development and investment at intermodal centers Define potential for other intermodal hub outside of Detroit region Develop business case for infrastructure funding Tunnel Assess business case for new rail tunnel to Canada from Detroit Direct Toronto and Montreal service Direct high-capacity access for double-stacked trains to Port of Montreal 8
9 Executive Summary New US-Canada Highway Bridge Increases capacity at Detroit-Windsor international border crossing; busiest in North America Improves time to market truck access to/from Toronto and Montréal markets and supply chains Improves time to market truck access to/from Canadian ports To/from European/Middle Eastern/South Asian markets Critical Regional Competitiveness Issues Supply chain resiliency Risk management Delay avoidance 9
10 Stakeholder Interviews: Key Themes Modes Motor carrier is dominant mode Concern some limited availability of specialized equipment Modest concern about road conditions; largely quality of roads and impact to truck equipment Rail and air used to a lesser extent Rail in/outbound via Chicago produces periodic delays & reliability issues Rail in/outbound from West Coast largely has little rail route choice so Chicago delays are planned-in (Port of Prince Rupert could be exception) Little use of air cargo beyond expediting as back-up (reflects industries interviewed) 10
11 Stakeholder Interviews: Key Themes Markets Globalization forces are absolutely critical growing trend of moving manufacturing supply chains closer to end-market Certain specialized supply chains will be global, most others regionalized Legacy industries may be vulnerable to reduced corporate presence as they expand to more distant markets or source from evolving supply chains 11
12 Stakeholder Interviews: Key Themes Michigan has an aggressive State program to attract shippers along rail lines High road weight limits are important asset to some Weather is not a special disadvantage no worse than most MI s ability to handle is better than most Some view labor as generally not an advantage - lagging skill levels and high unionization levels Michigan is generally not advantaged by geography for transcontinental motor carrier or rail as it is a peninsula 12
13 Stakeholder Interviews: Key Themes Infrastructure Road - Constant road construction is good and bad Road - New bridge crossing is recognized as important for redundancy and reliability Rail - Fairly little feedback about proposed DIFT outside of policy and project insiders Rail - Even less feedback about the (CP) rail tunnel or proposition for new tunnel Rail Investment site opportunities along short line system Rail Detroit seen as complex rail hub; delays typical; but could be a viable alternative to Chicago Air Excellent passenger assets, poor cargo facilities and 3PL complex 13
14 MIDWEST FREIGHT ANALYSIS 14
15 Purpose and Data Sources Government data sources include: U.S. Department of Transportation; National Highway Planning Network; Multimodal Freight Database; Freight Analysis Framework; Highway Performance Monitoring System; FHA Office of Freight Management Private data providers include: UPS; FedEx; Evergreen; Singapore Air; Maersk; Hanjin; COSCO; BNSF; CSX; NS; CN; CP; PC*Miler Road; PC*Miler Rail Three levels of review Midwest/regional State to State MSA level 15
16 Summary The largest industries active in MW freight are gravel, cereal, grains, and coal All three face near term downward pressures, but positive medium/long term growth prospects Michigan is unique in its concentration of motor vehicle and related products industry Other major product groups are waste/scrap, nonmetal mineral products, and base metals Truck is the leading mode, followed distantly by rail Canada is the largest foreign market for goods Domestically, the area just outside of the Midwest, Wyoming, and Texas are the largest trading partners 16
17 Industry Analysis Section TOP THREE INDUSTRIES ACTIVE IN MIDWEST FREIGHT MOVEMENT Commodity Key Export Markets (Modes) Growth Prospects and Key Drivers 1 Gravel Kentucky (Truck/Multimodal) Minnesota (Truck) Residential, highway and bridge construction expected to rise Consolidation of smaller industry players may drive up costs 2 Cereal Grains Louisiana (Water) Missouri (Truck) Georgia (Rail) Protected industry Free-trade agreements may increase competition 3 Coal Tennessee (Multimodal) West Virginia (Water) Kentucky (Multimodal) Long-term growth as new markets emerge Shaky European economy; Low natural gas prices are competitive 17
 East Asia (11.")
 SW/Central Asia (8) Freight Tonnage by Mode 1% 4% 0% 5% 8% 14% 68% Freight Value by Mode")
18 Midwest International Freight Dynamics Top International Trading Partners (ktons) Inbound Canada (96) East Asia (11.4) Mexico (10) Europe (8) Outbound Canada (45) East Asia (29) Rest of Americas (10) Europe (9) SW/Central Asia (8) Freight Tonnage by Mode 1% 4% 0% 5% 8% 14% 68% Freight Value by Mode 3% 2% 14% 3% 0.4% 5% 73% Truck Rail Water Air Multimodal Pipeline Other 18
19 Midwest Domestic Freight Dynamics TOP FIVE STATES FOR MIDWEST FREIGHT TRADE Outbound Destinations Inbound Origins State Tonnage (ktons) State Tonnage (ktons) Kentucky 53, Wyoming 133,011.5 Missouri 35, Texas 71, Louisiana 35, Kentucky 59, Pennsylvania 30, Minnesota 58, Texas 30, Tennessee 47,941.1 TOP FIVE COMMODITIES IN MIDWEST FREIGHT From Midwest States To Midwest States Commodity Tonnage (ktons) State Tonnage (ktons) Cereal grains 343,083.5 Gravel 316,039.9 Gravel 305,635.1 Coal 297,840.7 Waste/scrap 194,092.7 Cereal grains 283,937.8 Nonmetal min. prods. 188,149.7 Waste/scrap 195,391.3 Base metals 143,249.2 Nonmetal min. prods. 185,
20 State Freight Dynamics: Michigan Top Commodities Coal, Coal n.e.c., base metals, motorized vehicles, base chemicals, gravel, nonmetal minerals Total Domestic Weight Traded 436,290 ktons Top Trading Partner States: Export to: Ohio Indiana Illinois Wisconsin Import from: Wyoming Ohio Texas Indiana 20


21 State Freight Dynamics: Illinois Tonnage by Mode % 1% 7% 6% 9% 8% Air Multimodal Other Pipeline Top Commodities Coal, Coal n.e.c., crude petroleum, base metals, gravel, cereal grains, other agricultural products Total Domestic Weight Traded 897,695 ktons 69% Rail Truck Water Top Trading Partner States: Export to: Louisiana Indiana Missouri Kentucky Import from: Wyoming Indiana Texas Missouri 21

22 State Freight Dynamics: Ohio Top Commodities Coal, coal n.e.c., base metals, crude petroleum, gravel, cereal grains, other foodstuffs, base chemicals, chemical products Total Domestic Weight Traded 603,880 ktons Top Trading Partner States: Export to: Michigan Indiana Pennsylvania Kentucky Import from: Kentucky Michigan West Virginia Texas 22
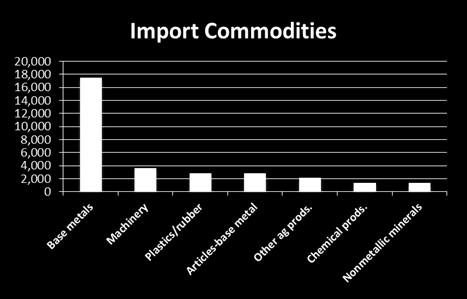
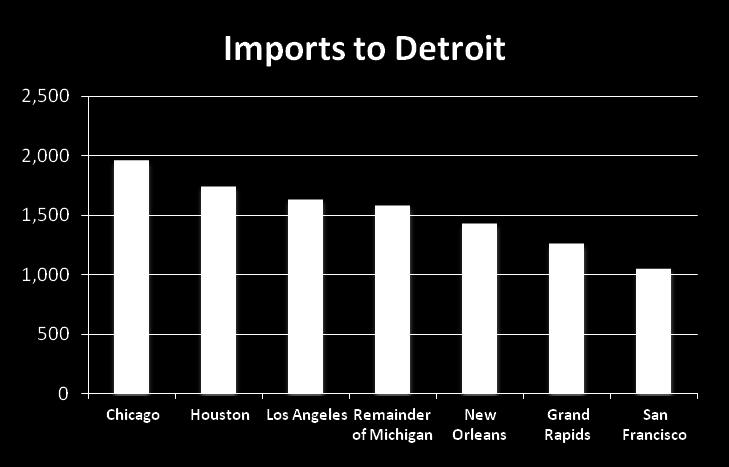
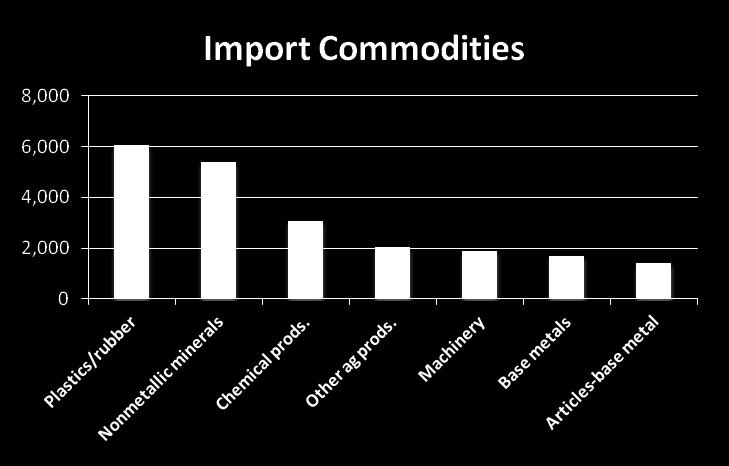
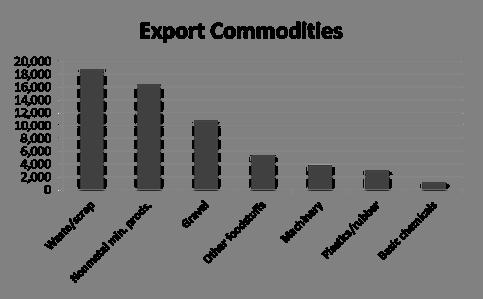
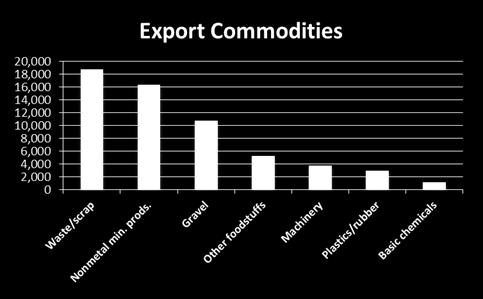
23 Detroit Freight Summary Top Trade Markets: Detroit Ohio, Indiana, Georgia Wyoming, Ohio, Indiana Detroit Truck Rail Air Commodities by Mode Waste/scrap, base materials, nonmetal mineral products, motorized vehicles Base metals, nonmetal mineral products, cereal grains, motorized vehicles Motorized vehicles, precision instruments, plastics/rubber, electronics, articles-base metal, pharmaceuticals Highest-Value Commodities Motorized vehicles Machinery Base metals Electronics Articles-base metal 23
24 Chicago Freight Summary Top Trade Markets Chicago Indiana, Wisconsin, Michigan Indiana, Texas, Wyoming Chicago Truck Rail Air Commodities by Mode Nonmetal mineral products, waste/scrap, gravel, base metals Fertilizers, base metals, coal n.e.c., waste/scrap Motorized vehicles, electronics, grain products, precision instruments Highest-Value Commodities Pharmaceuticals Electronics Mixed Freight Machinery Base Metals 24
25 Indianapolis Freight Summary Top Trade Markets Indianapolis Ohio, Illinois, Georgia Tennessee, Illinois, Ohio Indianapolis Truck Rail Air Commodities by Mode Gravel, coal n.e.c, waste/scrap, nonmetal mineral products Cereal grains, animal feed, base metals, waste/scrap Printed products, miscellaneous manufactured products, electronics, pharmaceuticals, live animals/fish, motorized vehicles Highest-Value Commodities Machinery Electronics Mixed Freight Motorized vehicles Miscellaneous manufacturing products 25
26 Grand Rapids Freight Summary Top Trade Markets Grand Rapids Ohio, Indiana, Illinois Wyoming, Indiana, Ohio Grand Rapids Truck Rail Air Commodities by Mode Waste/scrap, other foodstuffs, nonmetal mineral products, cereal grains Base metals, natural sands, base chemicals, other foodstuffs Plastics/rubber, machinery, miscellaneous manufacturing products, motorized vehicles, articles-base metal, base metals, printed products Highest-Value Commodities Machinery Motorized vehicles Mixed Freight Furniture Articles-base metal 26


27 Columbus Freight Summary Top Trade Markets Columbus Michigan, Illinois, Indiana Kentucky, Pennsylvania, Columbus West Virginia Truck Rail Air Commodities by Mode Natural sands, gravel, nonmetal mineral products, waste/scrap Cereal grains, other agricultural products, gravel, waste/scrap Base metals, machinery, motorized vehicles, electronics, pharmaceuticals, precision instruments, mixed freight Highest-Value Commodities Machinery Mixed Freight Base metals Gasoline Misc. manufacturing products 27


28 Detroit Trade Growth


29 Detroit Trade Growth

30 Cargo Movement Forecasts Through 2035 Total Freight in Thousands of Kilotons 30

31 Cargo Movement Forecasts Through 2035 Total Freight in Million USD 31

32 Detroit Canada: Trade Relationship Michigan s proximity to Canada offers superior access, with potential to capture an even larger share of the cross-border relationship. 32

33 Detroit Canada Trade Forecasts 2035 Top Commodities (By Tonnage Percent Increase) Pharmaceuticals Furniture Precision instruments Miscellaneous manufacturing goods Electronics Live animals/fish Chemical products Machinery Other agricultural products Nonmetallic minerals Plastics/rubber Alcoholic beverages Milled grain products 551% 453% 386% 376% 367% 355% 354% 318% 309% 306% 294% 294% 283% Import Growth by Mode (Canada to Detroit) Truck Rail Water Air (inlcude truck-air) Multiple Modes Pipeline Other & unknown 33
34 Summary Data Points Proximity to Canada provides some advantage over Midwest competitors for cargos moving by rail and truck Rail Detroit has geographic challenge, located north of rail trunk lines Imports moved via rail from U.S west coast nearly all transit via Chicago. Detroit and other Midwest peers are time and price disadvantaged as a result Detroit may have relief valve against Chicago (via Prince Rupert). Competitor markets located south of Detroit have a modest advantage for imports moved via rail from some east coast ports (New York, Norfolk, Jacksonville, Savannah, Charleston) Truck Large percentage of U.S. population within truck freight distance 34
35 Summary Data Points Opportunities Maintain market share growth for regional distribution for domestic manufactured goods and foreign imports Modest growth expected in bulk commodities and higher value-add finished products and consumer goods Develop air-related growth for high-value items In addition to traditional sector strengths, smaller volumes of new high-value categories are possible Challenges Not seeing diversification in Detroit as in some markets Michigan is not exporting high levels of value-added product Critical to maintain motor vehicle industry market 35
36 Overview and Assessment of MI s Logistics System Highway/Motor Carrier Railroad Air Ocean/Maritime 36
37 Motor Carrier System Network Overview Extensive highway system Orientation: East/West to Canada Key Projects - Issues Intermodal Bridge North/South to Midwest Crucial need to assure streamlined hand-offs from truck to rail; truck to air Shipper/Manufacturer perspective: time and cost advantages to Canadian markets and ports and supply chain resiliency/redundancy Labor availability Competition with manufacturing for labor 37
38 Railroad System Network Overview Legacy and Quite Complex Route System Quite a lot of the system designed to handle bulk and agriculture Designed for a different industrial era, but adapting to new market realities Effectively two systems Class 1 (CN, CP, CSX, NS ) Regional and Short line (Rail America, others) Flint is demark line for short line-only service (from Flint northward) No intermodal hubs outside of Detroit region Presents challenges for shippers in Western and Northern Michigan Complex Detroit system Converging lines from north, west, south and east (via the CP tunnel) Multiple, disconnected hubs leads to reliability, time and cost issues 38

39 RED - CN YELLOW - CSX GREEN NS BLACK - SL Michigan Rail System Map 39

40 Detroit Region Rail System Map 40
41 Railroad System Overview of Cargo Various natural resource commodities Agriculture products Steel Chemicals Auto parts Finished Autos Intermodal Routes Westbound generally thru Chicago Eastbound via CN or CP into eastern Canada and to PoM and PoH, or via CSX, NS into their E-W network Southbound via CN, CSX and NS to southern markets, Gulf ports 41
42 Railroad System Projects and Issues DIFT Important improvement Need to understand business value to whom and how much Need for associated business plan (economic devt strategy) Funding Short/Mid Term Tunnel Benefit of one railroad Very high cost Bi-national partnership Long Term Intermodal access outside of DIFT/Southeast Michigan 42
43 Air System Four Primary Michigan Air Cargo Airports Fewer air cargo carriers than expected DTW important national passenger asset, underutilized Annual Cargo - 455M lbs Delta Hub 2 nd largest/138 destinations, business passenger hub East Coast Asian Gateway 22 international destinations Poor cargo assets, substantial belly capacity; 50% Expanding but modest freighter service (FedEx, UPS, Lufthansa) Willow Run - low cost air cargo asset serving charter services Annual Cargo - 200m lbs Unscheduled service Grand Rapids Lansing Annual Cargo - 80m lbs FedEx feeder Newark, Memphis, Indianapolis Annual Cargo - 41m lbs UPS feeder Louisville, Rockford, Philadelphia 43
44 Air System Overview of Cargo High value technology products, other time sensitive, high touch products Expedited deliveries Critical for business contingency planning Routes An important regional global connection for State s economy DTW functions as national and global connection GR and Lansing function as MI feeder and national connection 44
45 Air System Market Potential High tech products in and out not moving via Michigan transport assets today Key is to understand depth of the current market Chicago leakage Opportunity to take advantage of existing aircraft belly capacity Potential to take advantage of existing flight convergence DTW hub Key Projects Issues Infrastructure and Marketing Strategy mapped to high growth sectors Practical Business Plan for cargo facilities and support business infrastructure Funding Plan for appropriate projects (public and private) Need air cargo champion 45
46 Ocean/Maritime System Network Overview 36 port assets in MI Detroit - Public and private docks Modest role in State logistics system (traditional Great Lakes cargo) Little infrastructure connectivity though a proposed DIFT connection Overview of Cargo Steel, agri-products, iron ore, project cargo, chemicals, some renewables No intermodal cargo 46
47 Ocean/Maritime System Routes Inbound steel, project cargo Outbound agricultural products, steel and project cargo Intralake vessels and carriers Lakers Predominant move: from Western Great Lakes International vessels and carriers Salties Through the Seaway to Port of Montreal for transload or direct to Northern Europe, South America Key Projects - Issues Longstanding and well-understood Seaway System constraints: winter closure and lock dimensions MI environmental law constraint Proposed new asset in the thumb area 47
48 Competitive Positioning: developing insight from the decision maker s perspective Benchmark Michigan against key competitors Map competitors positions relative to Michigan Define comparative strengths and weaknesses Identify product improvement priorities 48
49 Benchmarking and Competitive Position Competitive positioning analysis illustrates how a logistics decision maker might initially assess location-influenced supply chain options based on readily available data and prevailing industry impressions. Four basic supply chains representative of key Michigan industry sectors were chosen to illustrate typical scenarios Automotive Consumer Goods Office Furniture / Systems Medical Devices The goal is not to provide a definitive solution but to provide an indication of how location factors can influence logistics location decisions, identify location strengths and areas for product or marketing improvement. Five metro areas are compared: Chicago, Columbus, Detroit, Grand Rapids and Indianapolis. Each of the four representative supply chains were evaluated for transportation costs and three qualitative categories identified through interviews as primary decision factors: Time in transit Reliability Infrastructure / Business Environment 49
50 Summary of Comparative Strengths / Weaknesses Detroit has the following strengths in the qualitative analysis Rail service to Canada Access to Canada / customs Rail Infrastructure Interstate highway network Higher legal truck weight limits Furniture manufacturing industry cluster Air transport industry presence Availability of logisticians And the following areas for product improvement Infrastructure limitations (e.g. bridge, Intermodal assets, air cargo facilities, rail tunnel) Limited specialized logistics-oriented property assets Labor relations-unionization constraints Grand Rapids has the following strengths in the qualitative analysis Minimal choke points Minimal metro congestion Higher legal truck weight limits Average metro interstate driving speed Furniture manufacturing industry cluster And the following areas for product improvement Availability of industrial space Warehousing and transport industry presence Labor relations-unionization constraints Air transport industry presence 50
51 How Benchmarking and Competitive Position Mapping were performed Cost elements for each specific profile were developed from standard public & proprietary sources. Qualitative criteria were selected by the consulting team based on interviews, research & past experience. Relative weights were developed among the 3 main qualitative categories and for each criterion within a category as a proportion of 100. Weights vary for each supply chain profile depending upon nature. For each profile candidate locations were scored by the consulting team based on industry knowledge using a 1-9 scale (9=best). Composite weighted scores were then tabulated. Finally, indexed cost results and composite quality scores were plotted on a Cost/Quality Map with desired values towards the top and right of the map. This illustrates how each location generally compares on a cost-quality trade off An analyst can use this to better understand the dynamics of trade-offs, narrowing choices before short listing locations for more rigorous evaluation. The size of the data point circles on the cost-quality charts represents total freight volume processed at each location. These charts provided perspective to the consulting team in interpreting the data and interviews and in shaping conclusions and recommendations; they can provide Michigan with insight for further action on product improvement and marketing initiatives. Additional profiles can be developed and weights varied through sensitivity analyses at a later time. 51
52 Automotive Profile Description Mode Volume - Auto components parts outbound to KC and Arlington, TX Trucks 4 ftl / day / plant - Auto components inbound from Ohio Trucks 2 ftl / day - Finished autos to Canada Rail 5 cars / week CATEGORY Weight Time in Transit 30% Average transit time (Kansas City) 25% Average transit time (Arlington, TX) 25% Average transit time (Cleveland) 20% Average rail transit time to Toronto 15% Frequency of trains to Toronto 15% Reliability 50% Number of rail carriers to Toronto 20% Red flags (bridges, choke points) 25% Labor relations 25% Weather risk 30% Infrastructure/Bus. Environment 20% Taxes 15% Access to Canada/ customs/fda 15% Warehousing and transportation ind. presence 20% W and T workforce presence 20% Rail infrastructure/ short lines 10% Metro Congestion Index 10% Interstate Highways 10% (9 = best) Chicago Qualitative Ranking Columbus Detroit Grand Rapids Indianapolis Time in Transit Reliability Infrastructure/Bus. Environment 52
53 Automotive Cost Quality Tradeoff COST MODEL Chicago Columbus Detroit Grand Rapids Indianapolis Outbound to Kansas City $ 21,574 $ 26,674 $ 31,117 $ 28,444 $ 18,948 Outbound to Arlington, TX $ 19,471 $ 21,379 $ 24,437 $ 23,101 $ 18,233 Inbound from Cleveland, OH $ 8,294 $ 2,953 $ 3,315 $ 6,204 $ 6,646 Autos outbound to Toronto $ 17,895 $ 21,025 $ 12,385 $ 17,390 $ 19,060 TOTAL $ 67,235 $ 72,030 $ 71,255 $ 75,139 $ 62,887 Weekly profile shipping costs Cost vs Quality Qualitative Score Cost Score (100 = Avg.) Chicago Columbus Detroit Grand Rapids Indianapolis Circle sizes indicate location total freight volume 53
54 Consumer Goods Profile Description Mode Volume - Inbound Containers through East Coast Port Ship 1000 tons - Outbound Truckloads over 250 Mile Radius Truck 200 FTL CATEGORY Weight Time in Transit 40% 500 mile driving time at average metro speed 60% Average transit time from Costa Rica 25% Shipping frequency 15% Reliability 30% Number of ports 25% Red flags (bridges, choke points) 25% Labor relations 25% Weather risk 25% Infrastructure/Bus. Environment 30% Availability of warehouse space 10% Taxes 10% Population within 250 mile radius 20% Warehousing and transportation ind. presence 10% W and T workforce presence 10% Legal truck weight limits 5% Metro Congestion Index 10% Port capacity 15% Interstate Highways 10% (9 = best) Qualitative Ranking Chicago Columbus Detroit Grand Rapids Indianapolis Time in Transit Reliability Infrastructure/Bus. Environment 54
55 Consumer Goods Cost Quality Tradeoff COST MODEL Chicago Columbus Detroit Grand Rapids Indianapolis $ 129,150 $ 135,695 $ 133,770 $ 146,860 $ 141,610 $ 69,373 $ 67,285 $ 65,600 $ 67,161 $ 68,815 $ - $ - $ - $ - $ - $ 198,523 $ 202,980 $ 199,370 $ 214,021 $ 210,425 Weekly profile shipping costs Cost vs Quality Qualitative Score Cost Score (100 = Avg.) Chicago Columbus Detroit Grand Rapids Indianapolis Circle sizes indicate location total freight volume 55
56 Office Furniture / Systems Profile Description Mode Volume - Finished goods outbound (70% domestic) - Center of US Truck 6 FTL / day population - Finished goods outbound (30% international) Europe (Rotterdam) Ship 21 containers / wk - Inbound raw materials (wood, steel, ) from local region Truck 2 FTL / day CATEGORY Weight Time in Transit 30% 350 mile driving time at average metro speed 22% Avg. transit time Reno, Dallas, NJ, FL 33% 250 mile driving time at average metro speed 15% Average shipping time (Rotterdam) 22% Shipping frequency (Rotterdam) 8% Reliability 40% Number of ports to Rotterdam 20% Red flags (bridges, choke points) 40% Labor relations 20% Weather risk 20% Infrastructure/Bus. Environment 30% Availability of warehouse space 10% Taxes 10% Access to Canada/ customs/fda 5% Gross state product for furniture manufacturing 15% Warehousing and transportation ind. presence 15% W and T workforce presence 15% Metro Congestion Index 10% Port capacity 10% Interstate Highways 10% (9 = best) Qualitative Ranking Chicago Columbus Detroit Grand Rapids Indianapolis Time in Transit Reliability Infrastructure/Bus. Environment 56
57 Office Furniture Cost Quality Tradeoff COST MODEL Chicago Columbus Detroit Grand Rapids Indianapolis Shipping cost (Rotterdam) $ 50,505 $ 49,434 $ 49,434 $ 57,309 $ 57,855 Shipping cost (outbound within 500 mi) $ 5,970 $ 9,310 $ 8,463 $ 5,682 $ 7,752 Shipping cost (outbound beyond 500 mi) $ 47,173 $ 34,536 $ 39,783 $ 49,437 $ 38,172 FTL 250 miles /return empty $ 4,856 $ 4,710 $ 4,592 $ 4,701 $ 4,817 TOTAL $ 108,504 $ 97,990 $ 102,272 $ 117,130 $ 108,596 Weekly profile shipping costs Cost vs Quality Qualitative Score Cost Score (100 = Avg.) Chicago Columbus Detroit Grand Rapids Indianapolis Circle sizes indicate location total freight volume 57
58 Medical Devices Profile Description Mode Volume - Inbound air freight of diagnostic medical devices Air belly 1 container / wk - Receipt of instruments for repair FedEx 10 x 50 lbs / wk - Return of repaired instruments FedEx 10 x 50 lbs / wk CATEGORY Weight Time in Transit 45% Air cargo time from Singapore 20% Latest FedEx collection time 70% Number of flights from Singapore/wk 10% 100% Reliability 35% Number of air cargo transhipments 15% Red flags (bridges, choke points) 10% Labor relations 10% Weather risk 35% Airport arrival cancellations % 30% 100% Infrastructure/Bus. Environment 20% Availability of warehouse space 15% Taxes 15% Free trade zone regulations 10% Air cargo infrastructure 40% Air transportation ind. presence 10% Logisticians quotient 10% 100% (9 = best) Qualitative Ranking Chicago Columbus Detroit Grand Rapids Indianapolis Time in Transit Reliability Infrastructure/Bus. Environment 58
59 Medical Devices Cost Quality Tradeoff Chicago Columbus Detroit Grand Rapids Indianapolis COST MODEL Chicago Columbus Detroit Grand Rapids Indianapolis Air cargo cost from Singapore $ 10,775 $ 11,061 $ 11,061 $ 10,917 $ 11,045 Fed Ex shipping cost to Memphis $ 3,604 $ 3,198 $ 3,198 $ 2,940 $ 2,940 $ - $ - $ - $ - $ - TOTAL $ 14,379 $ 14,259 $ 14,259 $ 13,857 $ 13,985 Weekly profile shipping costs Cost vs Quality Qualitative Score Cost Score (100 = Avg.) Chicago Columbus Detroit Grand Rapids Indianapolis Circle sizes indicate location total freight volume 59
60 Competitive Positioning Findings The Automotive profile supply chain example involves shipments to several U.S. locations and to Toronto by rail. With the investment capital and inventory involved, reliability is more heavily weighted. Detroit has a strong competitive position with costs in the mid range of the 5 locations benchmarked and a high qualitative score. Indianapolis, however, is the one location with a lower cost calculation and higher quality rating. Grand Rapids trails in both qualitative and quantitative measures. Chicago has lower costs in this profile than Detroit but a lower qualitative score. In the Consumer Goods profile the inbound supply chain includes fresh produce arriving via ship and distribution within a local radius of 250 miles. Road infrastructure and the presence of trucking industry and warehousing are important factors in evaluating this profile. Because product is distributed locally in each location, supply chain costs are relatively flat. Indianapolis exhibits the highest qualitative score followed by Detroit. Grand Rapids is relatively high cost and has a qualitative score that marginally exceeds Chicago. In the Office Furniture / Systems profile raw materials are obtained within the region and finished product distributed both throughout the US by truck and overseas by ship. Customers are assumed to have tight delivery schedules and thus reliability is a key category. Infrastructure also has a relatively high weight in this qualitative model and Michigan scores well for the concentration of the furniture industry cluster. Detroit offers a good trade off of cost and quality. Only lower quality Columbus has a lower cost, whereas more expensive Grand Rapids and Indianapolis have higher qualitative rankings. Chicago has below average cost for this profile and a poor qualitative score. In the Medical Devices profile, time in transit is the highest weighted category. This supply chain is driven by air freight both inbound and outbound, and air freight last pick-up times. Airport delays are important sub-factors. Costs in this scenario are also fairly even and the smaller airport hubs of Indianapolis and Columbus have the higher qualitative score. Chicago and Detroit have basically the same competitive positions, whereas smaller Grand Rapids trails the other locations for qualitative score. 60
61 Dashboard Qualitative Category Scores (Scored 1-9, 9=best) Automotive Chicago Columbus Detroit Grand Rapids Indianapolis Time in Transit Reliability Infrastructure Consumer Goods Chicago Columbus Detroit Grand Rapids Indianapolis Time in Transit Reliability Infrastructure Office Furniture /Systems Chicago Columbus Detroit Grand Rapids Indianapolis Time in Transit Reliability Infrastructure Medical Devices Chicago Columbus Detroit Grand Rapids Indianapolis Time in Transit Reliability Infrastructure
62 Competitive Benchmarking - Industry Observations An objective but high-level overview of Michigan s competitive position in logistics relative to the selected cities suggests several areas of strengths and several concerns. Automotive Detroit has an expected legacy qualitative advantage over Chicago - at a slightly higher cost. Indianapolis seems to have a slightly better qualitative offer at a substantially lower cost, especially in distribution to the South and West. Cautions > Indianapolis is well positioned to erode SE MI s logistics market share. > Canada & Europe are better markets for MI > Domestic production shifts to south and west continue to be a challenge Consumer Products (Food as example) Each competitor region analyzed has a similar overall cost structure, with Detroit slightly lower than Chicago Indianapolis has a much higher qualitative offer at only slightly higher cost. Chicago suffers in reliability but surpasses Detroit in overall infrastructure. Considering tradeoffs across all factors and costs, all areas appear to evenly positioned in this food oriented scenario. 62
63 Competitive Benchmarking Industry Observations Furniture / Office Systems Grand Rapids strong legacy position is matched by Indianapolis in logistics qualitative factors but at significantly higher cost Columbus surpasses both and approaches a comparatively ideal position. Caution Columbus appears to have a strong competitive position and could threaten Grand Rapids legacy dominance Medical Devices This limited surrogate for the high tech sector suggests that all competitive areas have similar overall cost structures Both Indianapolis and Columbus demonstrate somewhat better qualitative positioning in logistics Concern Neither Michigan location appears to have a compelling competitive offer in this particular technology scenario. With similar costs, Columbus and Indianapolis provide qualitative advantages 63
64 Competitive Benchmarking Looking Forward Michigan s Economy and Trends Going Forward Michigan has enough mass in terms of supply chain activity to remain an important player in logistics-enabled manufacturing and distribution Much of Michigan s industry strengths are based on its legacy dominant position in key industries such as automotive and furniture These are threatened by strong competitors, disaggregation of industrialization and cycles of mergers, acquisitions and resulting consolidations/relocations and insufficient infrastructure assets Future threat to some of the basic materials and processes that have been central to MI s economy, i.e. the growing use of composites rather than steel How might this affect Michigan s legacy logistics infrastructure, much of it based on moving steel and related manufacturing materials? Will plastics & other composites require different approaches & logistics infrastructure? Globalization and rapid expansion of foreign consumer markets, accompanied by the trend across most industries for plants closer to growing foreign markets/closer to regional supply chains drives MI companies to grow elsewhere 64
65 Recommended Focus Key Takeaways Support Existing Business Michigan must accelerate efforts to support and retain its existing industry base Promote Business Growth Create customized business strategy to grow sweet spot niche segments Identify and deliver world-class infrastructure Increase competitiveness and improve key infrastructure for connections to important global markets within the Midwest region 65

66 Suggested Actions Step 1: Business Delivery System Demonstrate investment potential from end-user perspective & expand the existing project-oriented propositions from project/owner/advocates to market-based, results-oriented business cases Develop business target plan using Competitive Positioning tool to identify specific segments, market leakage and supporting supply chains where Michigan is/can be advantaged Develop public funding/private investment cases for key infrastructure and pinpoint expanded economic development opportunity Step 2: Coordination, Delivery and Advocacy Planning, policy and delivery are currently fragmented and should be brought together in a regional (perhaps inter/intra state or bi-national) global logistics business council Appoint a logistics/trade champion with high-level business and government experience to lead implementation of business council policy and projects Role - Develop consensus, priorities & oversee delivery for planning and business strategy with private/public sector; railroads, air cargo carriers, private infrastructure investors, Michigan and economic development officials 66