Curbside Recycling Survey. Plastics and program characteristics
|
|
|
- Merryl Booker
- 5 years ago
- Views:
Transcription


1 Curbside Recycling Survey Plastics and program characteristics

2 Survey Background and Purpose Conducted July/Aug 2012 Does not include 2013 data Purpose: Develop education about changing plastic collections Evaluate curbside program characteristics
3 Part of Minnesota State Fair 300,000+ visitors annually Anticipated spike in questions about plastics in 2012 Aimed to provide specific direction to recyclers Eco Experience


4 Usually
5
.")
6 Who took the survey? The survey was sent to recycling coordinators via CISRR, SWA and RAM list serves. 180 survey responses detailed information for 340 cities in Minnesota. The 340 cities have a combined 2011population of 3,531,742 residents (66% of MN population). 46 of the 50 most populous cities responded to the survey and 81 of the 100 most populous responded.


 City Service - Contract 200")
7 Collection Characteristics: Contract Hauling or Subscription Service Subscription Contract Service City of Minneapolis 39.76% 60.24% Number Of Cities % of City Responses % of Population (within sample) City Service - Contract % 62.18% Subscription Service % 37.82%

 Source Separated 39 20.")


8 Collection Methods: Contract Cities Source Separated Dual Stream Single Stream 20.74% 12.23% 67.02% 91.33% of population Number Of Cities % of City Responses % of Population (within sample) Source Separated % 8.67% Dual Stream % 26.22% Single Stream* % 65.11% The table Only includes cities with contracts for organized recycling collection that responded to the survey question about sorting methods *Includes Minneapolis

9 Revenue Sharing 30.3% of contract cities receive a revenue share Formulas for revenue share very widely. Some examples include: 50% of net revenue 80% of revenue after processing costs (which are capped at $57.25 per ton) $350 per month or $10 per ton of fiber whichever is higher


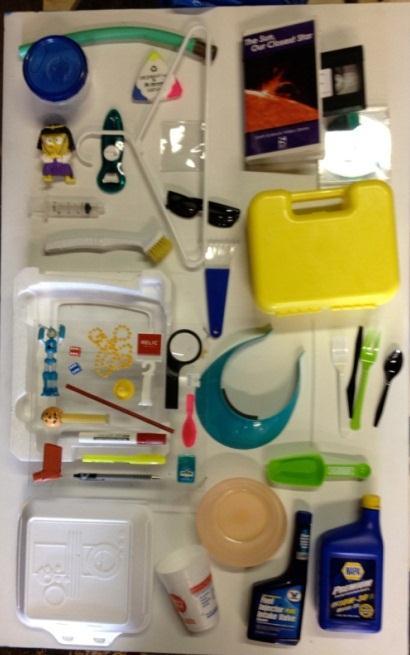
10 Plastics Collections: Bottles 100% of cities collect plastic bottles 18.5% collect only plastic bottles 87.1% of cities instruct residents not to include packages that previously included hazardous material like motor oil bottles.

11 Bottle Caps On or Off? 33.0% 35.1% 32.0% Percentage of Survey Respondents* Leave Caps ON 33.0% Take Caps OFF 35.1% Not Specified in Education Materials 32.0% * Survey data from 180 cities not weighted by population


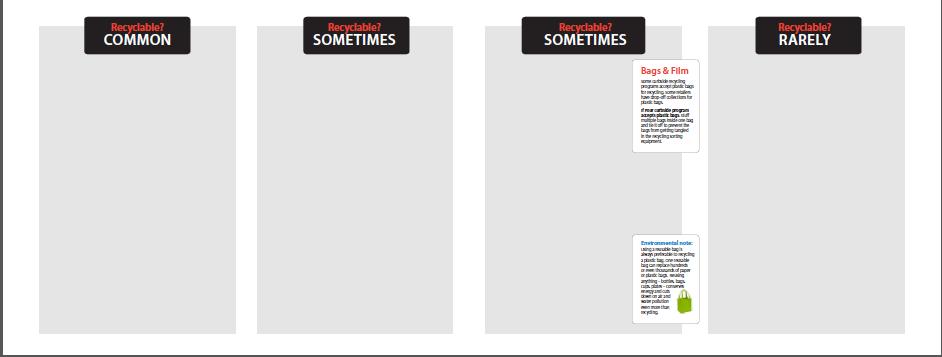
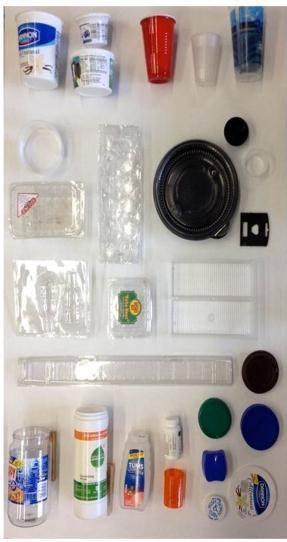
12 Plastic Recycling: Cups, Containers and Packaging 78% of cities collect cups, containers and packaging 80% of these cities do not collect all types of cups, containers and packages The term Cups, Containers and Packaging was tested on focus groups and endorsed by ARM
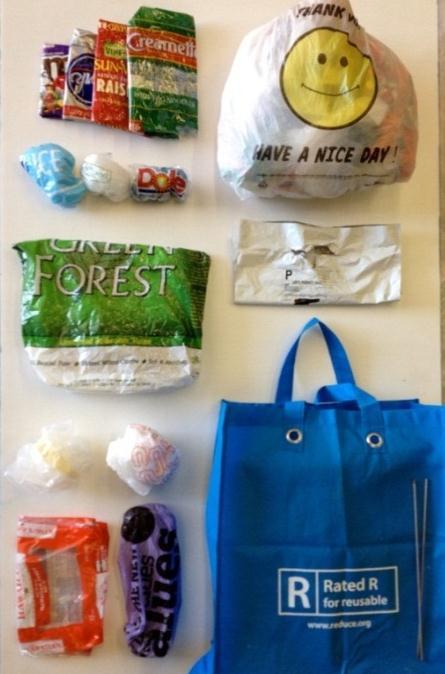
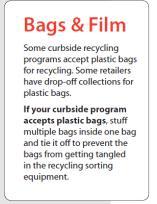
13 Plastic Recycling: Film 30% collect some or all types of plastic film curbside 79% of the population sample does not have curbside access to plastic film recycling 59.7% instructed the public not to include plastic bags and film Many retail drop-off options available Plastic bag recycling discussions are a good opportunity to discuss reuse/reduction with the public.

 #1-#6 plastics (with exceptions) #1-#7 plastics (with exceptions) #1-#7 plastics without exceptions #1, #2, #5")
14 Resin Codes 93% of cities use the RIC in their education materials 19% of cities collect all #1-#7 plastics without exception An additional 41% of cities collect #1-#7 plastics but exclude certain plastic items There are 9 different systems for collections: #1 bottles & containers only #1 & #2 Bottles Only #1 Bottles & Containers, #2 Bottles Only All #1 & #2 packages (bottles & containers) #1-#5 plastics (with exceptions) #1-#6 plastics (with exceptions) #1-#7 plastics (with exceptions) #1-#7 plastics without exceptions #1, #2, #5 and #7 plastics
 20 10.26% 2.74% #1-#6 (with exceptions) 9 4.62% 0.")
15 Collection Systems: RIC Number of Cities % of City Responses % of Population (within sample) # 1 Bottles & Containers Only % 0.10% #1  Bottles Only % 18.42% # 1 Bottles & Containers, #2 Bottles Only % 4.84% #1& #2 All container/bottle types % 5.12% #1-#5 (with exceptions) % 2.74% #1-#6 (with exceptions) % 0.46% #1-#7 (with exceptions) % 27.80% #1-# % 33.50% #1,#2,#5,# % 0.06% Doesn't Use RIC Numbers for Education % 6.95%


16 Report Findings Source Reduction Considerations Product Stewardship Considerations Uniformity of collection programs Trash hauling licenses Plastics Labeling is confusing Additional research needed: End Markets
17 Find the full report at: -- search for curbside recycling survey Or


18 2013 Survey Also asked: Trash collection: organized or subscription Recycling Collection Frequency Recycling Container Type Organics Collection Next Steps: Analyze and compile 2013 results Compare characteristics to program performance data
19 2013 Survey Responses from 165 Cities, Counties or Solid Waste Districts Accounts for over 3.6 million residents (67% of state s population) Data on next slide is draft and subject to change
20 Preliminary 2013 Results Trash Service: Collection System - Trash Service % of Cities % of Population Subscription Service 64.24% 70.73% Organized Collection 35.76% 29.27% Collection Frequency: Collection Frequency % of Cities % of Population Weekly 15.15% 16.58% Biweekly 44.24% 39.65% Monthly 1.21% 0.19% Not Reported or Subscription Service 39.39% 43.58% Container Type: Container Type % of Cities % of Population Blue Bin 11.52% 14.01% Cart 47.88% 40.60% Not Specified or Subscription 40.61% 45.39%

21 Questions or comments? Tim Farnan (651)