Operations Analysis using Simulation Modeling to Evaluate Capacity Requirements. for Direct Intermodal Rail Facilities at the Port of Long Beach
|
|
|
- Magdalen Wiggins
- 5 years ago
- Views:
Transcription
1 Operations Analysis using Simulation Modeling to Evaluate Capacity Requirements for Direct Intermodal Rail Facilities at the Port of Long Beach Beth C. Kulick Sr. Professional, TranSystems Corporation 512 Via de la Valle, Suite 310 Solana Beach, CA Words 2011 AREMA
2 ABSTRACT The Southern California area ports are the busiest in the nation and are located in one of the most congested and populated areas. The Class I railroads that service these ports have invested heavily in connecting their rail networks to this area and are committed to providing competitive and effective service for the intermodal market. The Southern California ports are improving the marine terminals and support facilities within the ports to offer increased direct intermodal service via rail. The rail activities in the port must occur efficiently to support increased container volumes and meet the needs for the railroads to move fulllength long-haul trains in this highly constrained area. The Port of Long Beach (POLB) has multiple marine terminal facilities that provide shipping services for intermodal containers. These containers are typically transported into and out of POLB by truck via local moves (less than 25 miles) or long-haul rail using on-dock or near-dock transfer facilities. The POLB has service goals to transport up about 30 percent of intermodal containers via direct intermodal or on-dock rail transfer. Simulation modeling is a key technology to determine viable design concepts and to provide a consensus building framework among the rail stakeholders in this area including BNSF, UP, and Pacific Harbor Lines. Through using simulation techniques, POLB has been able to refine concepts, determine the level of rail build-out needed to support volumes from now until INTRODUCTION The Port of Long Beach (POLB) is one of the largest US port facilities (second to the adjacent Port of Los Angeles) and has plans to accommodate increased intermodal freight volumes over the coming years. POLB is located with Southern California, where congestion and environmental issues are continual challenges; any expansion proposals within this busy port area are subject to intense public and environmental scrutiny. For import containers that are leaving Southern California to transcontinental destinations, direct intermodal transfer via on-dock rail offers significant environmental benefits. On-dock rail dramatically reduces the number of truck trips (local drays) needed to move these containers to regional or near-dock intermodal container transfer facilities in East Los Angeles. The reduction of these local and regional truck trips removes congestion within regional highway corridors, reduces truck queue 2011 AREMA

3 lines at terminal access gates, and shortens the shipment time to get containers to their ultimate destination. A single container that lands at the port can easily generate multiple truck trips to and from the port including the need to reposition returning empty containers, chassis management and other factors. For this region, the ability to reduce truck trips has enormous air quality benefits. Figure 1: Port of Long Beach Pier G Because of the numerous advantages, the Port s goal is to divert as much long-haul intermodal traffic to ondock rail as possible. Most of the POLB marine terminals already contain working tracks to support ondock transfer of containers. The current port infrastructure to support rail operations such as car storage, inspection of trains, brake air-testing to prepare for long-haul departures, limits the amount of traffic moved by on-dock rail today. The challenge for POLB is to update the infrastructure to support these needs while working within the severe land and site layout constraints. PROJECT BACKGROUND The POLB Rail Master Planning effort, completed in 2006, identified the need for providing a central rail support yard. The proposed area for this project is the current Pier B site where there currently is a small rail yard with short tracks and limited usability. A key issue with the current infrastructure is the lack of ability to arrive or depart a full length train that may be 10,000 feet or longer. Full length trains do currently arrive and depart from POLB, but this often occurs on port-area main tracks. The objective of the Pier B railyard (PBY) is to provide the infrastructure for rail support activities to keep the on-dock throughput of the marine terminals at its target or maximum potential AREMA
4 At the start of this study, POLB initiated the development of design concepts that can be built in this area. Not surprisingly, the site has a number of physical constraints that limit the size and design of the proposed rail yard. These include the adjacent I-710 highway corridor, the Dominguez channel, the Alameda Corridor, as well as surface streets and residential neighborhoods. Figure 2: Project Site for Pier B Yard A key design objective for the new rail yard is to build 10,000 foot tracks to receive and depart intermodal trains and the Pier B site constraints limit the number of long tracks that can be built. POLB developed dozens of yard concepts that can potentially fit into this area these ranged from yards dedicated to 100% rail support to those that also include a mini intermodal lifting yard. Simulation modeling was used as a method to determine what should be built at Pier B yard to support direct intermodal volume and operating requirements. Previous modeling efforts had been conducted to support POLB Rail Master Planning analysis. These models had used tools that mostly focused on main-line capacity analysis and had challenges in analyzing the relationship between intermodal volumes and needed rail support infrastructure that includes number of arrival arrival/departure and storage tracks. The rail support requirements at the POLB are more closely aligned with a terminal environment than that of a main line system AREMA
5 The modeling effort that was used for this study leveraged the modeling team s previous experience with terminal modeling studies. This included the representation of the operating environment at POLB including the relationship between shippers and rail operations and included volume, policy, and process variables to quantify infrastructure requirements. Because of the highly constrained project site, the model also included the ability to explore trade-offs between operating practices and infrastructure requirements. This became important to demonstrate to stakeholders how operating assumptions can impact performance and increase infrastructure or reduce the ability to meet on-dock volume targets. This became part of the consensus building process for this project. Figure 3: Transportation Modeling Studio User Interface 2011 AREMA

6 SCOPE AND OBJECTIVES OF MODEL For the Pier B project, the engineering team provided concepts of what can be built based on general objectives and the constraints of the planned site. The modeling team was tasked with determining what should be built based on target on-dock volumes, needed rail support processes, and to maintain efficient on-dock operations within the marine terminals. MODELING / ANALYSIS TEAM What should be built? Volumes and Demand Business Environment Operating Rules and Practices Environmental and Process Variability Technology Recommendations ENGINEERING TEAM What can be built? Area Constraints Design Objectives Compliance with Standards Figure 4: Model Integration with Design Process To accomplish this, a POLB-wide systems level model was created to quantify the capacity requirements of the Pier B Yard as it interchanges trains and cars between Transcontinental rail (UP and BNSF) and marine terminal operators. The systems level representation includes BNSF and UP schedules, vessel schedules, and on-dock rail working track productivity rates. Figure 5: Study Area for POLB Pier B Yard Modeling 2011 AREMA
7 POLB On- Dock Terminal: Med Shipping Non Intermodal Traffic Bare Tables POLB On- Dock Terminal: PCT POLB Pier B Rail Support Yard Westbound Trains Eastbound Trains POLB On- Dock Terminal: ITS POLB On- Dock Terminal: LBCT POLB On- Dock Terminal: Pier T (TTI) Figure 6: Schematic of Systems Orientation of Modeling The focus of the modeling is the relationship between marine terminal direct intermodal throughput and rail support requirements. For the marine terminals, the modeling included the activities associated with lifting containers on terminal working tracks. The model was able to determine the lifting time lost due to insufficient rail support to remove loaded rail cars ready to depart or the timely delivery of cars to be unloaded and/or reloaded with import containers. To support the Class 1 rail operations, the model included the status of the marine terminals to determine the likelihood that inbound (westbound) trains could directly arrive versus need to use one of the Pier B Yard proposed arrival tracks. The model included the ability to vary the arrival and departure tracks and storage tracks to determine the quantity needed to maintain desired rail operations to efficiently arrive and depart full length long-haul trains. In the proposed new Pier B Yard, the main tracks no longer will be used as tracks to arrive and depart trains; however, they are included in the model to determine how many double track sections are necessary to ensure that the port area network does not become a constraining factor AREMA
8 For network representation, the Pier B Yard is considered to be located within the East Basin of POLB. It is connected to the Alameda Corridor (the dedicated connection between both Ports and the Class I main lines), and to the on-dock terminals via main and secondary track segments. The East Basin network contains about 5 miles of track. A schematic of how POLB is broken down into the various track segments is provided in the following figure: Crucero Diamond (1 Move) Alameda Corridor Manuel Yard Main, LBJ-PBY (2 Moves) Pier B Yard A-B Tracks (2 Moves) Crossover Pier A Med (1 Move) Main, 9 th St. to x-over (2 Moves) Main, x-over to ITS (2 Moves) Main, ITS to Switch 38 (1 Move) Port of Los Angeles LBCT Main, Switch 38 to PCT (2 Moves) ITS PCT Figure 7: Port of Long Beach Area Track Network 2011 AREMA
9 There are a number of operators that will need to use the East basin rail infrastructure and the proposed Pier B Yard, including the marine terminal operators, the Class I railroads (BNSF Railway, UP Railroad), and Pacific Harbor Lines (PHL the rail operator that switches all the terminals). To build a system-level model, it was important to understand how the various operators would use Pier B Yard to maintain efficient lifting operations once it is built. To accomplish this, the project team conducted a series of on site surveys and interviews with each of these operators. The goal was to understand each of their operating environments and to determine if there are functions that the new Pier B Yard could provide to promote increased intermodal fluidity through the Port area. These surveys provided some valuable information for the modeling. It was learned that each marine terminal has some unique internal operating challenges because of their location at the Port and the internal layout of their yards. The model included these constraints to assess overall POLB on-dock throughput. Also, noted were the difficulties associated with rail equipment management by the railroads. Specifically, the normal backhaul percentage of empty containers to the port is about 80 to 90%. This necessitates the separate movement and storage of bare rail equipment to maintain a balanced operation. Additionally, the safety requirements of the marine terminals were reviewed to include and understand how certain rules need to be enforced and potentially impact the on-dock capacity. IMPLEMENTATION APPROACH The modeling effort worked closely with the Pier B engineering team and developed a modeling plan to support the design and engineering process of this major project. The modeling team was involved through the various stages of the design process and a building block approach provides the ability to add more detail to the model as the design process evolved: Stage 1: Determine the size of Pier B Yard (quantity of receiving & departure tracks, and storage tracks) needed to support on-dock volume targets. This stage of modeling is intended to be a rapid assessment of Pier B Yard size requirements to filter the type of concepts that could be built AREMA

10 ????? Figure 8: Determining which Design Concepts are Viable Alternatives Stage 2: A constrained Pier B Yard model that allows for the refined list of design concepts to be further analyzed. This effort builds upon Stage 1 and provides the capability to quantify on-dock throughput when considering infrastructure and operating tradeoffs. A list of default and variable operating assumptions was compiled and also tested during the analysis process to understand trade-offs of operating practices and infrastructure requirements. The space availability and level of investment for this facility needs to be analyzed considering different operating variables and is key in determining the recommended build-outs. The goal of this stage of modeling is to determine what level of infrastructure is needed to support volume year forecasts. This modeling supported the build-out recommendations and level of investment for POLB. Stage 3: Based on the chosen build-out option, this is a Proof of Engineering model that is a virtual prototype of the final layout in actual operation. This model can demonstrate the capabilities of the yard as well as provide a mechanism to fine tune the design in terms of lead design, crossovers, and other layout details. A fully animated representation of the layout with train movements is planned AREMA

11 Figure 9: Stage 3 Modeling and Level of Animation Example CONCLUSIONS The Stage 1 and 2 modeling efforts have been completed for this project. The Stage 1 sizing analysis determined the amount of rail infrastructure needed to support on-dock volume targets. It was quickly determined that all space within the proposed site would be needed to build-out facilities to support ondock volumes and that there are challenges associated with providing the needed number of long arrival and departure tracks. Alternate concepts considering the integration of mini intermodal lifting yard, etc. were determined to not be feasible without sacrificing volume goals. The outcome of Stage 1 of determined that to support the volumes, there is only space available for a dedicated on-dock rail support facility AREMA
12 Tracks A/D Track usage details 12 6 M edian # tracks Average # tracks 90th percentile # tracks M ax # tracks volume 2020 volume 2015 volume 2010 volume 2008 base Scenario Figure 10: Stage 1 Results that Report Quantity of 10,000 Foot Tracks needed per Design Year During Stage 2, more operating detail and constraining factors were added to the model developed during Stage 1 to get a more specific indication of the level of build-out needed under varying conditions. The ability to adjust volumes was a focus to determine what level of build out is needed for particular projected years. Each scenario was run considering the following goal: Did the configuration of Pier B Yard successfully accommodate the target on-dock volume required for that scenario? A key part of answering this question was reviewing the model outputs to determine if the POLB system provided a sustainable operation for that volume. Model runs that displayed results where one or more marine terminals showed unstable build ups of containers were not considered sustainable operations and the volumes needed to be reduced. The model run time to get results for this POLB model is only seconds. During Stage 2, this allowed for iterations and sensitivity analysis to be performed while considering variations in operating assumptions. Analysis was also conducted to determine the maximum potential on-dock capacity that could be achieved for partial or full build-outs. A partial summary of the results are provided below AREMA
13 If Pier B Yard is not built, the 2035 Target Intermodal % of Volumes are not nearly achievable. The following results table compares the achievable volume with the target volumes. Case : 2035 Volumes, No Pier B Yard Build On-dock Working Track Length (DS cars) On-dock Storage Track Length (DS cars) Forecast Marine Terminal Throughput Target Intermodal % of (TEU/yr) volume Intermodal % Volume Achieved Intermodal TEU/yr Achieved Terminal Pier J / PCT ,240,000 35% 15% 636,000 Pier G / ITS ,229,000 19% 8% 258,320 MHT / LBCT ,320,000 32% 19% 630,800 Pier A / Med ,181,000 35% 21% 668,010 Pier S ,800,000 27% 8% 144,000 Pier T ( RSU/Not modeled) ,422,000 29% 29% 1,290,000 Pier C (RSU/Not modeled) 582,000 POLB Total 20,774,000 17% 3,627,130 Current POLB Rail Support Facilities, but only allow inspection on 1 of the mains below 9th St. On Dock Terminal Operations: 3 Shifts,Free Access to Terminals ` Table 1: Stage 2 No Build Results If Pier B Yard is fully built-out, the 2035 targets for each marine terminal are all achievable: Case: 2035 Volumes, Full Build of PBY On-dock Working Track Length (DS cars) On-dock Storage Track Length (DS cars) Forecast Marine Terminal Throughput Target Intermodal % of (TEU/yr) volume Intermodal % Volume Achieved Intermodal TEU/yr Achieved Terminal Pier J / PCT ,240,000 35% 35% 1,480,000 Pier G / ITS ,229,000 19% 19% 610,000 MHT / LBCT ,320,000 32% 32% 1,050,000 Pier A / Med ,181,000 35% 35% 1,110,000 Pier S ,800,000 27% 27% 480,000 Pier T ( RSU/Not modeled) ,422,000 29% 29% 1,290,000 Pier C (RSU/Not modeled) 582,000 POLB Total 20,774,000 29% 6,020,000 Pier B Yard Configuration: 5 A/D Tracks, 32 Storage Tracks On Dock Terminal Operations: 3 Shifts,Free Access to Terminals ` Table 2: Stage 2 Full Build Results The Stage 3 modeling has not yet been implemented. Once further decisions are made regarding the design of Pier B Yard, the modeling team will update the Stage 2 model and perform a detailed Proof of Engineering analysis that can assist the design team with determining track layout details and integration into existing rail infrastructure. A full animation with explicit train movement detail will be a part of this process AREMA
14 Beth C. Kulick Sr. Professional TranSystems, Corporation 2011 ANNUAL CONFERENCE

15 2011 ANNUAL CONFERENCE

16 Environmental Documents 2011 ANNUAL CONFERENCE
17 About 50% of containers through POLB/San Pedro Bay leave the Southern California region. Generally, containers that move > 500 miles are candidates for long-haul rail transport. Rail provides environmental benefits: Long Haul Rail Transport Most direct = On-dock terminals Port truck dray = Near dock terminal (UP ICTF) Regional truck dray (about 20 miles) = Off dock terminals (East LA) Challenge: Limited space for rail loading at terminals Mixed terminal inbound trains Assembly of 10,000 foot mixed trains Assembly and departure testing for outbound trains 60 to 80% backhauls extra rail equipment Marine terminal labor and safety ANNUAL CONFERENCE 4
18 About $ 1 Billion in an overall port rail capacity plan. Numerous port area main track infrastructure capacity enhancements identified and in progress. On Dock Rail Support Yard $800 M) Provide rail support for East Basin (5) on-dock terminals. Long (up to 10,000 foot) arrival and departure tracks Storage tracks for inbound cars, outbound cars and bare tables ANNUAL CONFERENCE

19 MODELING / ANALYSIS TEAM What should be built? Volumes and Demand Business Environment Operating Rules and Practices Environmental and Process Variability Technology Recommendations ENGINEERING TEAM What can be built? Area Constraints Design Objectives Compliance with Standards 2011 ANNUAL CONFERENCE
20 Determine the size of Pier B Yard Quantity of A&D (10,000 tracks). Quantity of storage tracks needed.????? 2011 ANNUAL CONFERENCE 7
21 2011 ANNUAL CONFERENCE 8
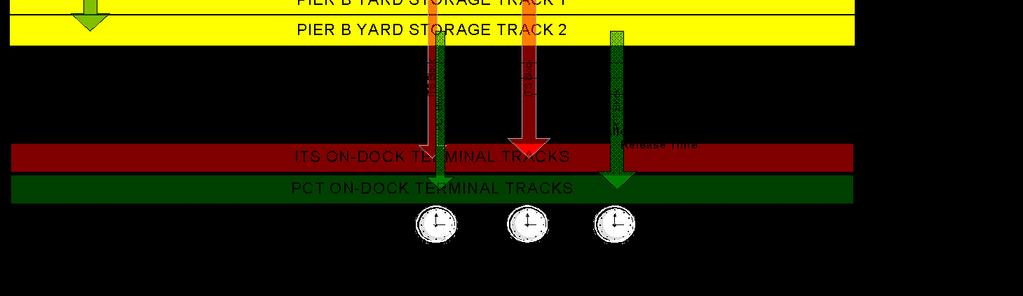
22 PBY will provide necessary rail support functions: A&D tracks sufficient for 10,000 trains Ability to perform departure air test in a rail yard rather than on East Basin main tracks. Sufficient rail storage to synchronize trains with ondock terminal capacity: Storage of blocks waiting for on-dock terminal capacity. Bare table management Storage of bare tables for delivery to terminals ANNUAL CONFERENCE 9

 containers within on-dock terminals.")
23 Primary Goal Assumption: Get all targeted On-Dock rail volumes moved through POLB East Basin Provide a sustainable environment -- avoid build up of on-dock rail candidate (about 35%) containers within on-dock terminals ANNUAL CONFERENCE 10


24 2011 ANNUAL CONFERENCE 11

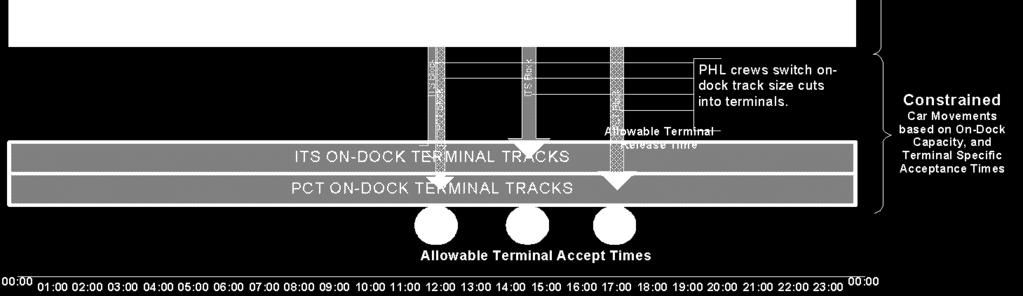
25 Limit to quantity of cars in East Basin system PBY: A&D tracks PBY: Storage tracks ODT Tracks Too many cars in East Basin can result in: Westbound volume can block Eastbound volume which blocks Westbound Gridlock 2011 ANNUAL CONFERENCE 12

26 2011 ANNUAL CONFERENCE 13

27 2011 ANNUAL CONFERENCE 14
 Percent of")
28 Eastbound containers CY based on either vessel arrivals or initial weekly inventory level. Lift productivity rate: Based on observed lift rates from on-dock terminal visits Rate per gang per shift One gang per track group Shift schedule for loading/unloading (typically 2 shifts) Percent of containers by on-dock rail : 35% (set per terminal) Quantity of groups per terminal and tracks per group ANNUAL CONFERENCE 15
29 Case Able to Process all On Dock Volume? Total WB delay (2 weeks) Total EB delay (2 weeks) Avg. storage tracks occupied Comments 2030 base case Yes 00:47 hh:mm 07:00 hh:mm 27.5 Terminal tracks stub ended (WB must land at PBY Yes 52:13 hh:mm 08:30 hh:mm for runaround) WB Direct to terminal storage not allowed Yes 28:07 hh:mm 06:36 hh:mm Inspect WB trains at PBY Yes 98:08 hh:mm 11:54 mm:hh % reduction in terminal storage Yes 13:16 hh:mm 02:55 hh:mm UP trains can depart as stubs as short as 1,000 Yes 00:00 hh:mm 18:24 hh:mm , 3 Air in PBY storage tracks (& shorter depart test) Yes 05:19 hh:mm 08:00 hh:mm 28.8 All WB trains have cars for multiple terminals No 3,318:04 hh:mm 69:18 hh:mm 36.3 Half of WB trains have cars for multiple terminals No 307:24 hh:mm 28:45 hh:mm 33.9 Class Is share all bare tables Yes 00:00 hh:mm 00:32 hh:mm % backhaul ratio Yes 03:26 hh:mm 07:12 hh:mm 27.8 Constrained accept and release times at terms No 317:56 hh:mm 01:44 hh:mm 34.6 Constrain accept/release, lower on dock volume See comment 60:35 hh:mm 09:48 hh:mm Two shift lift, lower on dock volume See comment 25:18 hh:mm 00:50 hh:mm Added some POLA (TI) cross traffic (2-5 / day) Marginal 05:10 hh:mm 05:12 hh:mm with 6 A/D tracks Yes 01:21 hh:mm 11:33 hh:mm with 5 A/D tracks Yes 05:18 hh:mm 25:12 hh:mm mixed scenario (share BT, x-traf, 2 lead, 6 AD, air in storage) Yes 00:00 hh:mm 09:00 hh:mm ANNUAL CONFERENCE


30 2011 ANNUAL CONFERENCE


31 2011 ANNUAL CONFERENCE
32 For a System of Systems environment: Cooperation becomes more important Management of individual system entity internal objectives Cooperation can mean: Dynamic sharing of Pier B Yard tracks based on need.rather than fixed assignment by Class I rail operators. Marine terminals need to allow trains to come in and out when ready. Benefits of sharing common resources such as bare tables ANNUAL CONFERENCE
33 2011 ANNUAL CONFERENCE