COAL AND COAL TRANSPORTATION
|
|
|
- Homer Hood
- 5 years ago
- Views:
Transcription
1 COAL AND COAL TRANSPORTATION December 9, 2014 Tom Canter Executive Director National Coal Transportation Association Fargo, North Dakota
2
3 DISCLAIMER The Views Expressed are Personal and do not Necessarily Reflect the Views or Approval of the NCTA Board of Directors or the NCTA Membership.
4 YOGI S OUTLINE FOR THIS PRESENTATION

5


6


7

8
9 BNSF Train Speed Intermodal Grain Unit Coal Unit Crude Oil Unit Ethanol Unit Manifest All Other Automotive Unit 9502 Moores Creek Drive Suite 304 Fredericksburg, VA phone (540)
10 UP Train Speed Intermodal Grain Unit Coal Unit Crude Oil Unit Ethanol Unit Manifest All Other Automotive Unit 9502 Moores Creek Drive Suite 304 Fredericksburg, VA phone (540)
11 CSX Train Speed Intermodal Grain Unit Coal Unit Crude Oil Unit Ethanol Unit Manifest All Other Automotive Unit 9502 Moores Creek Drive Suite 304 Fredericksburg, VA phone (540)
12 NS Train Speed Intermodal Grain Unit Coal Unit Crude Oil Unit Ethanol Unit Manifest All Other Automotive Unit 9502 Moores Creek Drive Suite 304 Fredericksburg, VA phone (540)
13 22-Oct 29-Oct 5-Nov 12-Nov 19-Nov 26-Nov 3-Dec Total Cars On Line by Car Type - BNSF Box Covered Hopper Gondola Multilevel Auto Open Top Hopper Tank Other Intermodal 9502 Moores Creek Drive Suite 304 Fredericksburg, VA phone (540)
14 22-Oct 29-Oct 5-Nov 12-Nov 19-Nov 26-Nov 3-Dec Total Cars On Line by Car Type - UP 77,000 67,000 57,000 47,000 37,000 27,000 17,000 7,000 Box Covered Hopper Gondola Multilevel Auto Open Top Hopper Tank Other Intermodal 9502 Moores Creek Drive Suite 304 Fredericksburg, VA phone (540)
15 Average Dwell (Hours) at Origin For Unit Trains - BNSF Grain Coal Automotive Ethanol All Other Crude Oil 9502 Moores Creek Drive Suite 304 Fredericksburg, VA phone (540)
16 Average Dwell (Hours) at Origin For Unit Trains - UP Grain Coal Automotive Ethanol All Other Crude Oil 9502 Moores Creek Drive Suite 304 Fredericksburg, VA phone (540)
17 22-Oct 29-Oct 5-Nov 12-Nov 19-Nov 26-Nov 3-Dec Total Number of Trains Held Short of Destination or Interchange for Longer than 6 Hours BNSF -Crews Intermodal Grain Unit Coal Unit Crude Oil Unit Ethanol Unit Other Unit All Other Automotive Unit 9502 Moores Creek Drive Suite 304 Fredericksburg, VA phone (540)
18 Total Number of Trains Held Short of Destination or Interchange for Longer than 6 Hours BNSF Locomotive Power Intermodal Grain Unit Coal Unit Crude Oil Unit Ethanol Unit Other Unit All Other Automotive Unit 9502 Moores Creek Drive Suite 304 Fredericksburg, VA phone (540)
19 Total Number of Trains Held Short of Destination or Interchange for Longer than 6 Hours BNSF Track Maintenance Intermodal Grain Unit Coal Unit Crude Oil Unit Ethanol Unit Other Unit All Other Automotive Unit 9502 Moores Creek Drive Suite 304 Fredericksburg, VA phone (540)
20 Total Number of Trains Held Short of Destination or Interchange for Longer than 6 Hours BNSF Mechanical Issue Intermodal Grain Unit Coal Unit Crude Oil Unit Ethanol Unit Other Unit All Other Automotive Unit 9502 Moores Creek Drive Suite 304 Fredericksburg, VA phone (540)
21 Total Number of Trains Held Short of Destination or Interchange for Longer than 6 Hours BNSF Other Intermodal Grain Unit Coal Unit Crude Oil Unit Ethanol Unit Other Unit 9502 Moores Creek Drive Suite 304 Fredericksburg, VA phone (540)
22 22-Oct 29-Oct 5-Nov 12-Nov 19-Nov 26-Nov 3-Dec Total Number of Trains Held Short of Destination or Interchange for Longer than 6 Hours BNSF Total Intermodal Grain Unit Coal Unit Crude Oil Unit Ethanol Unit Other Unit All Other Automotive Unit 9502 Moores Creek Drive Suite 304 Fredericksburg, VA phone (540)
23 Total Number of Trains Held Short of Destination or Interchange for Longer than 6 Hours UP - Crews Intermodal Grain Unit Coal Unit Crude Oil Unit Ethanol Unit Other Unit All Other Automotive Unit 9502 Moores Creek Drive Suite 304 Fredericksburg, VA phone (540)
24 Total Number of Trains Held Short of Destination or Interchange for Longer than 6 Hours UP Locomotive Power Intermodal Grain Unit Coal Unit Crude Oil Unit Ethanol Unit Other Unit All Other Automotive Unit 9502 Moores Creek Drive Suite 304 Fredericksburg, VA phone (540)
25 22-Oct 29-Oct 5-Nov 12-Nov 19-Nov 26-Nov 3-Dec Total Number of Trains Held Short of Destination or Interchange for Longer than 6 Hours UP Other Intermodal Grain Unit Coal Unit Crude Oil Unit Ethanol Unit Other Unit All Other Automotive Unit 9502 Moores Creek Drive Suite 304 Fredericksburg, VA phone (540)
26 22-Oct 29-Oct 5-Nov 12-Nov 19-Nov 26-Nov 3-Dec Total Number of Trains Held Short of Destination or Interchange for Longer than 6 Hours UP Total Intermodal Grain Unit Coal Unit Crude Oil Unit Ethanol Unit Other Unit All Other Automotive Unit 9502 Moores Creek Drive Suite 304 Fredericksburg, VA phone (540)

27
28 CURRENT STATUS: --EXTREMELY HIGH BARGE DEMAND --MUCH HIGHER THAN NORMAL RATES, EVEN FOR THE GRAIN HARVEST SEASON --SHIPPER DISPLEASURE WITH CARRIERS --RATES FOR NON-GRAIN COMMODITIES FORECASTED TO RISE BY 25-50% IN 2015.

29 EXPORT COAL: DRAMATIC DECLINE IN TOTAL SHIPMENTS THROUGH THE U. S. GULF, ALTHOUGH MOBILE IS DOING BETTER THAN THE LOWER MISS. RIVER: (MILLIONS OF METRIC TONS) 2012: 2013: 2014 (EST.): LOWER MISS. RIVER: MOBILE: TOTAL: AS SOFT AS THE DEMAND FOR EXPORT COAL IS CURRENTLY, THE HIGHER BARGE RATES BROUGHT ON BY HIGHER DEMAND MOST LIKELY WILL PRICE ANY NEW EXPORT OPPORTUNITIES OUT OF THE MARKET.
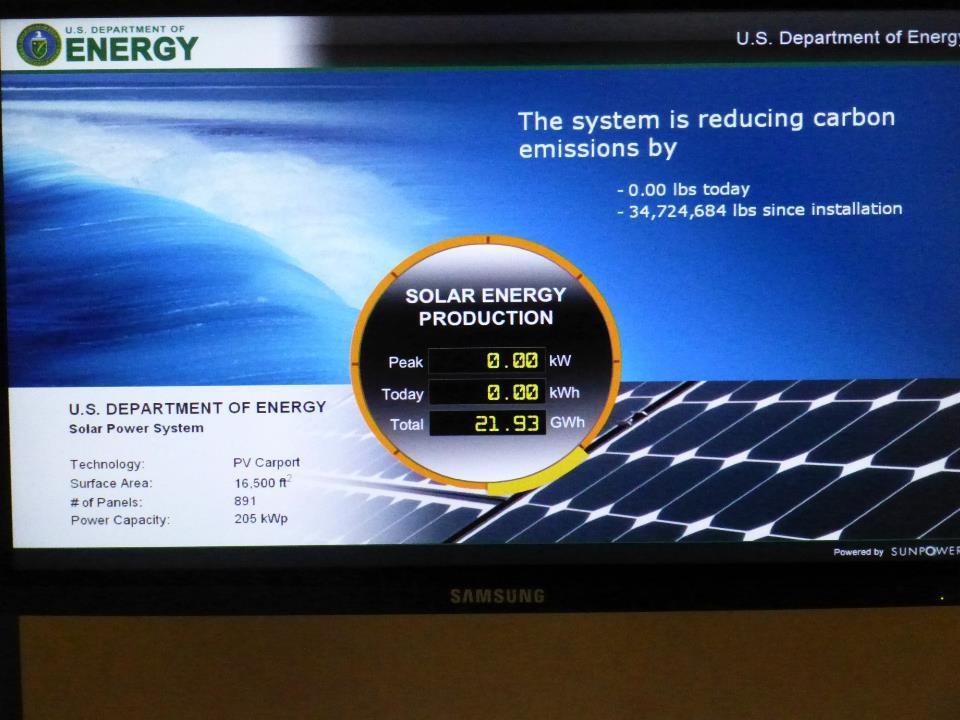
30 It looks pretty, but where is the yellow brick road policy leading us?

 Access to Improved Sources (%) Under Nourished (%) Literacy Rate (%) 25% or 90% average percent of population with access to")
31 Energy is Good People in Societies with Greater Access to Electricity: Survive Childhood Live Longer Drink Cleaner Water Eat Better Can Read % 90% 0 25% 90% 0 25% 90% 0 25% 90% 0 25% 90% Under Five Death Rate /1000 Life Expectancy (years) Access to Improved Sources (%) Under Nourished (%) Literacy Rate (%) 25% or 90% average percent of population with access to electricity 31
32
33


34
35 Figure 2.1 Energy Consumption by Sector (Quadrillion Btu) Total Consumption by End-Use Sector, Industrial Transportation Residential Commercial Total Consumption by End-Use Sector, Monthly 4 3 Transportation Industrial 2 Residential 1 Commercial 0 J F M A M J J A S O N D J F M A M J J A S O N D J F M A M J J A S O N D By Sector, August Primary Consumption Total Consumption Residential Commercial Industrial Transportation Web Page: Source: Table 2.1. Electric Power 22 U.S. Energy Information Administration / Monthly Energy Review November 2014

36 Primary Energy Consumption by Source and Sector, 2013 (Quadrillion Btu) 1 Does not include biofuels that have been blended with petroleum biofuels are included in Renewable Energy." 2 Excludes supplemental gaseous fuels. 3 Includes less than -0.1 quadrillion Btu of coal coke net imports. 4 Conventional hydroelectric power, geothermal, solar/photovoltaic, wind, and biomass. 5 Includes industrial combined-heat-and-power (CHP) and industrial electricity-only plants. 6 Includes commercial combined-heat-and-power (CHP) and commercial electricity-only plants. 7 Electricity-only and combined-heat-and-power (CHP) plants whose primary business is to sell electricity, or electricity and heat, to the public. Includes 0.2 quadrillion Btu of electricity net imports not shown under Source. Notes: Primary energy in the form that it is first accounted for in a statistical energy balance, before any transformation to secondary or tertiary forms of energy (for example, coal is used to generate electricity). Sum of components may not equal total due to independent rounding. Sources: U.S. Energy Information Administration, Monthly Energy Review (May 2014), Tables 1.3,

37 Are We Thinking?
38 WE ARE RUNNING OUT OF FOSSIL FUEL 1977 Winter bitterly cold Natural Gas Shortage PURPA OF Stanley Jevons says UK out of Coal by Dept of Interior says U.S. to run out of oil Peaking of Commodities M. King Hubbard 1968 Paul Ehrlich Predicts Mass Starvation in 1970 s
39 The Future of Electricity is Being Formed at the Global Level Billion Kilowatt Hours 1,090 USA 13,184 Rest of World Increase in Billion Kilowatt Hours
40 Much Ado About Nothing (By 2030) 40,004 40,385 World With No New Coal Generation in U.S World With Projected New Coal Generation in U.S. Million Metric Tons of CO 2 40
41 2008 Wind Hourly Output 9,000 8,000 7,000 6,000 5,000 MW 4,000 3,000 2,000 1, /1/2008 1/15/2008 1/29/2008 2/12/2008 2/26/2008 3/11/2008 3/25/2008 4/8/2008 4/22/2008 5/6/2008 5/20/2008 6/3/2008 6/17/2008 7/1/2008 7/15/2008 7/29/2008 8/12/2008 8/26/2008 9/9/2008 9/23/ /7/ /21/ /4/ /18/ /2/ /16/ /30/2008 Installed Wind Capacity Hourly Wind Output
42

43 Is It Compassionate?

44


45 Can We Support the Truth?


46 Is the Future Bright?

47