Rivers Edge Alternative Urban Areawide Review (AUAR) Traffic Study
|
|
|
- Lorena Anabel Kelly
- 5 years ago
- Views:
Transcription
1 Appendix F Rivers Edge Alternative Urban Areawide Review (AUAR) Traffic Study Prepared by Westwood Professional Services, Inc. for City of St. Paul Park Grey Cloud Island Township October 14, 2003
2
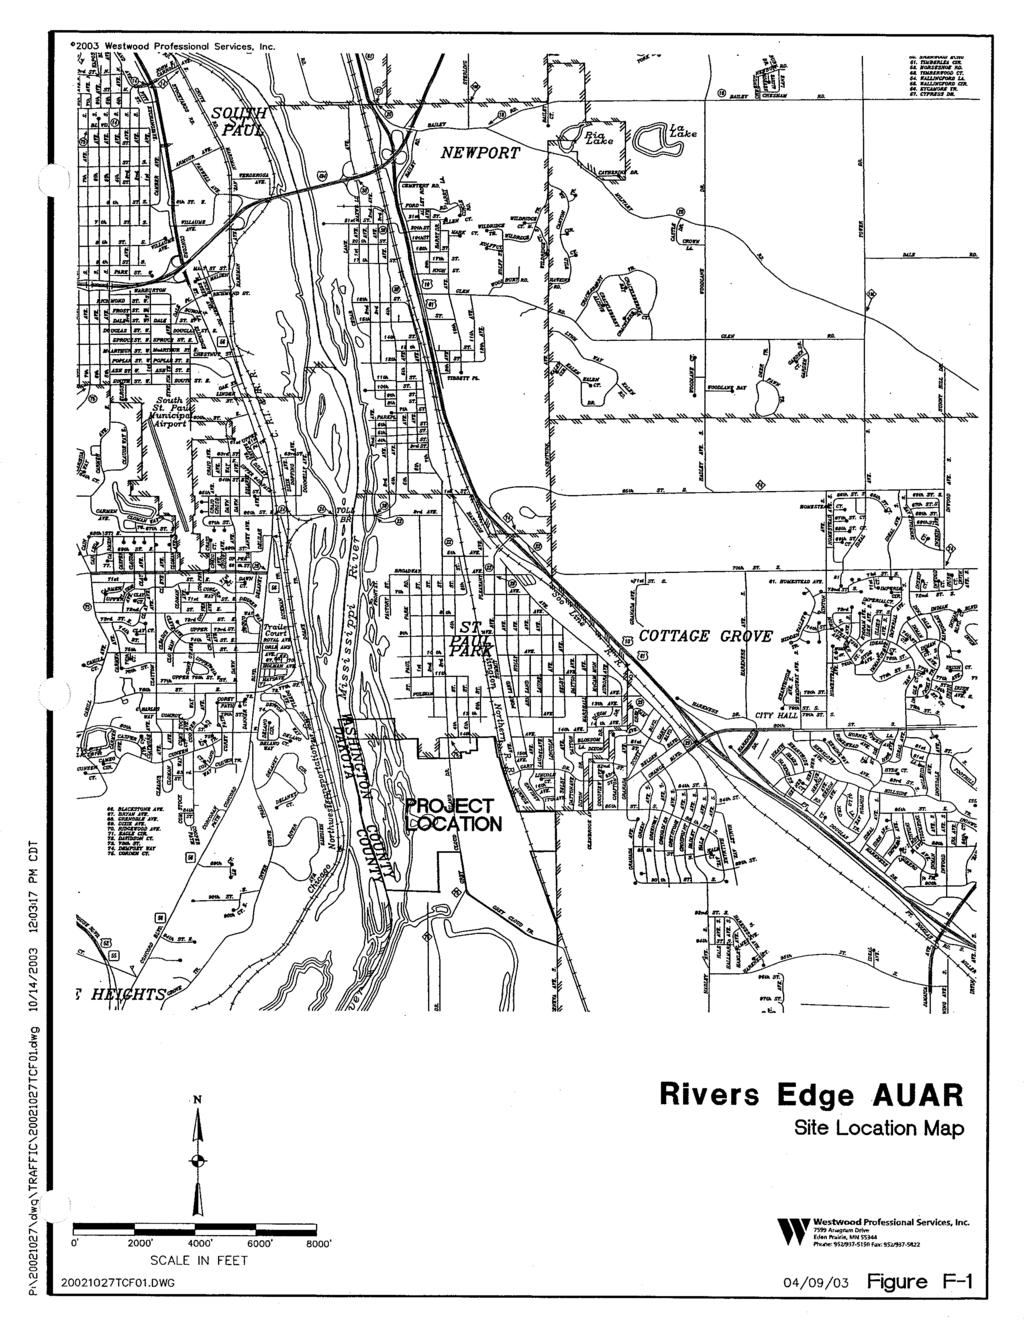
3 Introduction The purpose of this traffic analysis is to assess the traffic implications of the proposed development in the AUAR area to be located along the Mississippi River in St. Paul Park and Grey Cloud Island Township in southwestern Washington County. The site comprises approximately 667 acres. The development location is shown in Figure F-1. Under the current City and Township adopted land use plans and zoning, the site is guided for rural residential development. Presently the City and Township are pursuing annexation, comprehensive plan and ordinance updates, and master development planning which will result in the creation of development in the AUAR area. This AUAR will study impacts associated with three scenarios: Scenario 1 Scenario 2 Scenario 3 current adopted land use plans and zoning scenario with 2400 total dwelling units scenario with 1800 total dwelling units Table F-1 summarizes the land use characteristics of the three scenarios. Table F-1 Land Use Development Scenarios Scenario Scenario 1 Current Land Use Plans & Zoning Scenario Total Dwelling Units Scenario Total Dwelling Units Land Use Characteristics Single Family Housing 45 Units Mixed Residential Single Family 1,000 Units Multi Family 800 Units Village Center Multi Family Residential 400 Units Mixed Use Residential 200 Units Mixed Use Commercial / Institutional 83,000 S.F. Mixed Residential Single Family 1,000 Units Multi Family 800 Units Village Center Mixed Use Commercial / Institutional 83,000 S.F. Scenario 2 represents the overall worst case or highest intensity development (traffic generation) scenario. The traffic study and mitigation planning will focus on Scenarios 2 and 3, with less discussion of Scenario 1 due to its relatively minor addition of traffic to the roadway network. The traffic study first addresses existing conditions in the study area. It also looks at impacts caused by development in the immediate project area, in the nearby surrounding vicinity, in the external (but nearby areas) and finally, at the regional level. Figure F-2 shows the surrounding Page F-1
4 street system network that will serve and interact with traffic volumes generated from the AUAR area. Existing Conditions Traffic Volumes The proposed development site is presently undeveloped with one County road bisecting the property. The volume on this road is 2000 vehicles per day. A set of road tube counts was conducted in March 2003 to establish current daily traffic volumes on a number of important roadways around the AUAR area. Figure F-3 shows the traffic count locations and volumes. A large percentage of traffic generated from the AUAR area will access the site via Broadway Avenue and Third Street. To assess current operations at key locations along those roadways, peak period turn movement counts were conducted at the intersections of Broadway Avenue/3rd Street and Broadway Avenue/Summit Avenue in February, Figure F-4 summarizes the turn movement counts. Each of these intersections is presently controlled by all-way stop signs. An intersection level of service analysis was computed for each intersection for both peak periods using the methodologies spelled out in the Highway Capacity Manual. Table F-2 summarizes the results of the capacity analyses. As shown in Table F-2, with current traffic volumes each of these critical intersections is able to function effectively in the peak hours under the current all-way stop sign control. Broadway / 3rd Street Approach Geometry Delay in Seconds Delay in Seconds West Leg One left-thru, one right 8.3 A 9.4 A North Leg One left, one thru-right 8.5 A 10.2 B East Leg One left-thru, one right 10.9 B 10.7 B South Leg One left, one thru-right 11.1 B 9.6 A Overall Intersection 10.6 B 10.1 B Broadway / Summit Approach Geometry Table F-2 Existing Intersection Capacity Analyses A.M. Peak Hour A.M. Peak Hour Delay in Seconds Delay in Seconds West Leg One left-thru, one right 11.5 B 26.9 D North Leg One left-thru, one right 12.4 B 16.2 C East Leg One left-thru, one right 10.5 B 9.7 A South Leg One left-thru, one right 12.8 B 11.3 B Overall Intersection 11.8 B 18.6 C Note: Delay and were determined using HCM 2000 methodologies in Synchro P.M. Peak Hour P.M. Peak Hour Page F-2
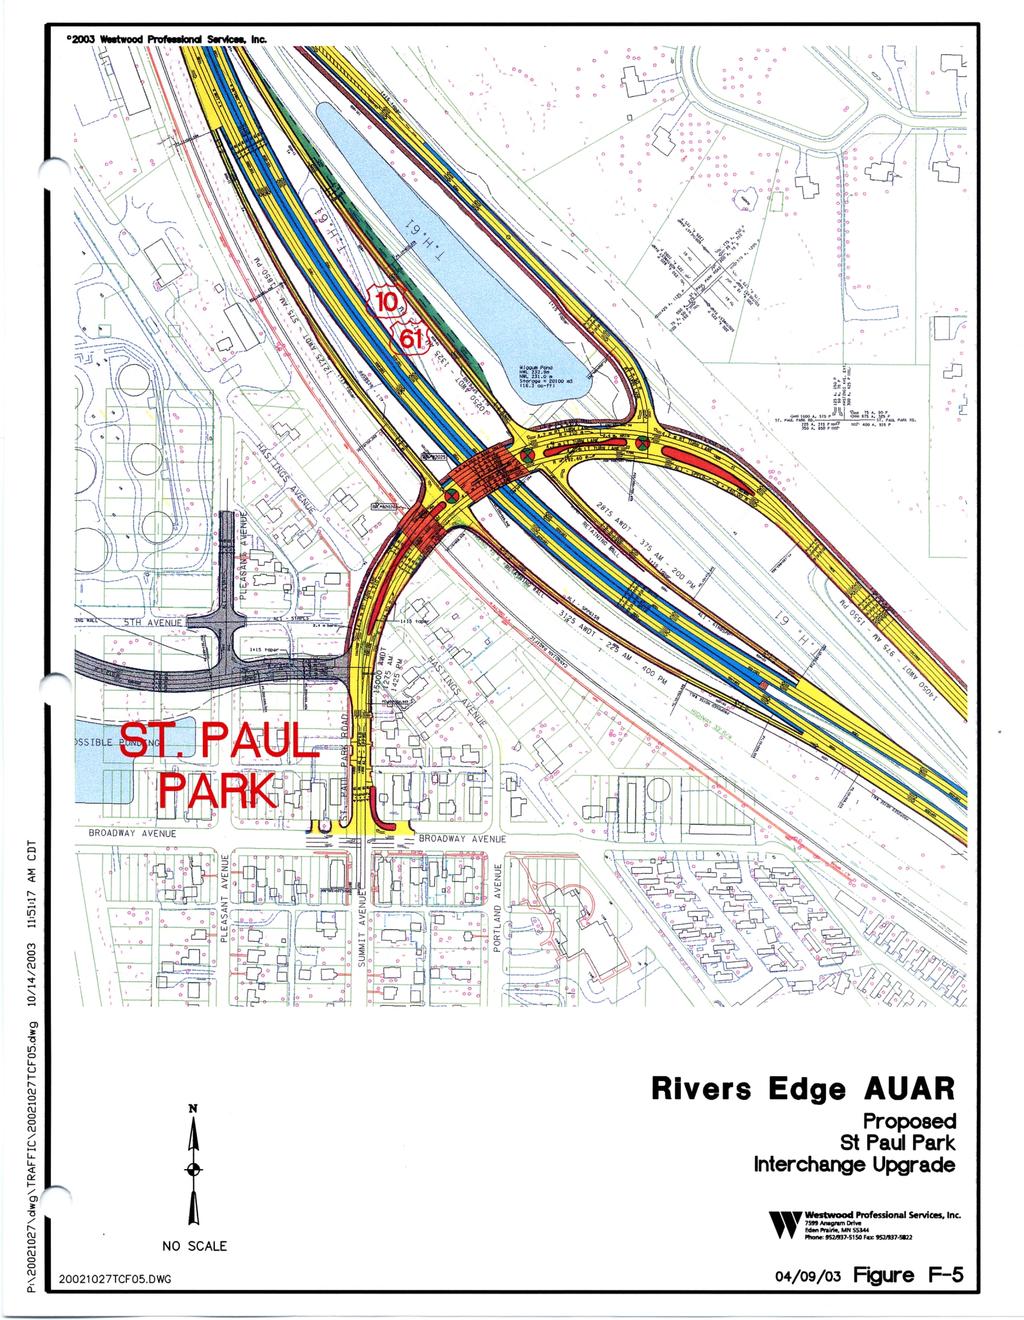
5 Changes to Roadway Network In the immediate vicinity of the AUAR area, there are no significant roadway changes or upgrades proposed, other than changes that will result on and off-site as a direct result of development of the AUAR area. However, outside of the immediate vicinity of the AUAR area, there is a project of regional significance that is presently under construction. When complete, this Mn/DOT project will upgrade T.H. 61 to freeway status, rebuild the I-494 Wakota Bridge over the Mississippi, expand I-494 and construct or upgrade interchanges along T.H. 61. At the north end of St. Paul Park this project will include a complete reconstruction and expansion of the St. Paul Park interchange. The proposed configuration of the upgraded interchange is shown on Figure F-5. The overall Mn/DOT project has a six year construction timeline ( ). The scheduled construction for the St. Paul Park interchange is As part of the interchange upgrade there will also be a realignment of local roadways to allow Marathon Ashland refinery traffic to be separated off from local traffic along Broadway, thereby enhancing the capacity and safety of Broadway Avenue. The same realignment will also serve to guide some of the touchdown of the on/off ramp traffic to 3rd Street, away from Summit Avenue. Traffic Volumes Related to the Aggregate Industries Mining Operations Aggregate Industries operates a large mining operation to the south of the project site. The majority (over 95%) of the resource volume extracted from the mines is transported off-site via barging. The mining operation is comprised of two separate pits: the northerly pit, known as the Nelson Pit, which is a sand and gravel pit and the southerly pit, known as the Larson Pit, which is a limestone pit. Table F-3 summarizes the amount and direction of truck traffic from each of the two pits over the last two years. All of the limestone material that is trucked from the site traveled to the north on County Road 75. Twenty five percent of the sand and gravel that was trucked out of the site traveled to the north on County Road 75; the majority of the sand and gravel that was trucked out was destined to locations in Cottage Grove and accessed that area via the 103rd Street crossing of the railroad tracks en route to 100th Street. The Aggregate Industries mines operate for about seven months during the course of the year, with a winter season shutdown. The Aggregate Industries mining operation is governed by a permit that limits the total extraction to one million tons per year for each pit. The same permit process limits the amount of material that can be trucked to be no more than 10% of the total resource volume. At these tonnage limits, translated into the number of trucks needed to carry this volume, each pit can legally generate no more than about 4,167 trucks over the course of an entire year (an average of about 28 trucks per working day). As shown in Table F-3 the actual truck volumes are substantially below that maximum permitted values, with no significant changes in actual volume forecasted at this time. Page F-3
6 Table F-3 Current Truck Traffic Due to Mining Operations Total Truck Traffic Pit Yearly Avg. Daily Year Volume Volume Nelson ,008 7 Larson , , Source: Aggregate Industries Volume to C.R % 25% 100% 100% Intersection Safety Concerns Within the study area there is one intersection that has experienced an unsatisfactory crash rate. The in place intersection with its skew angle and restricted sight distance has experienced four crashes over the three year period ending September 30, Over the seven-year period dating to January 1, 1997, the intersection has experienced eleven crashes. This occurs at the "Y" intersection of County Road 75 and Grey Cloud Trail. Although the volumes at this intersection are fairly modest, with the current skewed alignment and restricted sight distance, a higher than expected crash rate has been experienced for the low traffic volume levels. With development in the area and construction of new internal and access roads, this intersection will be realigned to improve the geometric layout and safety of the intersection. Analysis of Future Conditions The future conditions with development of the AUAR area in place were analyzed using a traditional multi-step traffic forecast and analysis process. The major steps in this process include: developing trip generation deriving the direction of approach assigning site generated traffic to the surrounding roadway network analyzing development-related traffic impacts establishing mitigation strategies Trip Generation The trip generation rates utilized in this study are those documented in the reference book Trip Generation, 6th edition, 1997, published by the Institute of Transportation Engineers ITE). The proposed development of the AUAR area will feature a wide variety of detached and attached housing types to meet the needs of a range of market demand housing. In addition to the residential component, the Village Center will contain a community based commercial component with its own trip generation rates derived from the ITE reference manual. For this study, all detached housing was assigned a trip generation rate suitable for a standard, typical suburban single family house. This represents a conservatively high (or worst case) assumption for the trip rate. The planning and marketing of the development of the AUAR area is expected to create a range of detached housing including products, which in other Twin Cities developments, have appealed to singles and empty-nesters. These units, with their smaller Page F-4
7 (and/or less active) families will certainly generate trips at a lesser rate than the standard ITE rate for a single family house. However, even though the planning of the development in the AUAR area anticipates such ownership characteristics, ultimately the development will not control who actually resides there. Therefore, this analysis was carried out as if all detached housing has the ownership characteristics of typical suburban single family housing. In a similar fashion, all of the attached housing outside of the Village Center was assigned the rate associated with general suburban townhouses. Again, there are expected to be attached housing products within the development of the AUAR area that specifically appeal to emptynesters and others of lower trip generating characteristics. However, to continue with the methodology of using conservatively high assumptions, all attached housing units outside of the Village Center were assigned the rate suitable for general suburban townhouse developments. Within the Village Center a composite housing unit trip generation rate was applied to represent the mix of urban townhouses and senior living facilities being planned for the Village Center. For the commercial component of the Village Center a variety of community based retail, service, institutional and office uses were identified to represent the types of uses likely to be found in this kind of Village Center concept. Table F-4 summarizes the daily, A.M. peak hour and P.M. peak hour trip rates utilized for this study. Table F-4 Trip Generation Rates Land Use I.T.E. Rate Daily A.M. Peak Hour P.M. Peak Hour Code Per Rate Rate % In % Out Rate % In % Out Single-Family Detached Housing 210 DU Residential Condominium/Townhouse 230 DU Village Center Housing Composite (1) DU Specialty Retail Center 814 KSF General Office Building 710 KSF Restaurant - High-Turnover (Sit-down) 832 KSF Composite - Special Uses (2) KSF Fire Station N.A. KSF Recreational Community Center 495 KSF (1) "Village Center Housing Composite" rate is derived from standard townhouse/condo and elderly attached housing rates. (2) "Special Uses" rates are a composite of typical community retail land uses, including drive-in bank, gas station with convenience store, day care, medical & dental offices and specialty retail. Table F-5 summarizes the overall trip generation for the three development scenarios. The trips shown in the table represent gross trip generation. Under Scenario 2 in which the Village Center commercial uses coexist with a 600 unit residential component, it was assumed that 5% of the Village Center commercial based traffic was derived from the immediately adjacent Village Center residential component. No other traffic reductions, pass-by or diverted trip assumptions were utilized to reduce assigned volumes to the roadway network. Page F-5
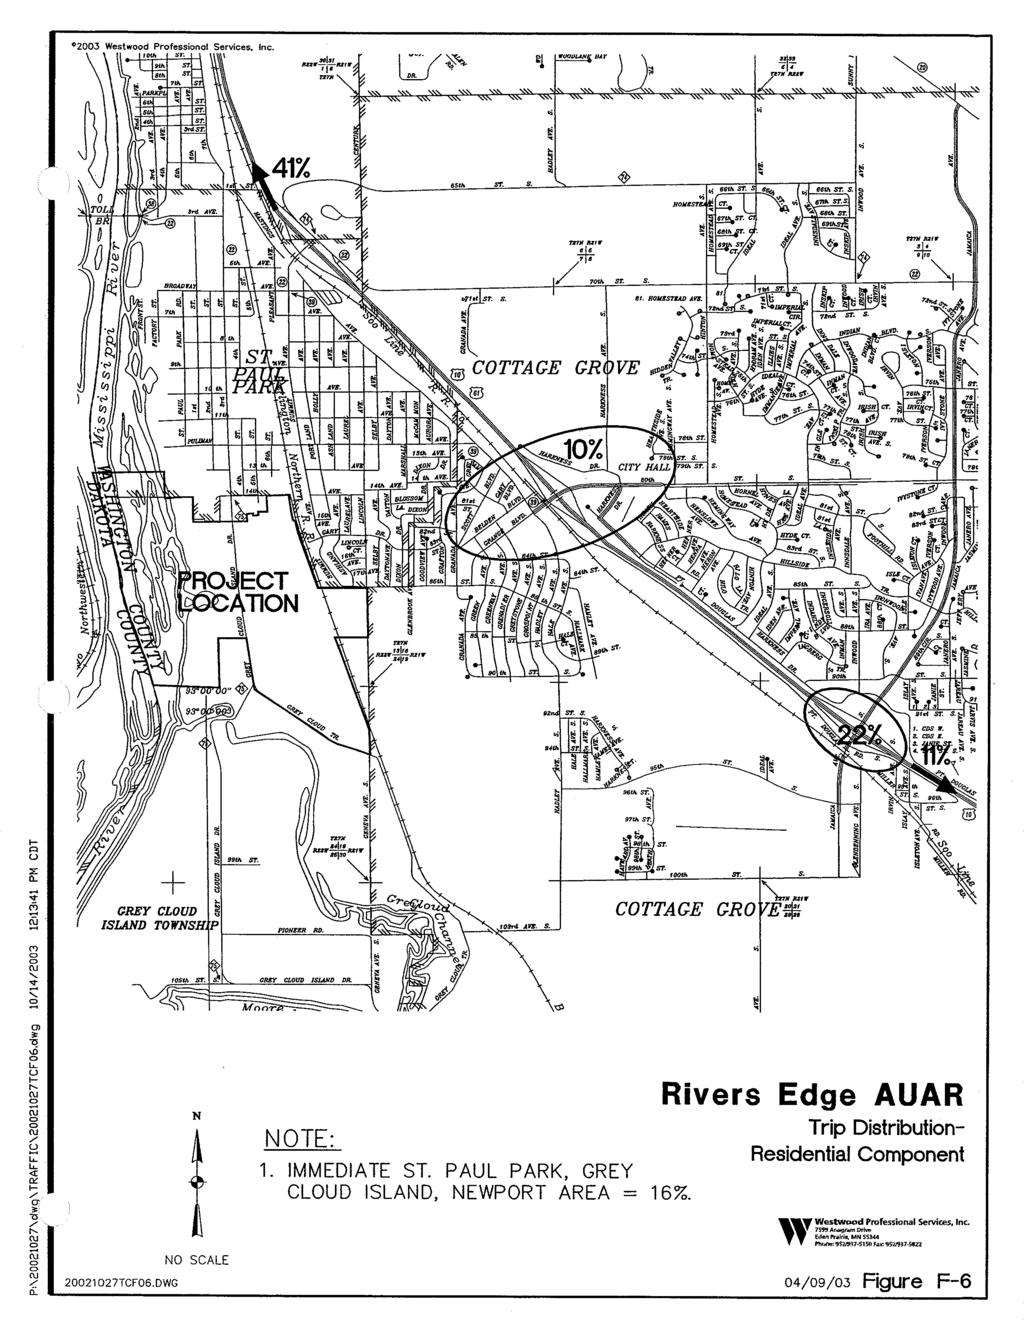
8 Table F-5 Trip Generation Summary Land Use A.M. Peak Hour P.M. Peak Hour Daily Trips (Approx. 7:30-8:30 A.M.) (Approx. 4:30-5:30 P.M.) (Trip Ends) In Out Total In Out Total Scenario 1 Single-Family Detached Housing Scenario 2 Single-Family Detached Housing 9, ,012 Residential Condominium/Townhouse 4, Village Center Housing Composite 2, Specialty Retail Center 1, General Office Building Restaurant - High-Turnover (Sit-down) 1, Composite - Special Uses 2, Fire Station Recreational Community Center Total Trips 21, ,081 1,542 1, ,086 Scenario 3 Single-Family Detached Housing 9, ,012 Residential Condominium/Townhouse 4, Village Center Housing Composite Specialty Retail Center 1, General Office Building Restaurant - High-Turnover (Sit-down) 1, Composite - Special Uses 2, Fire Station Recreational Community Center Total Trips 19, ,415 1, ,930 Trip Distribution The trip distribution for the residential components of the development in the AUAR area was established from the destination patterns for the St. Paul Park/Grey Cloud Island area contained in the Metropolitan Council s regional traffic forecasting model. (Source: Metropolitan Council Transportation Section Regional TRANPLAN model run, March, 2003). The residential trip distribution is shown on Figure F-6. The distribution pattern for the commercial component of the Village Center was based on preliminary market study data for this type of commercial facility provided by DSU Research. As a neighborhood based commercial area, the Village Center uses are expected to have a trade area radius size of less three miles, and less than ten minutes drive time. This range indicates that the uses in the Village Center will be primarily geared towards residents of the development of the AUAR area and the rest of St. Paul Park and Grey Cloud Island Township. It is expected that approximately 60% of the Village Center commercial traffic will be from within that area, with the remainder coming from the other nearby areas such as Cottage Grove. Page F-6
9 The proposed development of the AUAR area with its high concentration of residential units should generate additional demand on the transit system for home to work trips. Current Metropolitan Council information shows that about 40% of the work trips from St. Paul Park to downtown Minneapolis and about 20% of the work trips to downtown St. Paul use transit. The additional residents of the development in the AUAR area using express transit to the downtowns will place additional demand on the current Cottage Grove Park and Ride lot and express service. The availability of this transit service will serve to keep the automobile trip generation from the site lower and result in fewer vehicles assigned to the external roadway system. Trip Assignment and Traffic Analysis In the trip assignment portion of the analysis, the new trips generated from the AUAR area were assigned to the roadway network using the routing patterns expected to be employed by the future residents of the development. The organization and tabulation of the trip assignment was facilitated by use of the TRAFFIX computer-based traffic assignment program. This program employs a structure of trip generation zones and roadway links and nodes to carry out the traffic assignment process across the study area network. Early on in the study process, the issue of limited access into the development in the AUAR area was identified. With the inplace barrier formed by the railroad tracks to the east, opportunities to disperse traffic from the AUAR area are limited. It is certain that 3rd Street will serve as the major entry route into the AUAR area. Third Street, which is identified as a collector street in the City s Comprehensive Plan, presently operates as a two-lane street with numerous driveways onto it. From Broadway southerly to Pullman Avenue, 3rd Street has a foot width. From Pullman south to the current south city limits, the street width varies between 27 and 30 feet. In addition to Third Street to the north, it is also expected that prior to full build out of the entire site, an extension of 95th Street westerly through Cottage Grove to the AUAR area will provide a second major access route to the development. This new link will provide more direct access for the portion of traffic from the southern portions of the AUAR area that desires to travel south and east, for example to access shopping opportunities within Cottage Grove along T.H. 61. Capacity Issues on Surrounding Area Roadways As site generated traffic increases on Third Street, one of the issues to address is the capacity of that roadway. For most urban roadways the practical capacity is determined by intersection (typically signalized) performance. The maximum ability of an intersection to accommodate demand volumes will most often cap the ultimate throughput of the roadway. In general terms (outside of undue intersection capacity restrictions) a two lane roadway has a practical capacity of about 9000 to 10,000 vehicles per day. At that level the roadway functions as a major collector. (The Washington County Transportation Plan, in its table of Daily Roadway Capacities, cites 9,000 as the limit for a two lane road at level of service C.) As demand volumes exceed the capacity of a two lane roadway, a next step up is represented by a three lane roadway, with a continuous two-way left-turn lane. This type of roadway functions well along a road with numerous cross streets or intermediate driveways. Various traffic engineering sources site the capacity of a three lane roadway with the two-way left-turn Page F-7
10 lane at about 16,000 to 18,000 vehicles per day. (The Washington County Transportation Plan cites 16,000 as the limit for a three lane road at level of service C.) Phased Traffic Assignments One of the issues addressed in this study is the ability of nearby roadways to accommodate development traffic. To facilitate the understanding of this issue a set of traffic forecasts was computed for each phase of development. Furthermore, the forecasts were computed under two scenarios: without and with a 95th Street connection to the east inplace. The addition of the 95th Street connection provides another high level access to the AUAR area and serves to lessen east-west demand on Pullman Street. The development of the AUAR area is expected to be constructed in eleven stages between 2004 and Tables F-9 (Scenario 2) and F-10 (Scenario 3), printed at the back of this Appendix, summarize the year-by-year, phase-by-phase, growth in traffic volumes projected along key links. These volumes include current volumes, traffic generated from the AUAR area by phase and the modest growth in background traffic from sources other than the AUAR area. Tables F-9 and F-10 are each divided into two parts: the first portion shows volume forecasts without a 95th Street connection in place; the second portions shows the volume forecasts expected with the 95th Street connection completed. Examination of Tables F-9 and F-10 shows the following findings: Using a capacity value of 9,000 vehicles for a two lane road, five phases of development could be completed before the capacity of the current two lane roadway on Third Street is exceeded. At that time it will be necessary to increase the capacity of Third Street through the conversion to a three lane road with a two-way left-turn lane. This finding assumes that the 95th Street connection is not inplace during these first several years of development of the AUAR area. Along with the expansion of the roadway capacity for Third Street, it is expected that a trail will be provided to meet the goal of a regional trail corridor through this portion of South Washington County. As the site proceeds toward full development, the provision of the 95th Street Connection with phase 8 will keep Pullman Avenue from exceeding it two lane capacity. By the completion of development, with Third Street upgraded and the 95th Street connection inplace, the area roadways can accommodate traffic generated from the AUAR area within the available roadway capacities. The results of the phase by phase traffic assignment indicate when roadway upgrades or expansions are required to serve the traffic demands of development of the AUAR area. Once those upgrades are completed, the capacities of the roadway system increase dramatically. To understand the capacity that is provided, an analysis was conducted to determine how much additional commercial square footage could be added to the Village Center without causing the need for other roadway improvements beyond those already identified as mitigations for the AUAR area. An examination of the roadway network indicates that in order to refrain from the need to address other roadways, the traffic volumes generated from the AUAR area could increase until the two lane daily capacity (9000) of Pullman Avenue is reached. This would not occur until more than 48,000 square feet of additional commercial use (beyond the proposed 83,000 square feel currently planned) were to be implemented in the Village Center. Page F-8
11 Traffic Assignment Results at Full Development Streets For Scenario 1, with its very limited amount of residential development, no direct traffic assignment was computed. The traffic volumes associated with Scenario 1 will cause no traffic volume related impacts to any of the surrounding roadways. However, it is noted, that the site plan for Scenario 1 anticipates that virtually all of the 45 new single family houses would have direct access to County Road 75, thereby increasing the number of driveways along this fairly high speed stretch of county road. For Scenario 2, the maximum intensity scenario, a complete traffic assignment was developed for daily volumes as well as the A.M. and P.M. peak hour periods. This assignment represents Year 2016 conditions, one year after expected completion of full build-out and occupancy of the final phase of development of the AUAR area. Figure F-7 shows the amount of traffic generated by the AUAR area added to key roadway links on a daily basis at full development. The forecasts represented in Figure F-7 were computed assuming the 95th Street extension and bridge over the railroad tracks is in place by the completion of the last phase of development of the AUAR area. Figure F-8 shows comparable results for Scenario 3 conditions. Intersections To assess the ability of the intersections within St. Paul Park to accommodate traffic for Scenario 2 development of the AUAR area, peak hour traffic assignments and level of service analyses were conducted for the two critical intersections of Broadway/Third Street and Broadway/Summit Avenue. Figure F-9 shows projected peak hour total volumes (current counts plus background growth plus traffic generated by the AUAR area) at both intersections. The results of a stop sign level of service analysis indicate that under Scenario 2 conditions, at full development the intersections of Broadway/Third Street and Broadway/Summit Avenue would both fail under stop sign control. However, if signalization is introduced, together with possible lane/approach restriping, both intersections will function at a level of service C or better in the peak hours. Table F-6 summarizes the level of service analyses for both intersections. Page F-9
12 Broadway / 3rd Street A.M. Peak Hour P.M. Peak Hour A.M. Peak Hour P.M. Peak Hour Approach Geometry - Delay Delay Approach Geometry - Delay Delay Stop Sign Control (sec.) (sec.) Signal Control (sec.) (sec.) West Leg One left, one thru-right 10.1 B 14.3 B One left, one thru, one right 12.0 B 5.7 A North Leg One left, one thru-right 10.4 B 20.1 C One left, one thru-right 6.3 A 28.0 C East Leg One left, one thru-right 16.6 C F One left, one thru, one right 10.3 B 30.4 C South Leg One left, one thru-right F F One left, one thru-right 6.7 A 6.5 A Overall Intersection 91.7 F F 8.2 B 20.9 C Broadway / Summit Approach Geometry - Stop Sign Control Delay (sec.) Delay (sec.) To assess the ability of the intersections within St. Paul Park to accommodate traffic generated by Scenario 3 development of the AUAR area, peak hour traffic assignments and level of service analyses were conducted for the two critical intersections of Broadway/Third Street and Broadway/Summit Avenue. Figure F-10 shows projected peak hour total volumes (current counts plus background growth plus traffic generated by the AUAR area) at both intersections. The results of a stop sign level of service analysis indicate that under Scenario 2 conditions, at full development the intersections of Broadway/Third Street and Broadway/Summit Avenue would both fail under stop sign control. However, if signalization is introduced, together with possible lane/approach restriping, both intersections will function at a level of service C or better in the peak hours. Table F-7 summarizes the level of service analyses for both intersections. Approach Geometry - Signal Control Delay (sec.) Delay (sec.) West Leg One left, one thru-right F 70.0 F One left, one thru-right 20.2 C 22.8 C North Leg One left-thru, one right 32.4 D F One left-thru, one right 7.4 A 11.7 B East Leg One left, one thru-right 41.5 E 16.1 C One left, one thru-right 4.1 A 5.7 A South Leg One left-thru, one right 63.2 F 20.4 C One left-thru, one right 23.0 C 11.9 B Overall Intersection 66.7 F 81.8 F 13.9 B 14.5 B Note: Delay and were determined using HCM 2000 methodologies in Synchro Table F-6 Full Development Intersection Capacity Analyses Scenario 2 A.M. Peak Hour P.M. Peak Hour A.M. Peak Hour P.M. Peak Hour Page F-10
13 Broadway / 3rd Street A.M. Peak Hour P.M. Peak Hour A.M. Peak Hour P.M. Peak Hour Approach Geometry - Delay Delay Approach Geometry - Delay Delay Stop Sign Control (sec.) (sec.) Signal Control (sec.) (sec.) West Leg One left, one thru-right 10.0 B 14.1 B One left, one thru, one right 10.9 B 6.2 A North Leg One left, one thru-right 10.2 B 19.0 C One left, one thru-right 6.3 A 26.3 C East Leg One left, one thru-right 16.0 C F One left, one thru, one right 8.4 A 27.8 C South Leg One left, one thru-right F 85.8 F One left, one thru-right 6.4 A 3.9 A Overall Intersection F 97.4 F 7.3 A 18.9 B Broadway / Summit A.M. Peak Hour P.M. Peak Hour A.M. Peak Hour P.M. Peak Hour Approach Geometry - Delay Delay Approach Geometry - Delay Delay Stop Sign Control (sec.) (sec.) Signal Control (sec.) (sec.) West Leg One left, one thru-right 99.1 F 56.0 F One left, one thru-right 16.5 B 19.8 B North Leg One left-thru, one right 28.7 D 99.1 F One left-thru, one right 7.4 A 10.7 B East Leg One left, one thru-right 39.8 E 15.9 C One left, one thru-right 4.0 A 5.4 A South Leg One left-thru, one right 58.8 F 19.7 C One left-thru, one right 22.0 C 10.8 B Overall Intersection 58.0 F 70.8 F 12.6 B 12.9 B Note: Delay and were determined using HCM 2000 methodologies in Synchro St. Paul Park Interchange Table F-7 Full Development Intersection Capacity Analyses Scenario 3 As part of the major T.H. 61 upgrade, the St. Paul Park interchange is also undergoing a major upgrade and capacity enhancement. The planning for the interchange was undertaken with no particular attention to the specific amount of growth represented by development of the AUAR area. To assess the ability of the new interchange to handle the increased traffic generated by the AUAR area, Year 2020 peak hour traffic analyses were conducted for the two signalized intersections at the ramp terminals. (Year 2020 was selected because the base Mn/DOT forecasts for the interchange were developed for that year.) Figure F-11 shows the peak hour year 2020 interchange ramp forecasts based on the Mn/DOT forecasts for the interchange contruction project and Figure F-12 shows the 2020 forecasts plus traffic generated by development of the AUAR area. Table F-8 shows the results of the capacity analyses for base conditions (Mn/DOT forecasts without development of the AUAR area) and for the case with traffic generated by the AUAR area added in, as well. As shown in Table F-8, the ramp terminals, with the large increase in capacity achieved through the Wakota expansion project, are both expected to operate at level of service C or better in the future with development traffic added to the Mn/DOT forecast volumes, Page F-11
14 Southbound Ramps A.M. Peak Hour P.M. Peak Hour Scenario Delay in Delay in Seconds Seconds 2020 Projected Volumes (by Mn/DOT) 9.0 A 20.1 C 2020 Projected Volumes plus Rivers Edge 11.5 B 27.2 C Northbound Ramps A.M. Peak Hour P.M. Peak Hour Scenario Delay in Delay in Seconds Seconds 2020 Projected Volumes (by Mn/DOT) 6.2 A 3.3 A 2020 Projected Volumes plus Rivers Edge 13.0 B 5.0 A Conclusions Table F-8 T.H. 61 Upgrade, St. Paul Park Interchange 1. The three scenarios analyzed in this study exhibit a range of daily traffic volumes from 498 (Scenario 1) to 21,655 (Scenario 2). 2. Traffic from Scenario 1 creates no capacity-related impacts to the surrounding roadway system. 3. Traffic from Scenario 2 can be accommodated by the roadway system with the following mitigations applied: Increase in the capacity of Third Street through implementation of a three lane roadway prior to the construction of Phase 6. Implementation of the 95th Street extension bridge over the railroad tracks prior to the construction of Phase 9. Signalization of the intersections of Broadway/Third Street and Broadway/Summit when appropriate signal warrants are met. The city, through their MSA street system traffic counting program, should bi-annually study the volumes at these intersections and assess the exact time when signal warrants are met. 4. Traffic from Scenario 3 can be accommodated by the roadway system with the following mitigations applied: Increase in the capacity of Third Street through implementation of a three lane roadway prior to the construction of Phase 6. Implementation of the 95th Street extension bridge over the railroad tracks prior to the construction of Phase 9. Signalization of the intersections of Broadway/Third Street and Broadway/Summit when appropriate signal warrants are met. The city, through their MSA street system traffic counting program, should bi-annually study the volumes at these intersections and assess the exact time when signal warrants are met. 5. Scenario 2, with its Village Center housing component, does not necessitate additional mitigations or improvements beyond what is needed for Scenario 3. Scenario 3 causes certain improvements along with a timeframe for those improvements. Scenario 2, with Page F-12
15 its additional 600 Village Center housing units during the last phases of development, does not create a need for any other additional mitigations. 6. Under Scenario 2, certain roadway mitigations are required. With those mitigations inplace, the development of the AUAR area and surrounding roadway network could support an additional 48,000 square feet of Village Center commercial uses or 290 additional housing units (50/50 ratio of SF/MF) without requiring additional transportation system mitigations. 7. This study primarily focused on the impacts of traffic generated by the AUAR area to the surrounding roadway system. In order to achieve effective traffic operations within the site, future detailed site planning will need to make use of access management practices to promote safe, effective traffic flow within the site. 8. At the immediate site boundary to the south, the current intersection of County Road 75 and Grey Cloud Trail has experienced crash problems. In the detailed site planning and design of the roadway/intersection interface, these problems will need to be corrected. The skewed approach will be straightened and the poor sight distance will be eliminated. This design improvement will be implemented when the intersection is rebuilt in conjunction with development of the AUAR area. Page F-13
16 Table F-9 Traffic Volume Growth Along Key Links Scenario Dwelling Units Table F-10 Traffic Volume Growth Along Key Links Scenario Dwelling Units Cumulative Dwelling Units * Without 95th Street Bridge With 95th Street Bridge Single Family Multi- Family 3rd St. S. of Pullman 3rd St. S. of Broadway Pullman W. of Summit 3rd St. S. of Pullman 3rd St. S. of Broadway Pullman W. of Summit Existing Phase Phase Phase Phase Phase Phase Phase Phase Phase Phase Phase Year After Cumulative Dwelling Units * Without 95th Street Bridge With 95th Street Bridge Single Family Multi- Family 3rd St. S. of Pullman 3rd St. S. of Broadway Pullman W. of Summit 3rd St. S. of Pullman 3rd St. S. of Broadway Pullman W. of Summit Existing Phase Phase Phase Phase Phase Phase Phase Phase Phase Phase Phase Year After * Approximate dwelling unit count per phase based on preliminary phasing plan boundaries Page F-14
17
18
19
20
21
22
23
24
25
26
27
28