LONE STAR HARBOR SAFETY COMMITTEE Roger Guenther Executive Director Port of Houston Authority
|
|
|
- Erik Wilkins
- 5 years ago
- Views:
Transcription


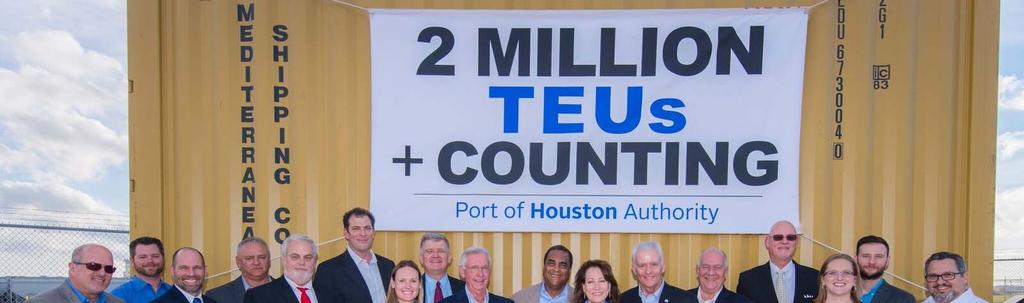
1 LONE STAR HARBOR SAFETY COMMITTEE Roger Guenther Executive Director Port of Houston Authority Terminal/Refinery Symposium Thursday, February16, 2017

2 HOUSTON THE BUSIEST U.S. CHANNEL


3 ECONOMIC IMPACTS FOR 2015 $265 billion million $292 million $127 million Total Port Economic Value Total Port Jobs Generated PHA Operating Revenue PHA Cash Flow 16% of state GDP +148,000 since % vs % vs. 2014

4 ABOUT THE PORT OF HOUSTON #1 U.S. Port by Foreign Waterborne Tonnage #1 Click U.S. to Port add in text Petroleum, Steel and Project Cargo #6 Ranked U.S. Container Port by Total TEUs
 and Landlord Port")
5 PORT OF HOUSTON AUTHORITY FACILITIES Governmental subdivision chartered by the State Governed by a seven member Commission Appointed by Harris County, City of Houston and other neighboring cities Owns/operates 8 public terminals - Operating (2) and Landlord Port (6)
6 HSC Activity 2016 (Total Arrivals/Shifts) Total All Greater Port of Houston Terminals 9870 Port of Houston Authority Facilities 2358 Barbours Cut Terminal 577 Bayport Terminal 471 City Docks 767 Bulk Plant 79 Care Terminal 117 Jacintoport 194 Woodhouse % of Activity is at Port Authority Facilities Source: GHPB 2016 Statistical Report
7


8 FUTURE GROWTH OUTLOOK Shale Renaissance/Resin Export Population Growth Panama Canal Expansion


9
10 U.S. PE Export Activity Concentrated in Select Ports Graph: US Waterborne PE Export by Port, 2015 Units: Millions of Metric Tons Source: Customs Data from Census Bureau Houston LA/Long Beach New Orleans Freeport TX New York All Others 10% 7% 3% 2% 3% 2015 % Market Share 75%
11 PE Export Routing Depends on Destination Region Graph: US Waterborne PE Export by Destination Region and Export Port Source: Customs Data from Census Bureau Units: Metric Tons Port of Export Port of Houston Port of LA/Long Beach All Other US Ports 500,000 1,000,000 1,500,000 2,000,000 Destination: World excl. East Asia Destination: East Asia Preferred port of export depends on destination region East Asia: So Cal or Houston North/South and Transatlantic: Houston or other ports Which end use markets will absorb new PE production? Houston is gaining Asia direct/panama Canal services

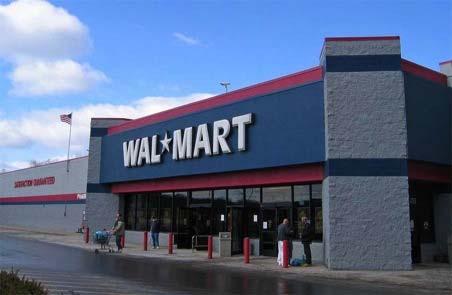
12 New PE Projects Concentrated Near West Gulf Ports * Map: Select new PE projects and Major US resin export ports Houston & other West Gulf ports dominate PE exports today with 88% market share in 2015 Port of New York Port of Norfolk Port of LA / Port of Long Beach So Cal competes with Houston for East Asia exports Port of Port of New Houston Orleans Port Freeport Port of Charleston Port of Savannah Southeast ports have major marketing push to attract Gulf-produced PE but volumes have yet to materialize
13 Houston: Ready for New Plastic Resin Export Wave Port of Houston Authority Continued major investments in expanding container terminals 45 ft channel getting closer to completion at Working closely with all stakeholders Baggers investing substantially in new facilities Easy for shipping lines to deploy larger vessels and import more empties as needed Local trucking community highly engaged

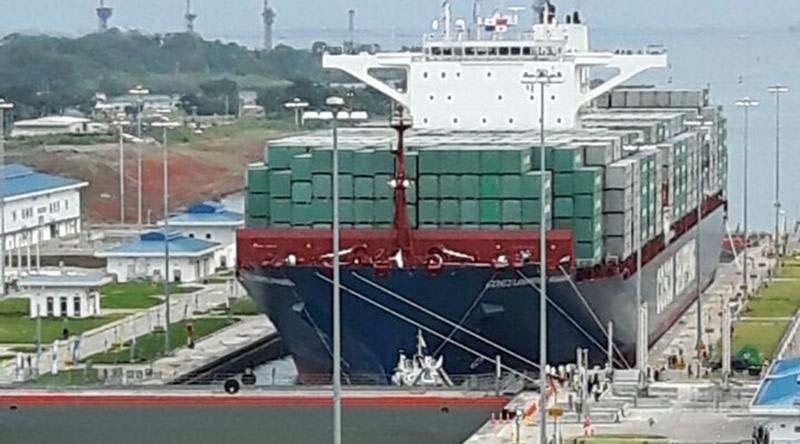
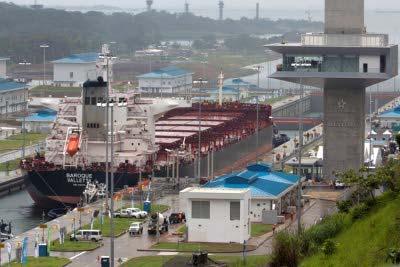
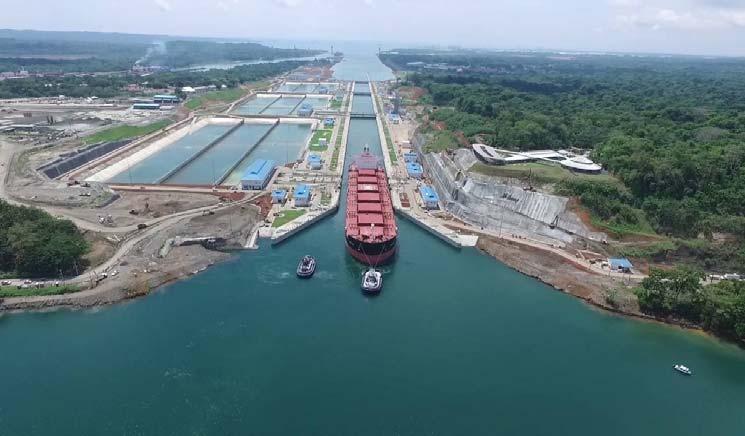
14 Panama Canal Expansion
, PHA Market Development 31% Africa / M East Mediterranean EXPORTS BY")
15 PHA CONTAINER TRADE SHARE IMPORTS BY TRADE REGION Asia N Europe Americas Mediterranean Indian Subcont. Africa / M East All Other 7% 3% 3% 13% 17% 26% Note: Totals DO NOT include empty containers Source: Journal of Commerce (PIERS), PHA Market Development 31% Africa / M East Mediterranean EXPORTS BY TRADE REGION Americas N Europe Asia Indian Subcont. All Other 4% 4% 15% 14% 12% 22% 29%

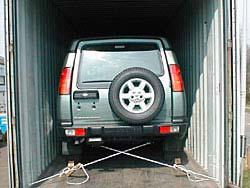
16 Bayport Automobile Terminal
17 Pilot Coordination Regular meetings Simulations Engagement in Mega Study Collaboration with Container Carriers

![Texas ($ Mil) [VALUE] $4.](/docs-images/90/101831282/images/18-2.jpg "2 billion annually to keep cars and trucks")

18 Annual Federal Funding for Highways Federal Funding for Transportation in Texas ($ Mil) [VALUE] $4.2 billion annually to keep cars and trucks moving $ Millions $120 million for the maritime highways to 28 Texas ports and the GIWW [VALUE] HIGHWAYS CHANNELS

19 Marine Terminal Expansion 45 Channel $ Millions Number of 45-foot berths along the channel: Today: 14 Permitted and planned: 42

20 PHA Property 5,200 acres eight operating terminals 11,800 Ac 9,000 acres of dredged material placement areas and marsh 11,800 acres of submerged land and channels 5,200 Ac 9,000 Ac

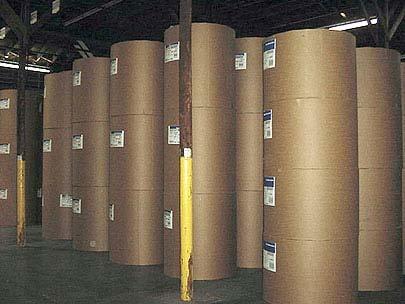
21 Confined Placement Areas for Dredge Material Key to the balance of the dredging cycle Heavily used Management increases useful life Expensive to replace


22 Federal Channel Navigation Study IMPROVE ALL REACHES: Wider channels, including Bayport and BCT Bend easings Deeper drafts upstream Upper bay anchorage

23 Houston the Irreplaceable Port There are no alternative ports for our business and support to the Gulf Houston s energy, security, and inland infrastructure makes it one-of-a-kind Houston is the top exporting port in the US, and is growing Houston s channels are vital to the regional and national economy, and must be protected and preserved


24 THANK YOU Roger Guenther Executive Director Port Houston Questions? East Loop North Houston, TX 77029