Panama Canal Impact on the Liner Container Shipping Industry and the Transshipment Activity in the Republic of Panama
|
|
|
- Elvin Ford
- 5 years ago
- Views:
Transcription
1 Transportation Research Forum Panama Canal Impact on the Liner Container Shipping Industry and the Transshipment Activity in the Republic of Panama Dr. Anatoly Hochstein National Ports & Waterways Institute University of New Orleans March 2005
2 Containership Dimensions & Arrangements Design Capacity (TEUs) Length x Beam x Draft (m) Arrangement (rows) Under - Above - Across Panamax 4, x 32.3 x MSL S-Class 7, x 42.8 x Samsung 9, x 45.6 x MSL Rumor 10, x 51 x Malacca-Max 18, x 60 x New-Panamax (NPX) 12-15, x 55.2 x /
3 Scale Economies of Containerships $/TEU-NM ,500 2,500 3,500 4,500 5,500 6,500 TEUs TEUs Speed $/Hour $/TEU-NM 1, , , , , , , , , , , , , , , , , , , , ,
4 PANAMAX MAX LENGTH: 965 FEET 294 M. POST- PANAMAX MAX LENGTH: 1,265 FEET 385.6M MAX BEAM: 106 FEET 32.5 M. MAX DRAFT: 39.5 FEET 12 M. MAX BEAM: 180 FEET 53.9M MAX DRAFT: 50 FEET 15.2M
5 Objectives, Framework & Methodology Relevant Trade Flows (12) Economic Scenarios (3) Operational Scenarios (3) Service Patterns (9) Containership Sizes (9) Allocation of Trades to Patterns Constraints (USWC ports, Intermodal, USEC ports) Diversion (Asian imports to the USA)

6 Relevant Trade Flows
7 Scenario Definition

8 Factors Defining Scenarios
9 Diversion Criterion Inventory Cost: Carrying Cost Capital, Storage, Maintenance Opportunity Cost Lost Sales, Delayed Sale at Lower Price Service Premium: Freight Rates Differential Transit Time Differential Diversion: Premium > Inventory Cost

10 Present Freight Rates and Times

11 Diversion of TPD-IM to AWX

12 US East Coast Diversions
13 US Gulf Coast Diversion
14 Trade Allocation Summary by Trade Fronts (TEUs( TEUs) US-Eur 25.7% US-SAm 12.7% SAm-Eur/Asia 12.8% US-Oceania 7.2% IntraSAm 2.5% WCSA-Carib 0.3% US-Eur 25.9% US-SAm 15.1% SAm-Eur/Asia 7.0% US-Oceania 7.3% IntraSAm 1.1% WCSA-Carib 0.1% US-Asia 38.7% US-Asia 43.5%

15 User Inferface

16 Sensitivity to Tolls Increase Baseline Forecast, Mod Change, Tolls Jul 2003 Baseline Forecast, Mod Change, Tolls Jul % Baseline Forecast, Mod Change, Tolls Jul %
17 Transportation Research Forum Panama Canal Impact on the Liner Container Shipping Industry and the Transshipment Activity in the Republic of Panama -- T h a n k Y o u --

18 US Regions 21% 27% 25% 14% 13%
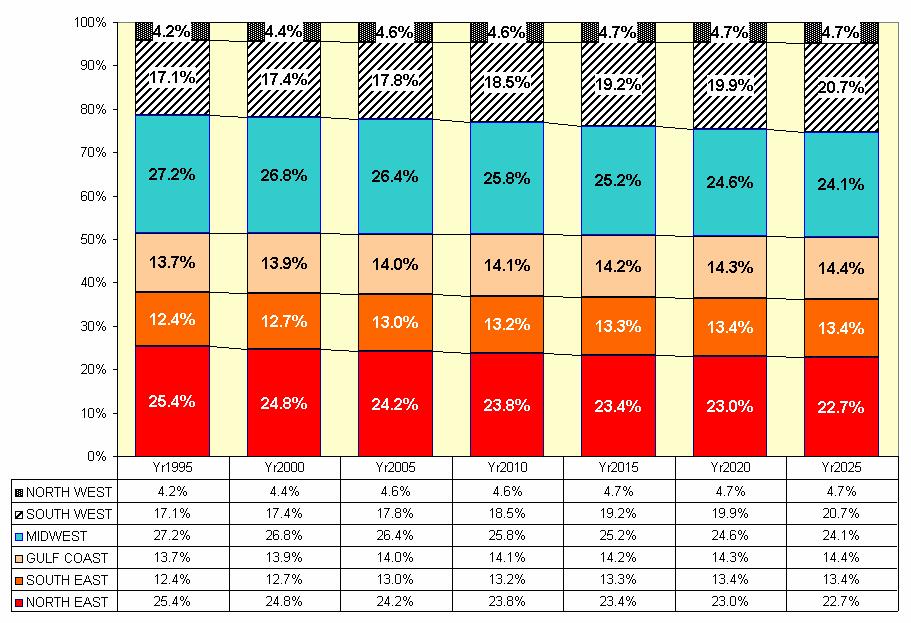
19 US Population Growth
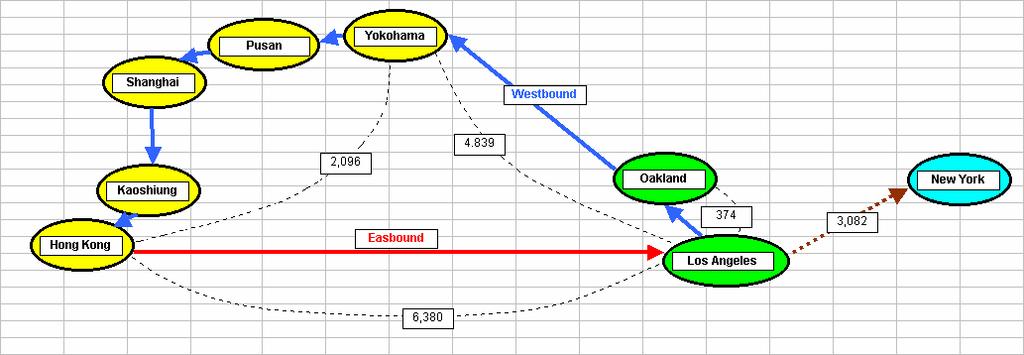
20 TPD + Intermodal

21 AWX Rotation
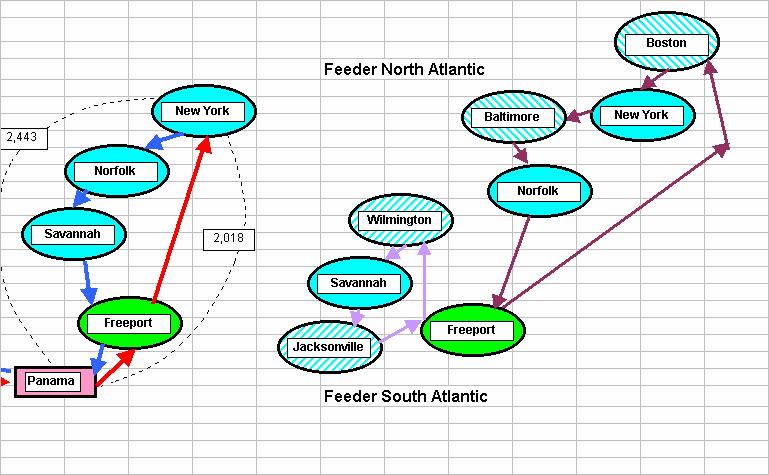
22 AWX Transshipment Rotation

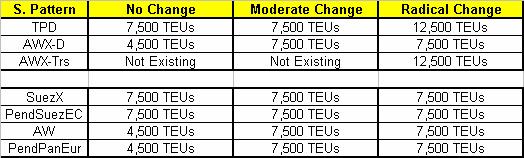
23 Present Services by Pattern
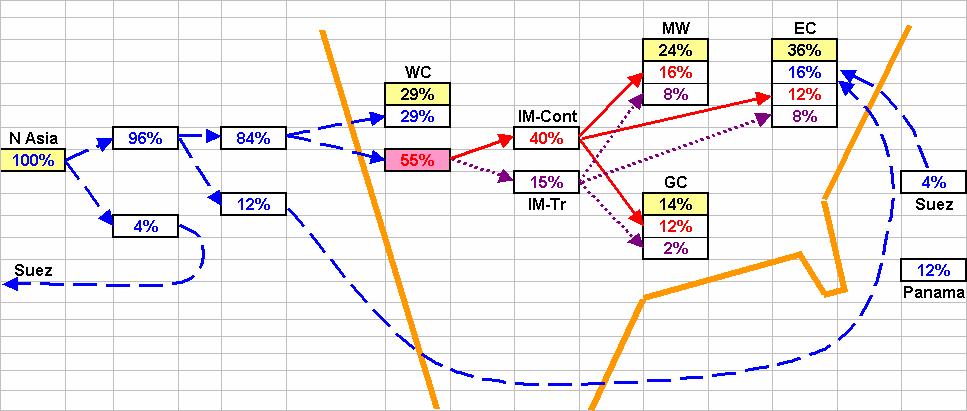
24 Trade Allocation Tree - NE Asia to USA Trade

25 Trade Allocation Tree - NE Asia to USA Trade, East Coast Detail

26 Trade Allocation Summary by Trade Fronts (TEUs( TEUs,, one way)
27 Intermodal Bridges East Coast Round Trip Scenarios Round Trip Scenario Low High Share West Coast/East Coast with Export Return $ 2,000 $ 2,350 50% West Coast/East Coast with Empty Return $ 1,700 $ 2,050 25% West Coast/East Coast with Domestic Return* $ 1,600 $ 1,850 25% Blended Average West Coast/East Coast Round Trip $ 1,825 $ 2,150 * $ WB via rail to Chicago, $300 for IMC to USWC Minilandbridge rail rates have been relatively stable in recent years The North American rail network as a whole has reserve capacity in major corridors to handle foreseeable growth in mini-landbridge traffic. Southern California may face near-term congestion and prioritization, but has some ability to increase long-term capacity Northern California, the Pacific Northwest, and Canada all have substantial reserve rail capacity The potential growth in intermodal MLB traffic should justify the continued investment in line-haul capacity, equipment, and terminals
28 Asian Import Value ($/TEU) 35% 30% 25% 20% 15% 10% 5% 0% 0 10,000 20,000 30,000 40,000 50,000 60,000 70,000 80,000 90, , , , , , , ,000 Atlantic Pacific Both Coasts

29 Trade Allocation Summary by Service Pattern (TEUs( TEUs,, one way)
30 Economic Forecasts TradeDest TradeOrig Base Base Worst Best USA NE Asia 5,932,441 20,442, % 16,744, % 29,765, % Europe 2,266,124 6,924, % 5,738, % 9,186, % SE Asia 1,085,644 3,294, % 3,229, % 5,162, % WCSA 243,541 1,052, % 878, % 1,767, % USA Imports >>> 9,527,749 31,713, % 26,589, % 45,882, % NC/ECSA USA 412,632 2,058, % 1,828, % 2,869, % Oceania USA 169, , % 584, % 895, % USA EXPORTS >>> 582,449 2,743, % 2,412, % 3,765, % ECSA NE Asia 144, , % 485, % 770, % WCSA Asia 171, , % 351, % 388, % Europe 169, , % 279, % 397, % NC/ECSA 93, , % 147, % 171, % NCSA Asia 41,611 78, % 71, % 84, % Carib WCSA 5,997 10, % 10, % 14, % Containerized Trade Annual Average Growth Total Trade Scenario US-ASIA Most Probable 5.1% 5.6% 5.3% 5.2% US-ASIA Best 5.7% 6.5% 6.4% 6.1% US-ASIA Worst 3.8% 4.5% 4.3% 4.1% US-CHINA Most Probable 7.4% 7.6% 6.9% 7.0% US-CHINA Best 8.0% 8.7% 8.0% 8.0% US-CHINA Worst 6.1% 6.6% 5.9% 6.0% US-HONG KONG Most Probable 5.4% 5.6% 4.8% 4.9% US-HONG KONG Best 5.9% 6.4% 5.8% 5.7% US-HONG KONG Worst 3.9% 4.2% 3.5% 3.6% US-JAPAN Most Probable 3.7% 4.1% 3.7% 3.7% US-JAPAN Best 4.2% 5.0% 4.7% 4.6% US-JAPAN Worst 2.4% 3.0% 2.6% 2.6% Source: DRI-WEFA

31 Containerized Cargo Forecast by Economic and Operational Scenarios (TEUs( TEUs)
32 Diversion Criterion Inventory Cost: Carrying Cost Capital, Storage, Maintenance Opportunity Cost Lost Sales, Delayed Sale at Lower Price Service Premium: Freight Rates Differential Transit Time Differential Diversion: Premium > Inventory Cost
33 Diversion Criterion Inventory Cost: Carrying Cost Capital, Storage, Maintenance Opportunity Cost Lost Sales, Delayed Sale at Lower Price Service Premium: Freight Rates Differential Transit Time Differential Diversion: Premium > Inventory Cost
34 Qualitative Factors Large Retailers (WalMart, Home Depot): Import Center Regional Distribution Center Stores Already AW Large Importer (Sony, Mattel, Nike): National Distribution Center at WC/MW Mostly IM Diversion IM to AW: Growth of Large Retailer At Expense of Large Importers and Small Retailers (+) Time Event Products (-) Cargo Value Decrease (+) JIT Increase (-)
35 Present US Distribution