Investor Briefing & Site Tour Driving Value
|
|
|
- Liliana Edwards
- 5 years ago
- Views:
Transcription

1 Investor Briefing & Site Tour Driving Value 27 & 28 October Presentations
2 Important notice FOR PERSONAL USE ONLY No Reliance on this document This document was prepared by Aurizon Holdings Limited (ACN ) (referred to as Aurizon which includes its related bodies corporate). Whilst Aurizon has endeavoured to ensure the accuracy of the information contained in this document at the date of publication, it may contain information that has not been independently verified. Aurizon makes no representation or warranty as to the accuracy, completeness or reliability of any of the information contained in this document. Document is a summary only This document contains information in a summary form only and does not purport to be complete and is qualified in its entirety by, and should be read in conjunction with, all of the information which Aurizon files with the Australian Securities Exchange. Any information or opinions expressed in this document are subject to change without notice. Aurizon is not under any obligation to update or keep current the information contained within this document. Information contained in this document may have changed since its date of publication. No investment advice This document is not intended to be, and should not be considered to be, investment advice by Aurizon nor a recommendation to invest in Aurizon. The information provided in this document has been prepared for general informational purposes only without taking into account the recipient s investment objectives, financial circumstances, taxation position or particular needs. Each recipient to whom this document is made available must make its own independent assessment of Aurizon after making such investigations and taking such advice as it deems necessary. If the recipient is in any doubts about any of the information contained in this document, the recipient should obtain independent professional advice. No offer of securities Nothing in this presentation should be construed as a recommendation of or an offer to sell or a solicitation of an offer to buy or sell securities in Aurizon in any jurisdiction (including in the United States). This document is not a prospectus and it has not been reviewed or authorised by any regulatory authority in any jurisdiction. This document does not constitute an advertisement, invitation or document which contains an invitation to the public in any jurisdiction to enter into or offer to enter into an agreement to acquire, dispose of, subscribe for or underwrite securities in Aurizon. Forward-looking statements This document may include forward-looking statements which are not historical facts. Forward-looking statements are based on the current beliefs, assumptions, expectations, estimates and projections of Aurizon. These statements are not guarantees or predictions of future performance, and involve both known and unknown risks, uncertainties and other factors, many of which are beyond Aurizon s control. As a result, actual results or developments may differ materially from those expressed in the forward-looking statements contained in this document. Aurizon is not under any obligation to update these forward-looking statements to reflect events or circumstances that arise after publication. Past performance is not an indication of future performance. No liability To the maximum extent permitted by law in each relevant jurisdiction, Aurizon and its directors, officers, employees, agents, contractors, advisers and any other person associated with the preparation of this document, each expressly disclaims any liability, including without limitation any liability arising from fault or negligence, for any errors or misstatements in, or omissions from, this document or any direct, indirect or consequential loss howsoever arising from the use or reliance upon the whole or any part of this document or otherwise arising in connection with it. 2
3 Investor Briefing Driving Value Day 1 27 October 2014
4 Welcome & Introduction Lance Hockridge Managing Director & CEO
5 Agenda 1 Welcome & Introduction MD & CEO Lance Hockridge FOR PERSONAL USE ONLY Network Introduction EVP Network Alex Kummant Network Operations VP Network Operations Clay McDonald Capital Expenditure / Network Regulation VP Network Regulation Lana Stockman VP Network Finance Pam Bains Above Rail Operations EVP Operations Mike Franczak 6 Q & A 5

6 Safety performance, our target is FOR PERSONAL USE ONLY Lost time injuries per million person-hours worked Lost Time Injury Frequency Rate (LTIFR) 1 Total Recordable Injury Frequency Rate (TRIFR) % improvement % 0.28 Incidents per million person-hours worked % improvement % 2.80 FY2009 FY2010 FY2011 FY2012 FY2013 FY2014 FY2009 FY2010 FY2011 FY2012 FY2013 FY LTIFR & TRIFR includes employees only and does not include contractors 6
7 Aurizon s value creation fundamentals remain strong FOR PERSONAL USE ONLY Network Below Rail Regulated Asset Base (RAB) growing to ~$6bn by FY2017 Stable earnings, given regulated revenue stream Top six mining companies account for 80% of contract volumes Targeted projects to deliver cost effective incremental capacity UT4 draft revenue decision released 30 September 2014 Above Rail Volumes growing despite negative sentiment Coal haulage outlook for FY2015 remains mt (September 2014 quarter 54.2mt, 1% growth) Long-term demand for Australian commodities remains strong China Improved steel quality (met) Higher quality thermal India Potential thermal shortfall Driving Returns Transformation: On track for 75% Operating Ratio (OR) in respect of FY2015 Culture of continuous improvement driving towards 70% and beyond Integrated Operating Plan (IOP) driving operational improvements Transformational capital to speed reforms and deliver incremental returns 7 7
8 Aurizon s focus to drive shareholder value Management s core focus is driving returns all investment and activities must meet or exceed hurdle rates (mid-teens, pre-tax) FOR PERSONAL USE ONLY 1. Focus on achieving 75% Operating Ratio in respect of FY2015 and continuous improvements thereafter Safety is Aurizon s number one priority Continuous transformation across the business Working closely with customers 2. Transformational capital to speed reforms and deliver incremental returns Information technology Fuel and operational technology Rollingstock maintenance Fleet upgrades 3. Delivering high value, strategic growth opportunities in bulk supply chains, investment criteria remains: Alignment and fit to enterprise strategy, objectives and capabilities Return risk vs. reward/internal hurdles and timing Risk strategic, operational, financial, legal and regulatory 4. Deploying effective capital management strategies, including: Maintaining investment grade credit rating Appropriate dividend levels (currently 70% payout ratio) Excess capital returns where appropriate 8 8
9 West Pilbara Infrastructure Project (WPIP) a growth OPTION, not yet a COMMITMENT to invest FOR PERSONAL USE ONLY Option cost $211m (15% investment in Aquila) Feasibility work commenced Key deliverable in 2015: March 2015 indicative tariff (+/- 25%) October 2015 binding tariff (+/- 15%) No capital investment until Final Investment Decision (FID) (currently expected CY2016) which is subject to: Overall project economics being competitive irrespective of commercial framework Obtaining appropriate credit security for all counterparties Execution of take or pay contracts for infrastructure services for the life of the mine Project financing with no recourse to Aurizon balance sheet Aurizon to be majority equity holder in InfraCo, with no MineCo equity First option of InfraCo minority equity will be to MineCo partners 9
10 Transformational and productivity capex driving incremental returns and operational improvements FOR PERSONAL USE ONLY Capital expenditure FY2015 FY2017 ($m) 1,100 ~$1,100m ~$750m ~$700m FY2015(f) FY2016(f) FY2017(f) Sustaining Transformational and productivity Growth Growth capex ~$800m, including ~$400m Network (WIRP and Rolleston electrification) ~$300m Operations (Whitehaven rollingstock & Hexham) ~$100m Other Transformational and productivity capex ~$550m ~$300m transformational capex driving incremental returns with an average payback within five years ~$250m fleet upgrades driving improvements in productivity, maintenance and fuel Sustaining capex ~$1,200m ~$800m Network, the majority of which earns the regulated WACC ~$400m Operations and other sustaining capital including rollingstock overhauls Long run expectations remain $500m-$600m per year 10
11 Network Introduction Alex Kummant EVP Network
 of A$4.")
12 FOR PERSONAL USE ONLY About Aurizon Network Aurizon Network controls, manages, operates and maintains the fixed rail infrastructure "below rail" assets of the Central Queensland Coal Network (CQCN) Regulated Asset Base (RAB) of A$4.5 billion (1) Rated Baa1 / BBB+ (stable / stable) The CQCN is Australia s largest export coal rail network The CQCN is regulated by the Queensland Competition Authority (QCA) The regulatory framework is designed to provide open access to accredited rail operators (e.g. Aurizon, Pacific National and BMA) and allow a reasonable return on capital to the owner FY2014 key statistics (1) Revenue $1,012m Operating ratio 59.3% EBIT $412m Tonnes Regulated Asset Base 214.5mt $4.5bn Capex $595m Aurizon Holdings Legal Structure 1. RAB is approved roll-forward value excluding Access Facilitation Deed Assets as at 30 June As at 1 September

13 Stable regulated revenue base underpinned by global customers FOR PERSONAL USE ONLY Stable regulated revenue base Strong customer base Current UT4 negotiations The form of regulation is a conventional revenue cap Over 90% of Aurizon Network revenue is from track access payments Access revenue growth and contribution have remained stable over time The CQCN delivers rail infrastructure to over 40 operating coal mines in the Bowen Basin coal region The mines are operated by a global group of coal miners, predominantly large, investment grade companies 2. 20% Increased level of stakeholder engagement Healthy relationship with QCA Continued engagement on maintenance costs All parties agree a fully realised maintenance process is in everyone s interest Aurizon Network at record low delays and record high tonnes 80% 100% Major miners Junior miners Total miners 1. ASX market announcement, Aurizon Network Segment note reinstatement January 13, Based on FY2014 contract volumes 13 13
14 Network Strategy FOR PERSONAL USE ONLY EBIT / ROIC upside Optimised performance under UT4 and strong customer advocates are precursors to unlocking Network value Optimise current business Optimise the current business under UT4 Maximise current revenue sources Develop new revenue sources Unlock latent capacity Realise operating cost efficiencies Optimise capital expenditures Become our customers partner of choice Create value by partnering with above rail operators Recognition of the CQCN as a world leading operation and a robust repeatable formula are necessary precursors to growth in new markets Unlock Network value Realise Network s full potential beyond UT4 Revise supply chain operating model Implement new commercial models Drive broad engagement (industry and government) to facilitate evolution of the regulatory framework Growth in new markets Leverage repeatable formula into future growth opportunities Lift and shift Network s repeatable formula Funding models and governance Follow the customer Services revenues FY2015 FY2017 Time FY
15 We will unlock latent capacity through a relentless focus on availability and utilisation FOR PERSONAL USE ONLY Theoretical Network Capacity Supply Network Time (hours/year) Availability Utilisation Availability Latent Capacity Utilisation Demand Throughput Rate (metres/hour) Train Separation Train Length Train Speed Our focus to unlock latent capacity: Increase Availability - Make the network more available by reducing maintenance time Increase Utilisation - Enable higher utilisation by improving planning and network reliability Our improvement strategies: Availability Reduce closure times Improve maintenance planning Increase maintenance speed Reduce non-value tasks (maintenance start-up time) Train Density (tonnes/metre) Higher Axle Load Closer Axles Throughput (tonnes/year) Utilisation Improve maintenance techniques (quality) Condition monitoring Implement planning technology 15
16 FOR PERSONAL USE ONLY this will be achieved through a series of targeted projects Project New track machines Ballast Undercutting and Resurfacing Network Asset Management System (NAMS) pinpoint needs Advanced Planning and Execution system (APEX) Minor capital projects Electronic Isolation Form less time on track Availability Impact Utilisation Impact Possession and Capacity Evaluator (PACE) Unmanned Aerial Vehicles (Drone) Mobile Welders Process improvement Rail Replacement under live wire / adjacent line Standardised Maintenance Tasks Maintenance Planning Alignment Alternate Zonal Control Progressive hand back track protection authority (TPA) process Cumulative Investment 1 Post GSE 140 & GAPE50 Pre GAPE Capacity increases WIRP1 Capacity Mech Plant Upgrades PACE NAMS & APEX Projects expected to deliver incremental capacity at c25% of the cost 2 of major growth projects 1. Investment from FY2013-FY $m per tonne basis 16

 in terms of key network")
17 Operating cost efficiencies to benefit supply chain Benchmarking Maintenance Costs - ARTC Benchmarking Maintenance FOR PERSONAL USE ONLY Historically our maintenance costs are lower than the most comparable network Cost increase with traffic density and wear. Asset Condition report positive Evans & Peck report favourable ARTC comparison On a cost per track kilometre against system tonnage basis, the unit maintenance costs for the four CQCN systems appear reasonable when compared to the Hunter Valley Coal Network Note: * After review, the closest comparison to Aurizon s systems appear to be the Hunter Valley Coal Network (HVCN) in terms of key network characteristics, freight commodity and traffic hauled Source: Evans & Peck, Operating and Maintenance Costs Investigation and Benchmarking Final report, October 2012 SKM report favourable Best practice is the de facto competitor We will match and exceed industry best practice across all areas of our business by: Lowering unit costs Creating agile, flexible labour force and variable cost Utilising technology to redesign work practices Improving coordination between supply chain participants We will operate under a mantra of continuous improvement and demonstrate value to our customers Success by Network provides above rail performance benefits for all operators, the supply chain and customers 17
18 Network Operations Clay McDonald VP Network Operations
 Aurizon Network's")
19 Aurizon Network Overview Central Queensland Coal Network (CQCN) The CQCN comprises 4 major coal systems and 1 connecting system link serving Queensland s Bowen Basin coal region: Newlands, Goonyella, Blackwater and Moura with GAPE the connecting system link 2,670 kilometres network length of which 1,945 kilometres is electrified Over 40 operating coal mines serviced (1) Aurizon Network's operations are governed by 99 year lease arrangements with the State of Queensland Approximately 69 services per day delivering to five export coal terminals at three ports Open access network with 3 above rail operators Aurizon Operations, Pacific National and BMA Rail 1) Based on Aurizon management estimates as at 30 June
20 Introduction FOR PERSONAL USE ONLY The last three years have been focused on operational performance improvements: Structure Focus Capability In parallel there has been an emphasis on transformation: Modernisation and mechanisation Systems Technology Value Add Increased Network Utilisation Increased Network Availability Unlocking Network Capacity Ongoing Cost Efficiencies 20
21 FOR PERSONAL USE ONLY Our focus is leading to operational performance improvements BR Delays > 15 mins per Service 50-44% FY2011 FY2012 FY2013 Below rail delays (excluding crossings) in minutes FY2014 FY2011 Mainline Derailments FY % FY2013 Cancellations due to Traction Faults -33% FY2011 FY2012 FY2013 FY2014 FY2014 Non-BR Derailments BR Derailments 21
22 FOR PERSONAL USE ONLY Performance improvements are enabling increased Aurizon Network Volumes (mt) network utilisation Network is working to address the biggest capacity consumption factors to increase utilisation of the existing infrastructure: Planned Maintenance Reducing closure times Improving maintenance planning Increasing maintenance speed Reliability Focus on preventative and corrective maintenance Condition monitoring Predictive regime Above Rail Logistics Enable longer heavier trains Planning, scheduling & day of operations optimisation software CQCN supply chain analysis initiative Theoretical Capacity Contracted Capacity % FY2012 Goonyella Blackwater Moura % FY2013 Newlands GAPE % FY
23 Network strategic projects unlocking additional capacity in the future FOR PERSONAL USE ONLY Cumulative Investment 1 Additional Capacity Generated by Strategic Projects Post GSE 140 & GAPE50 Pre GAPE WIRP1 Mech Plant Upgrades PACE NAMS & APEX Our strategic improvement program seeks to unlock capacity within the existing network. A key theme is using technology as an enabler for: Better planning & scheduling Optimised day of operations management Readily accessible quality asset data High production mechanised maintenance fleet Capacity Improved tools and processes in the field 1. Capex from FY2013 FY

24 Effective asset management delivers a sustainable reliable network FOR PERSONAL USE ONLY Asset Management Major asset categories: Civil Electrical Telecoms and Signals Triggers for maintenance and renewal works are defined in the Aurizon Maintenance and Renewal Policy The activity triggers are continuously reviewed to ensure value and network performance Asset Management Benchmarking Performance assessment against PAS55 1 provides guidance on areas of improvement 1. PAS55: Publicly Available Standard on Asset Management 24
25 Effective asset management underpins targeted Asset Renewal Program FOR PERSONAL USE ONLY Asset Renewal Capex 1 FY11 FY12 FY13 FY14 Annual asset renewal capex is in line with US Class 1 railways and a RAB value of $4.5b 2 Program approach and long term planning driving operational and cost efficiencies FY14 Capital Program by Spend Category Total spend is dominated by civil assets scope consistent with current age of assets and renewal triggers in Asset Policies and Civil Engineering standards Mix between products is typical of forward program in near to mid time horizon 1. Asset Renewal capex excluding ballast undercutting and acquisition of other plant 2. As at 30 June 2013 excluding assets under an access facilitation deed 25


26 Which further drives sustainable operational performance improvements FOR PERSONAL USE ONLY 10 incidents to 3 incidents 20% rail wear improvement Reliability Improve asset performance through new technology Safety 10% Obsolescence 11% 5% 74% Telemetry fault 44% improvement End of Life Replacement Culverts repairs Maintain a strong core asset through replacement of assets nearing end of life in a rolling program Timber sleepers replaced with concrete 26


27 We are modernising the way we do standard work SAP Integrated Asset Management System Track Defect Inspection Reporting FOR PERSONAL USE ONLY Whole of life asset management with tools to improve the velocity, access & accuracy of asset information Mobile tablets for real time fault reporting in the field Impact of Technology on Paths Used by Maintenance Activities Current Paths Used GPR Ultrasonic Track Testing Recording Car 96 Hr Runs Forecast Paths Used 27
 / Drones High")


28 with less intrusive inspection techniques improving the quality of asset data Unmanned Aerial Vehicles (UAV) / Drones High definition images Infra-red analysis Use of the drones reduces time required on track for inspections while providing data for preemptive maintenance activities Dewirements and Earthwire Failures FY2012 FY2013 FY2014 FY2015 FY2016 FY

29 FOR PERSONAL USE ONLY The maintenance program is focused on delivering better track performance CQCN is split into North and South regions 6 major strategically located depots 450 maintenance staff in teams focusing on: Maintenance and Response Civil & Track Significant use of specialist contractors & variable labour This has resulted in a decrease in delays > 15min in 3 out of 4 corridors Increased Tonnes Increased Traffic Increased Wear Increased Maintenance Multiple factors need to be balanced to deliver network reliability and throughput Speed Restrictions Weighted SR Forecast Previous 12 Months Average Daily Weighted SR Nov 12 - Oct 13 Nov 13 - Oct 14 0:56:22 0:23:38 Scheduled Preventative Maintenance Tasks with less Track Access FY Day / 90 Day Percentage Tasks Not Done (PTND) FY


 & Capacity intensive")
30 Technology & Systems Better Ballast Management Ground Penetrating Radar Custom Designed for CQCN FOR PERSONAL USE ONLY PVC Category Description PVC range (%) 5 Clean 0 to <10 4 Moderately Clean 10 to <20 3 Moderately Fouled 20 to <30 2 Fouled 30 to <50 1 Severely fouled >=50 New Approach Near continuous recording 2 Million samples Trend data able to be analysed over time Test track panel - Yukan: Calibrated specific conditions vs. Old Method Sampling Standard Approach Manual spot sampling every 500m to 1km samples across network Slow (8 samples per day) & Capacity intensive High risk of sampling error 30


31 Technology & Systems Coal Fouling Prevention Veneering Spray System & Garden Bed Profile Opacity Dust Monitoring Results FOR PERSONAL USE ONLY Total Cost 3.3c per tonne Installation Completed Reduction of coal dust emissions improves the integrity of the network while benefiting local communities in close proximity to rail lines 23 Aurizon and 13 Mine owned veneering stations in operation Veneering can reduce coal dust emissions by up to 75% 31
 Plant Maintenance Resurfacing Fleet 1 Interim Switch Tamper 2 New Switch Tampers 5 New Mainline Tampers Ballast Cleaning Fleet 56 Ballast Wagon Upgrades 6 Spoil Wagon Upgrades")
 Old New - Commissioning New - Projected 600 500 400 300 200 100 0 Old 329 378 540 Mainline Tamping - Metres (per Hour) New - Commissioning New - Projected Ballast Cleaning 600")
32 Modernisation & Mechanisation increased productivity from time on track FOR PERSONAL USE ONLY The Mechanised Maintenance team of 171 FTE consists of: Resurfacing (North & South) Ballast Cleaning (Pre-work & Operations) Plant Maintenance Resurfacing Fleet 1 Interim Switch Tamper 2 New Switch Tampers 5 New Mainline Tampers Ballast Cleaning Fleet 56 Ballast Wagon Upgrades 6 Spoil Wagon Upgrades 8 New Spoil Wagons 3 New Ballast Sidings 1 New Mainline BCM 1 New Turnout BCM Resurfacing Turnouts (per Hour) Old New - Commissioning New - Projected Old Mainline Tamping - Metres (per Hour) New - Commissioning New - Projected Ballast Cleaning Mainline Undercutting - Metres (per Hour) Old New - Commissioning New - Projected 32


33 Systems & Technology Planning and product integration FOR PERSONAL USE ONLY Integrated Planning Integrated Planning optimisation is a key element of world s best practice operation of a complex supply chain. Improvement Strategies Collaborating with GE and Norfolk Southern to leverage Class 1 learnings to optimise Day of Operations management for the benefit of the entire supply chain. Possession Assessment and Capacity Evaluator Balance PACE will implement a quick evaluation of the balance & trade-offs between Network throughput, asset reliability and sustainability and resources allocated. Master Plan 2 Year Plan Tactical Plan 21 Day Plan 7 day / 72 hour plan Day of Operations (DOO) 33
34 Regulation Lana Stockman VP Network Regulation
35 Revenue protection mechanism Aurizon Network s regulated revenue is protected through a combination of contractual and regulatory mechanisms that are included in the Access Undertaking and Access Agreements Take-or-pay mechanisms Primary revenue protection mechanism available to Aurizon Network Aurizon Network receives revenue certainty from Access Holders Access Holder receives long term access rights Revenue cap mechanism Revenue cap ensures that Aurizon Network receives an efficient level of aggregate revenue Shortfall/Over-recovery is socialised across all Access Holders Shortfall/Over-recovery true up mechanism WACC-adjusts Year 2 tariffs Socialisation of counterparty risk Counterparty risk occurs when certain mines are no longer in operation If a counterparty fails, the total allowable revenue will be shared among the remaining users in that system and so Aurizon Network will continue to earn its aggregate regulated revenue 35
36 Aurizon Network s RAB expected to double since IPO QCA determines Aurizon Network's access pricing based on the estimated value of the RAB RAB value of A$4.5bn (excluding assets subject to access facilitation deeds 1 ) as at June 30, 2013, was approved by the QCA on August 29, 2014 Aurizon Network s RAB 1 over time (A$bn) +96.7% 5.9 Value of the RAB determined by: Opening balance Add inflation Add capex Less depreciation UT4 and Standard User Funding Agreement (SUFA) seek to include a pre-approval mechanism for capital investment: Improves timing of assets into the RAB Certainty of capital expenditure approval SUFA pre-approval will assist third party financing options 3.0 FY FY2011 FY2012 FY2013 FY FY Excluding Access Facilitation Deeds these are assets that have the construction cost prepaid by the customer 2. FY2014 RAB indicative only, as per claim prepared by Aurizon Network. Actual value to be confirmed post-qca approval 3. FY2017 RAB is an indicative estimate based on an extrapolation of the QCA s Draft UT4 Maximum Allowable Revenue (MAR Decision (September 2014) 36
37 UT4 Timeline FOR PERSONAL USE ONLY QCA issue UT4 Draft Decision MAR Sept Aurizon Network Response to UT4 2014DAU QCA issue UT3 Draft Decision SUFA 1 Oct Nov QCA issue UT4 Draft Decision Policy Aurizon Network Response to: UT4 Draft Decision MAR UT3 Draft Decision SUFA Dec Aurizon Network Response to UT4 Draft Decision Policy QCA issue UT3 Final Decision SUFA Jan Feb Mar Apr Receive Final Decision 2014DAU May Aurizon Network is working closely with the QCA and Industry to co-ordinate timing and activities to preserve the final determination timetable 1. Standard User Funding Agreement 37
38 QCA MAR Draft Decision 2014 Draft Access Undertaking (DAU) Position QCA Proposal FOR PERSONAL USE ONLY Maximum Allowable Revenue (MAR) Return on Capital (WACC) Headline DAU MAR submitted in April $4.78bn Headline DAU MAR revised in December $4.67B (due to updated forecasts) 8.18% for UT4 (UT3 was 9.96%) Cost of equity of 10.15% Cost of debt of 6.56% Maintenance $1.07bn maintenance cost allowance including allowance for corporate overheads OPEX $899m OPEX based on a combination of stand alone costs; benchmarking and reference to actual costs $307m Traction costs included in OPEX OPEX balance excluding traction is $592m A MAR of $3.88bn ( proposed MAR ) which includes UT3 capital expenditure carryover account adjustments A post-tax nominal (vanilla) WACC of 7.17% Cost of equity of 8.41% Cost of debt of 6.15% A $738m maintenance cost allowance, including: Reductions to ballast undercutting Reductions to indirect costs and corporate overheads Transfer of corporate overheads to operating expense Other maintenance activity direct costs largely approved A 15.4% decrease in operating cost allowance to $761m Corporate Overhead reduction represents 61% of proposed decrease $307m Traction costs retained based on further review OPEX balance excluding traction is $454m Return of Capital (Depreciation) Depreciation allowance ranged from $270m in FY14 increasing to $349m in FY17 Proposed to apply weighted average mine life (WAML) policy to all assets Depreciation allowance ranged from $271m in FY14 increasing to $369m in FY17 Rejected WAML approach 38
39 Beyond UT4 FOR PERSONAL USE ONLY Stakeholder Engagement Costing Processes Rail Regulatory Reform UT5 Strengthen stakeholder engagement focus to build trust and credibility - Miners - Operators - Legislators Engagement of transparent cost build up processes for both maintenance and opex Transition to full standalone bottom up cost build Rail regulatory reform in conjunction with stakeholders, for example: - Short term transfer mechanisms to increase utilisation in the short term - Review Take or Pay arrangements - Realistic risk-reward incentive mechanisms to improve throughput, reduce costs and encourage investment from broad funding pool Work with stakeholders before lodgement to reduce timeframes Provide greater alignment with stakeholder needs 39
40 Capital Expenditure and WIRP Pam Bains VP Network Finance
41 Network s capital expenditure FOR PERSONAL USE ONLY Major Growth Projects Completion / Estimated Completion 1 Construction Period (years) Total Capital ($m) Capacity Increment (mtpa) GAPE January , WIRP 2 March 2015 / December Hay Point (second road) 1 April Notes On time, on budget On track, on budget On track, under budget Rolleston Electrification 2 December N/A 3 On track, under budget Capex ($m) FY2014 FY2015 FY2017 Expected Projected Growth 336 ~400 4 No major projects committed beyond the above at this date Sustaining 259 ~800 5 ~ p.a. Total 595 ~1,200 ~ p.a. Network has strong capability in delivering major projects on time and on budget Capital expenditure to decline with no new growth projects committed at this point in time 1. Completion of Aurizon Network works 2. Current Estimate Project currently under construction 3. Electrification works only No increased capacity 4. The majority of this expenditure is on existing projects such as WIRP, GAPE and Rolleston 5. Excludes Rail Renewals 41
 $858m investment in new and upgraded infrastructure in the Blackwater and Moura systems The Scope of Works has been")
42 WIRP Fast Facts FOR PERSONAL USE ONLY Wiggins Island Rail Project (WIRP) Stage 1 will facilitate transport of 27mtpa of coal to the new Wiggins Island Coal Export Terminal (WICET) 33% increase in export tonnage transported in the Blackwater and Moura systems (81mtpa to 108mtpa) $858m investment in new and upgraded infrastructure in the Blackwater and Moura systems The Scope of Works has been divided into 6 segments (see following slide) Customer Mine Below Rail Aquila Washpool 1.6 Bandanna Springsure Creek 4.0 Caledon Cook 4.0 Cockatoo Baralaba 3.0 Northern Energy Customer 0.5 Wesfarmers Curragh 1.5 Yancoal Yarrabee 1.5 Glencore Rolleston 10.9 TOTAL STAGE Mtpa 1. Source: Companies Annual Report 42
43 WIRP Project Status WIRP1 is currently being delivered on time and within budget with three of six stages already complete FOR PERSONAL USE ONLY Segment Scope Delivery Status Segment 1 WICET Balloon Loop Segment 2 NCL Segment Segment 3 Moura East Segment 4 Blackwater Duplications Construction of a 13km single rail loop Construction of a WICET Spur line, Aldoga Holding Road and 2 Kabra Holding Roads Upgrades to the Moura Line up to the Moura mine spur line Duplication of 7 single line sections of the Blackwater system Aurizon Network works completed in May 2014 Expected completion in October 2015 Commissioned in August of the 7 duplications commissioned Remaining 4 duplications expected to be commissioned October 2015 Segment 5 Bauhinia North Upgrades to the Bauhinia branch line Commissioned in May 2014 Segment 8 Moura West Upgrades to the Moura corridor between the 180km and 186km mark on the Moura line Expected to be commissioned by March
44 WIRP Returns FOR PERSONAL USE ONLY Regulated Returns WIRP regulated returns are recovered under the Access Agreements that Network must enter into with each WIRP customer or the WIRP customer s haulage provider It is proposed in UT4 that WIRP infrastructure be included in the Blackwater and Moura asset bases (RAB) this is on the basis that its inclusion will bring the Reference Tariffs down WIRP Fee WIRP Fee is a non-regulated return for 19.5 years and is subject to adjustment predicated on Network s performance against time and budget WIRP fee is not impacted by forecast volumes BUT there are adjustments if Network fails to deliver capacity Appropriate security in place to mitigate credit exposure WIRP fee WIRP fee WIRP Fee On Time saving 1 month late ± 2.5% contingency overrun 2 months late As costs increase or decrease above or below 2.5% of Target Cost, WIRP fee is adjusted 3 months late 1st Milestone Date Impact of Delays 2nd Milestone Date 44
45 Above Rail Operations Mike Franczak EVP Operations
 guidance only based on a 10.")
46 A range of identified operational improvements will drive margins and ROIC past near term annual targets FOR PERSONAL USE ONLY Note: Implied Return on Invested Capital (ROIC) guidance only based on a 10.5% average ROIC for three years ROIC and operating ratio projections are illustrative only 46 46
47 Transformational capital is a critical component of the multi year spend and improvement plan Transformational Renewal Growth FOR PERSONAL USE ONLY Information technology (FMT 1 ) Fuel and operating technology Rollingstock Maintenance transformation Yard terminal optimisation ~$300M Upgrading Fleet upgrades Improved fleet ratios (i.e. 3 AC electrics for 5 DC electrics) Lease replacements Fleet modernisation and standardisation ~$250M Basic Rollingstock overhauls Facility and yard investment ~$250M Fleet expansion Facilities expansion ~$300M Operations capital spend over the next three years Benefits of transformational capital to drive annualised run rate of ~$60m by FY18. Average payback within 5 years 1. FMT = Freight Management Transformation Note: Capital figures shown are for FY15 FY17 and exclude capitalised interest 47 47


 Improved yard and terminal productivity Enhanced planning and scheduling Elimination of manual processes Real time reporting and analytics nationwide Standard suite of reports")
48 FMT- Technology is helping Aurizon re-engineer its contract to cash process to drive leading edge improvements Benefits of FMT FOR PERSONAL USE ONLY What is FMT? A world class Transportation Management Solution with end to end visibility across the supply chain Will replace 18 legacy systems with a single integrated platform Existing systems are end of life, expensive to maintain and in critical need of replacement Current state Future state Introduces a streamlined order-execution process across the nation (single source of truth) - Will standardise business processes across the business Initial roll out in North-West Queensland is currently scheduled for mid 2015 Full national roll out is anticipated in 2016 Self-service customer portal Standard business processes resulting in a rationalisation of resources Visibility of orders along the supply chain on demand Simplified settlement to cash process Improved revenue quality Standardised and timely billing process Real time data on performance and status of services Ability to prioritise services based on operational data to maximise financial gain Ability to accurately estimate delivery and pick up times Nationwide view of services, performance and plans Schedules available in advance Improved operational planning (reduction in turnaround time, fewer shifts and fewer labour hours) Improved yard and terminal productivity Enhanced planning and scheduling Elimination of manual processes Real time reporting and analytics nationwide Standard suite of reports supporting more informed decision making and increasing operational efficiencies Assist Aurizon to meet customer demand 48 48

49 Aurizon will continue to improve fuel consumption towards Class 1 levels FOR PERSONAL USE ONLY 49 49


50 FOR PERSONAL USE ONLY Four key initiatives will drive consumption rates to class 1 levels Driver Advisory System (DAS) What is it? On-board technology that provides real time information to drivers DAS currently equipped to 99% of lead locos in Queensland fleet Benefits Safety and fuel benefits by maintaining correct speed profile for set section run times Better handling of trains with more awareness of fuel consumption Locomotive Block Upgrade What is it? Retrofitting proven technologies to existing locomotive fleet Fuel Link What is it? Live data on locomotives enabling better performance management - Notch - Speed - Fuel levels Benefits Standardisation of driver methodology Improves driver fuel awareness Compliance to engineering directives Reduces fuelling events Auto Engine Start Stop (AESS) What is it? Automatic shut down of a locomotive when a predetermined idle time has been exceeded Benefits Improvements in fuel usage and maintenance by smoother brake and throttle use Provides accurate information of consists Benefits Reduced idling when not in use Reduced fuel consumption Safety enhancements 50 50


51 Key initiatives in the Rollingstock Maintenance transformation are underway FOR PERSONAL USE ONLY New initiatives Underway Fleet reduction and rationalisation Wheelshop Centre of Excellence Condition Monitoring Technology Facilities rationalisation Policies and practices Materials reduction Labour reduction In train repair Focus on reliability and availability 3 wheel shops to 1 highly automated shop in Qld ~$10m per annum opex savings 159 wheels per annum per FTE to 500 wheels per annum per FTE More productive workforce finders become fixers Maintenance regime changes from reactive, prescriptive to predictive and condition-based Improved safety, productivity, capacity and unit costs Let s have a look 51 51


52 FOR PERSONAL USE ONLY Equipment condition monitoring changes the way we work and improves service, safety and productivity Condition monitoring key facts RSM currently executes a time based maintenance program Rollingstock must be stopped and physically examined Maintenance issues are only identified during these physical examinations Condition monitoring technology will automatically inspect Rollingstock each cycle and predict when component failures will occur Maintenance and on train repairs will be driven through predictive analysis Maintenance resources are better utilised to improve service and quality Physical Inspections Reduces the requirement for physical inspections of wagons Materials Improves component utilisation, and reduces associated footprint Assets Improves asset reliability and availability In service failures Reduces likelihood of in service failures and improves customer service 52 52
53 Investment in Rollingstock Maintenance transformation to drive improvement in core metrics Maintenance cost ($/Net Tonne Kilometre) Maintenance headcount (FTE 1 ) Key Maintenance metrics FOR PERSONAL USE ONLY -34% 2,618-45% 1, Availability 2 Reliability (Faults per loco per year) 3 FY10 FY14 FY17 FY10 FY14 FY17 0 FY10 FY14 FY17 1. FTE = Full Time Equivalent 2. Availability metric reference left axis in whole numbers. Is illustrative of a specific locomotive class (3700/3800s) in Goonyella and Blackwater systems 3. Reliability metric reference left axis in %. Is illustrative of a specific locomotive class (3700/3800s) in Goonyella and Blackwater systems 53 53


54 Targeted capital investment in our IOP and reduced terminal footprint delivers improved value FOR PERSONAL USE ONLY Capital requirement to maintain current state with minimal benefit Requirements Significant maintenance spend to continue operations - Renewal of expiring track, turnouts and hardstand - On going treatment of landfill and drainage Limited ability for growth Minimal technology improvements Short trains, excessive shunting Additional investment will enable step change in improvement for future state Outcomes of consolidation Provides operational benefits - reduce shunting, transfers between yards Ability to run longer trains Supports future growth Reduced dwell time Improved productivity via technology improvements Reduced network access costs Note: NCL = North Coast Line 54 54
 is delivering: - Reduced Sydney Perth transit times (-20%) - Increased")
 - Rollingstock Maintenance transformation - Fuel - Terminal improvements Total market size 1 ~$8.84B 1.")
55 FOR PERSONAL USE ONLY The IOP and other programs are improving unit costs and capacity in our Intermodal business 26% Aurizon Intermodal business Intermodal market 5% Road Other Rail Aurizon Rail National reach Example: With a flat cost base and reduced assets, the Integrated Operating Plan (IOP) is delivering: - Reduced Sydney Perth transit times (-20%) - Increased North South services (+20%) Creates capacity to facilitate growth opportunities Aurizon to drive further improvements in unit costs and capacity through: - Freight Management Transformation (FMT) - Rollingstock Maintenance transformation - Fuel - Terminal improvements Total market size 1 ~$8.84B 1. Based on road and rail modes of Intermodal freight transport; excludes sea freight 55 55

56 IOP, fleet modernisation and standardisation will lower basic replacement requirements below attrition rate FOR PERSONAL USE ONLY Aurizon s fleet retirement and replacement profile Insights Aurizon s fleet has an age profile that requires overhaul or replacement in the upcoming years Operational efficiencies driven by the IOP have lowered replacement requirements below attrition rate Overhaul and fleet replacement will drive significant operational benefits through modernisation, standardisation, improved HP per tonne and lower maintenance requirements Aurizon will continue to assess investment decisions subject to returns and commercial arrangements including evaluation of life extensions, overhaul or replacement 56 56
57 Q&A
58 Investor Briefing Driving Value Day 1 27 October 2014
59 Investor Briefing Driving Value Day 2 28 October 2014
60 Agenda Performance of Aurizon Network Operations VP Network Operations Clay McDonald Network Planning, Scheduling and Execution GM Network Operations, Central Queensland Coal Network Sarah Dixon Control Centre Tour Control Centre Manager Darryl Johnson 60
 Regulatory framework is designed to provide OPEN access to accredited rail operators Facts and figures in this presentation relate to all accredited rail operators and not")
61 About Aurizon Network Controls, manages, operates and maintains the fixed rail infrastructure below rail assets of the Central Queensland Coal Network (CQCN) CQCN is regulated by the Queensland Competition Authority (QCA) Regulatory framework is designed to provide OPEN access to accredited rail operators Facts and figures in this presentation relate to all accredited rail operators and not just Aurizon 61
62 Performance of Aurizon s Network Operations Clay McDonald VP Network Operations
 1,110 260 980 320 2,670km Electrified track 965 0 980 0")

63 Central Queensland Coal Network Fast Facts Assets Blackwater Moura Goonyella Newlands CQCN Track (km) 1, ,670km Electrified track ,945km Rail 2, , ,340km Turnouts T/O Culverts 1, , ,743 Bridges Sleepers million 63
64 Blackwater system overview System consists of: 14 mines 2 export coal terminals 4 domestic unload locations 335 kilometres (208 miles) of single line track 242 kilometres (150 miles) of duplicated track Average train size is 4 locomotives and 99 wagons hauling 8,040 tonnes of coal From FY2010 to FY2014, average payload increased in Blackwater by 7% with longer train consists a key contributor to this. FY2014 AVERAGE FYTD2015 AVERAGE WEEKLY TRAINS WEEKLY TONNES WEEKLY CYCLE TIME RECORD
65 Moura system overview System consists of: 4 mines 2 export coal terminals 4 domestic unload locations 266 kilometres (165 miles) of single line track Average train size is 3 locomotives and 83 wagons hauling 6,000 tonnes of coal From FY2010 to FY2014 average payload increased by 27% in Moura FY2014 AVERAGE FYTD2015 AVERAGE WEEKLY TRAINS WEEKLY TONNES WEEKLY CYCLE TIME RECORD
66 Goonyella system overview System consists of: 20 mines 2 export coal terminals 1 domestic unload location 634 kilometres (394 miles) of duplicated track Average train size is 3 locomotives and 120 wagons hauling 9,820 tonnes of coal From FY2010 to FY2014 average payload increased by 2% in Goonyella WEEKLY TRAINS WEEKLY TONNES WEEKLY CYCLE TIME FY2014 AVERAGE FYTD2015 AVERAGE RECORD
67 Newlands system overview FY2014 AVERAGE FYTD2015 AVERAGE WEEKLY TRAINS WEEKLY TONNES WEEKLY CYCLE TIME System consists of: 4 mines 1 export coal terminal 3 domestic unload locations 187 kilometres (116 miles) of single line track Includes Goonyella to Abbott Point Expansion (GAPE) Average train size is 3 locomotives and 81 wagons hauling 6,500 tonnes of coal From FY2010 to FY2014 average payload increased by 35% in Newlands, excluding GAPE. RECORD
68 Network Operations on a page Teams Responsibilities KPIs Projects and Initiatives Value Add Asset Management Maintenance Plant Planning Maintenance and Renewals Assurance Strategy for Civil, Signals, Telecoms and Electrical assets Infrastructure, Signals, Traction, Control and Communications Systems Extreme weather preparation Preventative maintenance Resurfacing Ballast Cleaning Maintenance of Plant Strategic system planning System planning principles Closure optimisation Delays > 15 mins Capital program Maintenance $ per NTK Cancellations Speed restrictions SPADs² Derailments Scope & Cost Utilisation of Capacity Network Asset Management System (NAMS) Track Recording Vehicle (TRV) Track Access System (TAS) Electric Lubricators Remote Monitoring Devices Mechanisation Fleet Replacement Program Off-Track Initiatives Ballast Veneering Ballast Recycling Possession Assessment and Capacity Evaluator (PACE) Adjacent Maintenance Activities Increased Network Utilisation Increased Network Availability Unlocking Network Capacity CQCN Operations³ Control Centre management Critical capacity planning Scheduling of access paths Performance analysis Scheduled to Completed Services % Velocity Advanced Planning and Execution System (APEX) Optimal Mine-Port Scheduling Ongoing Cost Efficiencies 1. Total Reported Injury Frequency Rate 2. Signal Passed At Danger 3. Central Queensland Operations 68
69 Network Operations Key Focus Areas Deliver maximum system through-put at the lowest total cost of operation both safely & sustainably Safety We are actively working towards a Zero Harm environment We are reducing: - Network cancellations - Network delays - CQCN turnaround time Reliability Volume We provide capacity for our customers & company to be successful We focus & understand the cost of business Cost People We have the right skills, in the right place and positively contribute to the success of the company & each other 69
70 Focusing on Improving the Run Rate 1 800, , ,000 tonnes 500, , , , ,000 0 FY10 H1 FY10 H2 FY11 H1 FY11 H2 FY12 H1 FY12 H2 FY13 H1 FY13 H2 FY14 H1 FY14 H2 FY15 Q1 Record (7 Sep 14) Notes 1. Average daily CQCN volumes for each six month period 70
71 Less wear, longer life New Rail Network expects to achieve a 15% reduction in the total cost of ownership of its rail assets in Central Queensland as a result of the superior performance of the new rail 71


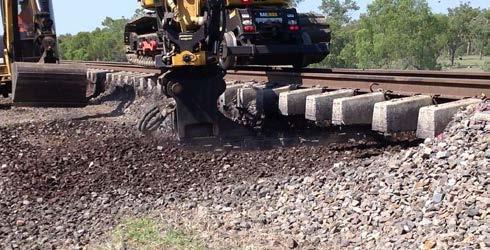
72 Innovative sleeper design Traditional Timber and Concrete Sleepers Composite Sleepers Allows like-for-like replacement of timber turnouts Improved total cost of ownership: o Greater service life o Lower maintenance requirements o Stronger and more consistent engineering properties o Easier to procure for turnout lengths required o Manufactured to exact dimensions required o Can be drilled and cut like timber allowing existing fixings to be used o Lighter than concrete allowing simpler and safer lifting plans 72

, Green (stone removed) Interlockings and Housings 6%")


73 Remote Points Monitoring Train Protection Systems 1% Lamp Failure 3% Other 3% Crossings 5% Signalling Fault by type Train Control System 0% JB11C SNX current draw - Red (stone in rodding), Green (stone removed) Interlockings and Housings 6% Points 33% Points Tracks Signals 8% Axle counter Signals Interlockings and Housings Crossings Other Lamp Failure Axle counter 9% Train Protection Systems Train Control System Tracks 32% Several current draw events from BR8A points showing bad ballast conditions 73


74 Operational Technology Supersite Program Site to include: Wheel impact detectors Inline weighing system Hot and cold bearing detectors Pantograph monitor Below rail predictive equipment Supersite Location WILD (Wheel Impact Load Detector Client Screen) -> 74
75 Supersite Strategy Main Line Pantograph Inspection Wheel Impact Load Detector Main Line Weighbridge Rollingstock Condition Monitoring Space for future systems (Network, Rollingstock, PN, BMA etc) 75


76 Improved mechanisation leading to velocity improvements 76
77 Network Planning, Scheduling & Execution Advanced Planning and Execution System (APEX) Sarah Dixon GM Network Operations CQCN
78 Presentation outline 1 Managing Australia s largest export rail network 2 Network Operations CQCN on a page 3 Network Operations CQCN strategy and vision 4 Network Operations CQCN activities 7 outcomes 5 Planning and scheduling 6 Day of Operations 7 Business systems and improvement 8 Recent transformation 9 APEX: Implementing tool to provide benefits for the entire coal supply chain 78

79 Managing Australia s largest export rail network Managing track access to 2,700km of rail network with 1,800kms of overhead equipment Loading at 44 mines Delivering to 5 export coal terminals and 7 domestic customers Communicating with 6 Rail Operators 5 year tonnage profiles showing continued growth Customers actively seeking opportunities to improve their supply chain outcomes Increased complexity (greater mine/ port combinations) and volumes Reducing windows for maintenance and renewals A growing and increasingly complex supply chain requires investment in people, processes and tools. 79
80 Network Operations CQCN on a page Teams Responsibilities KPIs Transformation Value Add Planning & Scheduling 4 x 6 month Closure Calendar and Capacity Forecast Alignment of maintenance activities across supply chain Scheduling of services Utilisation of capacity Planning Reset Process Review APEX¹ Planning & Scheduling module Increased Network Utilisation Day of Operations (DOO) Execution of plan in live run Safeworking standards for train operations Incident management for CQCN DOO losses Cancellations Business Execution Rules Simulator APEX Movement Planner Foundation and Advanced modules Improved Performance to Plan Business Systems Performance review and monitoring for CQCN Opportunity identification Implementation of operational improvements Average System Velocity CQCN Supply Chain Transformation Program APEX Business Objects reporting tool Unlocking Network Capacity Business Improvement Internal transformation and continuous improvement Customer and Stakeholder communications for Network Operations Customer satisfaction Network Operations CQCN Business Improvement Program Ongoing Cost Efficiencies 1. Advanced Planning and Execution 80


81 Network Operations CQCN Strategy & Vision Network Operations CQCN Vision for FY16 is that we are valued partners in our supply chains through: To achieve this vision, we consistently act in line with our five Golden Rules: World class results that are mutually beneficial Profitable growth by being efficient and agile in the way we deliver and predictable in what we deliver We deliver on our promise We communicate early and regularly Seamless contribution so our customers can focus on their core business as they trust us to deliver ONE team both internally and externally, with intuitive ways to work together A position of family to work with trust, community and resilience as we look out for each other We work as 'one supply chain team' Our five Golden Rules We look after each other We align our goals within our team and with our supply chain partners 81
 Scheduling access paths in")

82 Network Operations CQCN Activities & Outcomes Capacity Planning Tactical Planning Short Term Planning Scheduling Day of Operations (DOO) Performance Review Main activities for Network Operations CQCN: Critical Asset Activity and Capacity Planning (with respect to long term capital programs, network maintenance, port availability, operator and producer requirements) Scheduling access paths in response to Rail Operator requested services Train Control Operations in live run Network Performance Analysis and Supply Chain facilitation Communication of Network Operations events and outcomes to Customers and wider Supply Chain Stakeholders Outcomes achieved: Improved alignment of maintenance activities across Supply Chain service providers Reduced capacity impact from planned maintenance and renewals Improved delivery to plan and reduced day of operations losses Continued management of supply chain improvement programs across CQCN Increased engagement with Rail Operators to identify and implement opportunities to improve velocity and volume throughput 82
; Tactical (6mths - 21days); and Short term (21 day, 7")

 Producing Train Diagrams")

83 Planning & Scheduling Weekly Path Availability Team size: 23 staff in Mackay and Rockhampton Capacity Forecast Planning Horizons: Long term (1-2yrs); Tactical (6mths - 21days); and Short term (21 day, 7 day, 48 hrs & 24 hrs) Main Activities: Balancing track possession bids from Network Growth, Renewal & Maintenance Infrastructure Programs with demand forecasts from customers Providing pathing availability to Rail Operators Optimising throughput and minimising variation through System Rules Negotiation process for contested pathing (Access Undertaking Schedule G) Producing Train Diagrams that consider crossings, crew changes, loading, unloading, stows, dwells Review of Plan effectiveness with Day of Operations to identify areas for improvement Network Operations Pathing Planner Train Control Diagram 83


84 Day of Operations Team size: 108 staff in 24/7 live run environment of Network CQCN Control Centre, based in Rockhampton 18 staff in Jilalan, Callemondah and Gladstone yards 7 staff based across CQCN Main activities: Managing train movements and track access and possessions to plan Ensuring safeworking standards are enacted through live run Managing electrical overhead network across Goonyella and Blackwater Providing telemetry and signalling incident response through Fault Coordination Centre Managing train movements through yards Coordinating recovery efforts from incidents on CQCN Undertaking Incident Commander role in line with Aurizon Network s Crisis Management Plan Working with other supply chain stakeholders to identify recovery to plan in live run Fault Control Centre Area Controller Consolidated Control Centre 84


85 Business Systems and Business Improvement Team size: 16 staff across Brisbane, Rockhampton and Mackay Main activities: Analysing and reporting on performance across CQCN Identifying opportunities to improve volume throughput or increase velocity Implementing change through disciplined project and program management approach Clear communication to customers and wider CQCN supply chain stakeholders Facilitating external Supply Chain forums and Improvement Programs across Supply Chain service providers System Performance Report Supply Chain Improvement Initiatives Report Stakeholder Communications 85
 Implementation of consistent planning tools across CQCN")
86 Network Operations CQCN Transformation Recent Transformation Activities Consolidation of Mackay and Rockhampton based Control Centres to form CQCN Control Centre in Rockhampton (2011) Consolidation of Network Operations North and South to form Network Operations CQCN with restructure of leadership, planning and business system teams (2013) Implementation of consistent planning tools across CQCN (2014) Review of Business Execution Rules and implementation across all Rail Operators and Ports (2014) KPI reporting to Rail Operators and Supply Chain Forums implementation (2014) Remaining Business Need Support planning and execution with increasing complexity More mine to port combinations Increased volumes Better utilisation of capacity and existing asset More trains, maintenance and track activity Further reduce Day of Operation losses through decision making with full system view vs individual sections Replace manual processes and legacy inhouse systems Provide integrated solution from long term planning, to scheduling and day of operations Platform for auto routing 86


 Performance Dashboards (plan v s actual) Recovery to Plan")
 introduced real time Day of Operations management software in 2012 using")
, improved adherence to schedule (from 62 min late to 25 min early) and")
87 APEX Advanced Planning and Execution APEX is a transformational tool integrating industry proven technologies into a single solution to optimise planning, scheduling and day of operations for the Central Queensland Coal Network Network Forecasts and Planning Plan and Schedule Generator Real-Time Planning Support Conflict Resolution & Optimization Day of Operations (DOO) Supply Chain Optimisation Forecasts / Plans (2 years to DOO) What-if opportunity analysis Plan to Schedule creation and optimisation Business rules embedded into solution Real-time train movement (interactive graphs) Conflict detection and resolution (manual > automated) Performance Dashboards (plan v s actual) Recovery to Plan with CQCN impacts consideration Real-Time Traffic Management Norfolk Southern (US Class 1 railroad company) introduced real time Day of Operations management software in 2012 using the same technology as APEX. They are now seeing increases in train velocity (10.1% increase), improved adherence to schedule (from 62 min late to 25 min early) and reduced crew expiration (57% reduction). 87
88 APEX delivered in three phases Now Movement Planner (Foundation) Release 2 Planning & Scheduling Release 2 Movement Planner (Advanced) Movement Planner (Foundation) Electronic time-distance graphs Decision Support for recovery and management of variations Improved performance to plan Real time integration of scheduling and execution Planning & Scheduling Network plan and schedule optimization Improved forecast accuracy Scenario modelling / what if analysis Customer web portal Movement Planner (Advanced) Automated conflict resolution/ problem solving Improved decision support capability and responsiveness Consistent, reliable and repeatable execution Total Budget: $32.3m Spend to Date: $11.5m Full cost will be included in the Regulated Asset Base 88


89 Visible change from APEX Paper Train Control diagrams are currently used by Network Controllers Paper Train Diagrams currently used These are created through manual manipulation of templates to find a best fit for services requested by Rail Operators APEX will replace paper diagrams with electronic interactive train graphs These have a 12 hour forward view and will flow any live run changes across all impacted boards within the Control Centre in real time The Quintiq planning and scheduling system will create the Schedule which feeds into GE s Movement Planner Day of Operations engine In future, this will be able to review the schedule and re-optimise the plan if required APEX Electronic Interactive Train Graphs 89
90 Benefits & opportunities for the entire coal supply chain APEX integrates across Network long term planning to scheduling and day of operations execution to provide throughput, customer satisfaction & planning efficiency benefits. KPIs Throughput Utilisation Increase in On Time Port Arrival, Velocity, Network Volume and Asset Activity. Reduction in DOO losses. Capacity Increase in Theoretical Rail Network Capacity Benefit Dimensions Customer Satisfaction Planning Efficiency Above Rail Operator Orders Met Increase in Scheduled versus Ordered Cost to Plan Efficiency in Planning Schedule Adherence Increase in on Time Performance for Ports Asset Maintenance Requests Met Increase in Scheduled versus Ordered Payload Improvements Increase in average tonnes per consist Value Add Time Efficiency in value add tasks for Planning Financial Return Regulatory Asset Base Inclusion Project Delivery on Budget 90
91 Control Centre Tour Darryl Johnson Control Centre Manager
92 Presentation outline 1 Network Day of Operations 2 Network Operations CQCN Control Centre 3 Network Controller Training 92
 Blackwater (South, Near West, West) Moura 3 x Area Controller teams based at key CQCN")
93 Network Day of Operations Managing 2,700km of network with 1,800kms of overhead equipment Loading at 44 mines Delivering to 5 export coal terminals and 7 domestic customers Communicating with 6 Rail Operators 9 x Control Boards in consolidated Control Centre Newlands Goonyella (West, Far West, Ports, Gregory) Blackwater (South, Near West, West) Moura 3 x Area Controller teams based at key CQCN Yards Jilalan Callemondah Gladstone 2 x Electrical Control Boards Goonyella Newlands 1 x Fault Coordination Centre The coloured lines on the map show the geographic areas managed by each Control Board in the consolidated Control Centre 93

 PortVu")
94 Network Consolidated CQCN Control Centre Manage the interface between coal and freight trains, high and low speed passenger trains, livestock, level crossings, occupational crossings and maintenance works Direct the movement of trains and maintenance rollingstock across the network Network Control plays a critical role in ensuring operations on CQCN are safe and efficient, with a focus on recovery to plan Consistent outcomes achieved through Business Execution Rules Regulatory obligations met through Schedule G Traffic Management Decision Making Matrix Emergency Response/Coordination in line with Network Crisis Management Handbook Provide Day of Operations Customer Interface for Network Operations System tools used include: Network Operations Pathing Planner (NOPP) PortVu Vizirail Universal Train Control (UTC ) Direct Train Control (DTC) Remote Train Overview Application (RTOA) and Systems Control and Data Acquisition (SCADA) Train Controller with RTOA screens 94
95 Network Controller Training Network Control needs to perform highly skilled and safety critical work that carries with it a high level of responsibility The transformation of the Network Controller Training Programme has delivered increased safety and production performance Five key training and assessing phases Recruitment Academic Phase Practical Phase Assessment Maintenance of Competency 4 weeks 20 weeks 8 weeks 4 days ongoing Targeting strong candidates across diverse backgrounds, changing the gender & culture profile within the Control Centre Classroom study complemented with field trips and industry exposure ensures theory is translated into practical application Academic phase is backed up through practical application in both simulated environment as well as live run Assessment covers more than just board competency as trainees are assessed for business fit and alignment with Aurizon values Becoming a qualified controller is just the start of their ongoing journey to world class Aurizon Network Control Training Program

96 Investor Briefing Driving Value Day 2 28 October 2014