Assessment of automated driving to design infrastructure-assisted driving at transition areas
|
|
|
- Richard Ward
- 5 years ago
- Views:
Transcription


1 Assessment of automated driving to design infrastructure-assisted driving at transition areas Dr. Jaap Vreeswijk, MAP traffic management, the Netherlands Tokyo, Japan, November 13-15, 2018 Impact Assessment. This project has received funding from the European Union s Horizon 2020 research and innovation programme under grant agreement No
2 Operational Design Domain (ODD) Everywhere ODD Vehicle capabilities x Geographical domain x Traffic & situational environment = ODD Tom Alkim, Rijkswaterstaat, 2017 Always & All conditions 14/11/
")


3 ODD >> ToC / MRM >> Transition areas (TAs) raining merging Everywhere Always & All conditions Tom Alkim, Rijkswaterstaat, /11/
4 ToC and MRM process (deactivations) MRM minimum risk condition = stop or park safely 14/11/
.")

5 ODD >> ToC / MRM >> TAs >> capacity & flow problems Xiao, L., Wang, M., Schakel, W., & van Arem, B. (2018). Unravelling effects of cooperative adaptive cruise control deactivation on traffic flow characteristics at merging bottlenecks. Transportation Research Part C: Emerging Technologies, 96, /11/


6 When, where, why? permanent - transient static/dynamic - highly dynamic 14/11/
, Autonomous vehicles disengagements: Trends, triggers, and regulatory limitations, Accident")
7 What we know from the field Favaro et al. (2017), Autonomous vehicles disengagements: Trends, triggers, and regulatory limitations, Accident Analysis & Prevention, Vol. 110, pp /11/
8 I2V infrastructure support Vehicle capabilities (A) x Geographical domain (B) x Traffic & situational environment (C) = ODD B + C = A ODD: OK B + C A ODD: NOK B + C = A +? ODD: OK?? = digital connected traffic management 14/11/


9 Project overview TransAID (ART-05) Transition Areas for Infrastructure-Assisted Driving ~ Budget: EUR ,75 Seven partners from 6 countries: DE, UK, BE, NL, EL, ES Website: 14/11/
10 Identifying needs Vehicle logic: Sense and build environmental awareness Ability to determine action(s) Perception Planning Ability to perform action(s) Execution 14/11/
11 Identifying I2V / TM support measures Vehicle logic: Sense and build environmental awareness Situational support: provide information Ability to determine action(s) Operational support: provide an (alternative) action Ability to perform action(s) Tactical support: arrange favourable conditions 14/11/

 Service")

12 Service 1: Prevent ToC/MRM by providing vehicle path information Used in simulation study (upcoming slides) Service 2: Prevent ToC/MRM by providing speed, headway and/or lane advice 14/11/


")


13 Service 3: Prevent ToC/MRM by traffic separation Used in simulation study (upcoming slides) Service 4: Manage MRM by guidance to safe spot Service 5: Distribute ToC/MRM by scheduling ToCs 14/11/
14 Simulation task Step 1: determine baseline situation. What is the impact of ToC / MRM without traffic management measures? SUMO simulation software (which includes PHEMlite emission model). ACC model adopted from previous studies 1,2, with few modifications. Parametrised SUMO s default lane change model. 1. Xiao, L., Wang, M., & van Arem, B. (2017). Realistic Car-Following Models for Microscopic Simulation of Adaptive and Cooperative Adaptive Cruise Control Vehicles. Transportation Research Record: Journal of the Transportation Research Board, 2623, Liu, H., Kan, X., Wei, D., Chou, F.-C., Shladover, S. E., & Lu, X.-Y. (2018). Using Cooperative Adaptive Cruise Control (CACC) to Form High-Performance Vehicle Streams - Microscopic Traffic Modeling (FHWA Exploratory Advanced Research Program No. Cooperative Agreement No. DTFH61-13-H-00013). University of California, Berkeley: California PATH Program. 14/11/
15 ToC model implementation Definition reduced driver performance: random decline in awareness causing perception errors (mainly speed and headway) with certain awareness recovery rate. MRM full stop not included in this project iteration cycle. Assumption ToC frequency: 75% at predefined locations in each scenario. 14/11/
16 Simulation setup Traffic demand: LoS A, B & C Vehicle Mix : 70% manual, 15% partial AD, 15% high AD 50% manual, 25% partial AD, 25% high AD 20% manual, 40% partial AD, 40% high AD Light vehicles only and no connectivity. 14/11/
17 Driver model parameters Driver Model Parameter Name SUMO Parameter ACC (Longitudinal Motion) Desired time headway tau Sub-lane (Lateral Motion) Desired longitudinal gaps lcassertive ToC/MRM Driver response time Post ToC driver performance ToC likelihood (internal and external factors) For each parameter, classification: Value = high, moderate, low With behaviour = conservative, moderate, aggressive responsetime initialawareness responsetime timetillmrm And effect on safety and efficiency: negative, neutral, positive 14/11/
18 Five schemes to test a range of behaviours Parametrization Scheme Pessimistic Efficiency (PE) Pessimistic Safety (PS) Moderate Safety and Efficiency (MSE) Optimistic Efficiency (OE) Optimistic Safety (OS) ACC Lane Change ToC/MRM ToC/MRM ToC/MRM Desired time headway Desired longitudinal gaps Driver response time Post ToC driver performance MRM likelihood Large Large Long Low High Small Short Long Low High Moderate Moderate Moderate Moderate Moderate Small Short Short High Low Large Large Short High Low 14/11/
19 Simulation setup summary 3 demand levels 3 vehicle mixes 5 parameter schemes 5 networks = 225 scenarios KPI Name Average network speed Space-mean speed Total Number of Lane Changes Time-to-collision (TTC) CO 2 emissions (gr)/km 14/11/

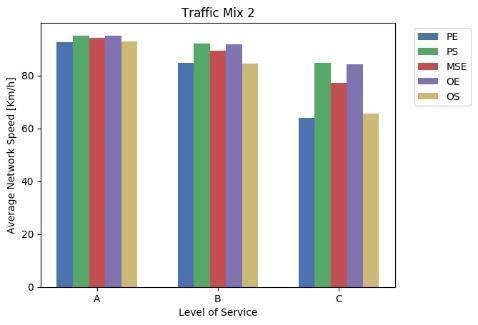
20 Results (example) 14/11/
21 Main findings Work provided first theoretical understanding, especially of the spectrum. By comparison of schemes, lane change behaviour is the dominant factor. Decrease of safety with increase of AD (conservative driving causes inability to merge, thereby sudden braking). Impact of ToC/MRM most disadvantageous at lane drop scenario, therefore merge and/or lane advice measures seem to be promising. Schemes with similar results are those with similar driver model settings. As such, ToC/MRM in current form has little impact on traffic operations. (C)ACC and LC models require further calibration (esp. for selected situations). ToC model needs to be more situational aware, thereby more realistic. 14/11/

22 Future work Driver model calibration. Study time-space diagrams. ToC model enhancement: dynamic rules for ToC activation. Add effects of connectivity. Add other networks. Configure traffic management measures. Include simulation of wireless communication. Last but not least: data from AD field observations and tests is needed. 14/11/

23 EU collaboration - challenges I2V TM at Transition Areas Road infrastructure support levels I2V services for automated driving Traffic control and I2V negotiation Mutual work items Role of traffic management I2V communication City authority involvement Modelling and simulation Automation-readiness of infrastructure Harmonise simulation activities? Driver model parameters Vehicle types & mix Networks KPI s 14/11/
24 Thank you for listening! Are there any questions? Assessment of automated driving to design infrastructure-assisted driving at transition areas Dr. Jaap Vreeswijk, MAP traffic management, the Netherlands Tokyo, Japan, November 13-15, 2018 Impact Assessment. This project has received funding from the European Union s Horizon 2020 research and innovation programme under grant agreement No