Planning for Better Transportation Outcomes: Lessons Learned from Vancouver and Chicago
|
|
|
- Tabitha Jones
- 5 years ago
- Views:
Transcription
1 Planning for Better Transportation Outcomes: Lessons Learned from Vancouver and Chicago Michael J. Shiffer, Ph.D. Vice President Planning, Strategy & Technology TransLink November 22, 2010
2 Foundations
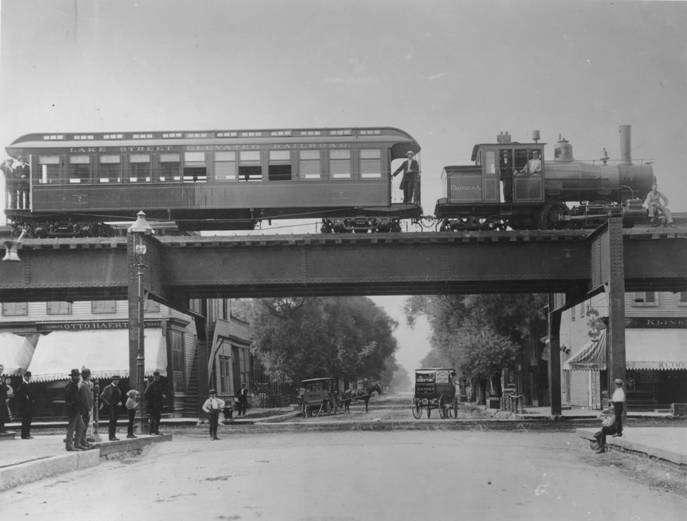
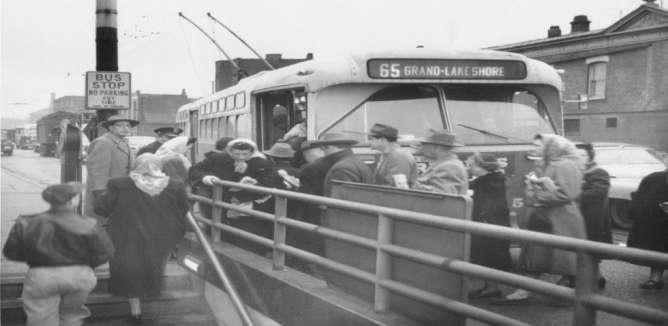
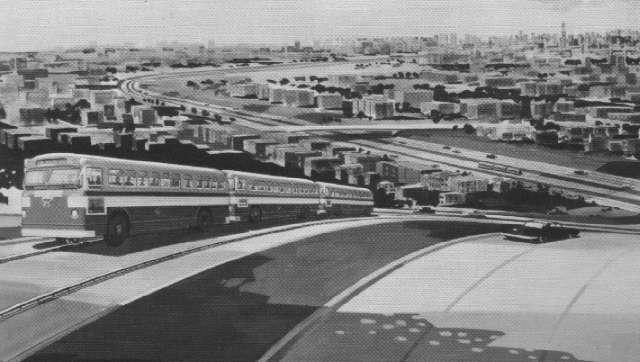
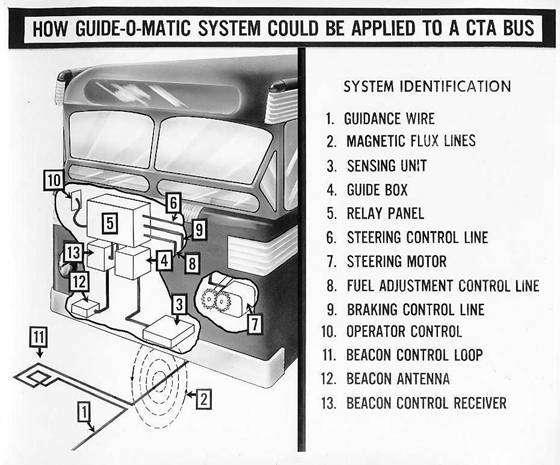
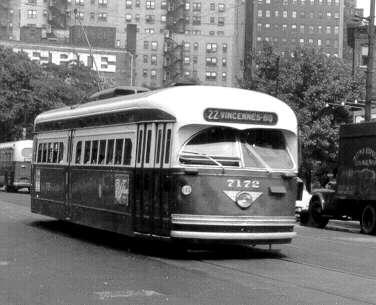
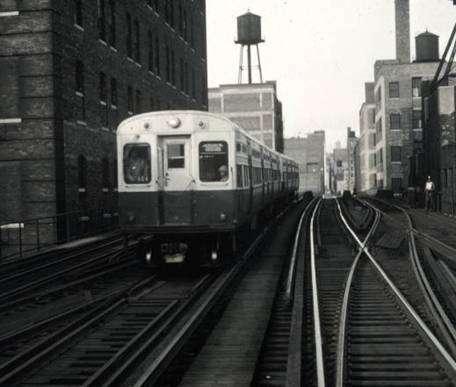
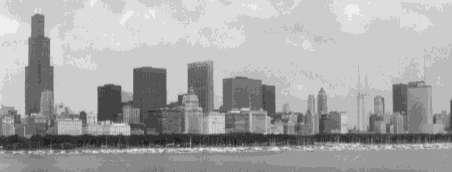
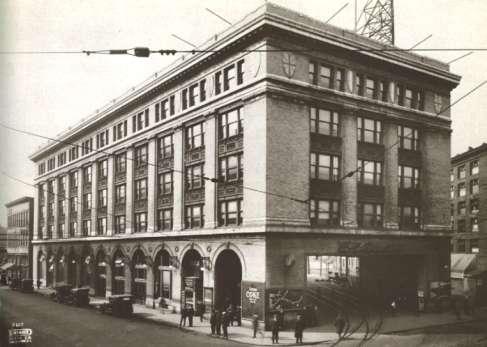
3 Chicago
4
5
6
7

8
9 Academic Background
10 How can we leverage technology to better inform discussions about the future of our communities?
 \"Interactive Multimedia Planning Support: Moving from Stand-Alone Systems to the World Wide Web, Environment and Planning B: Planning and")
11 Monumental Core multimedia visualization for National Planning Commission (c.1992) As described in: Shiffer, M.J. (1995) "Interactive Multimedia Planning Support: Moving from Stand-Alone Systems to the World Wide Web, Environment and Planning B: Planning and Design, volume 22, pp

12 Automobile Level of Service Web-Based Multimedia Visualization Tool for US Federal Highway Administration(c.1996)

13 Urban mass transit web-based multimedia visualization tool for US Federal Transit Administration and USDOT Bureau of Transportation Statistics (c. 1996)
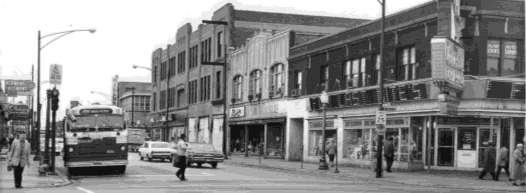
14 The Chicago Experience


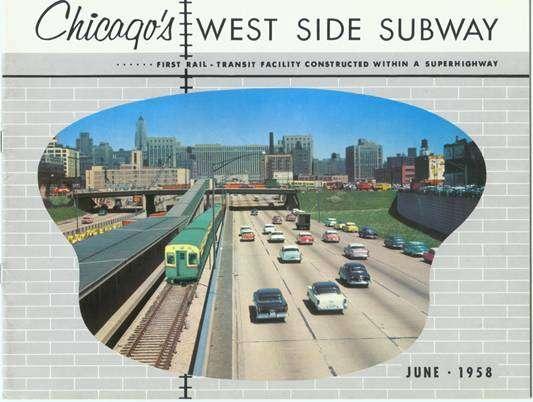
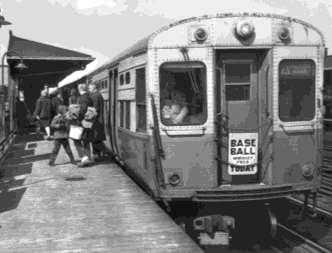
15 Mass Transportation in Chicago CTA- Buses & Rapid Transit for Chicago & 40 Suburbs Metra- Commuter Rail Pace- Suburban Buses Transit Ridership Share CTA 80% Metra 14% Pace 6%
16 Chicago Transit Funding Transit Fare Products Sponsorship Advertising Opportunities Property Transfer Tax Sales Tax Senior Government Grants

17 RTA Funding Allocations

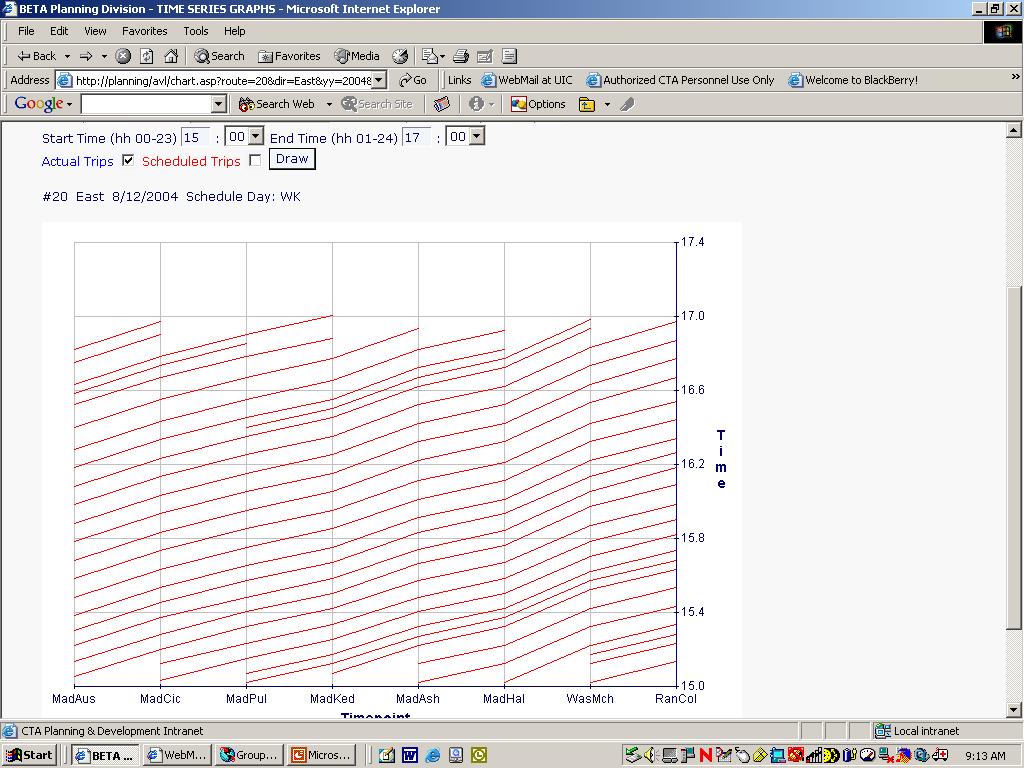
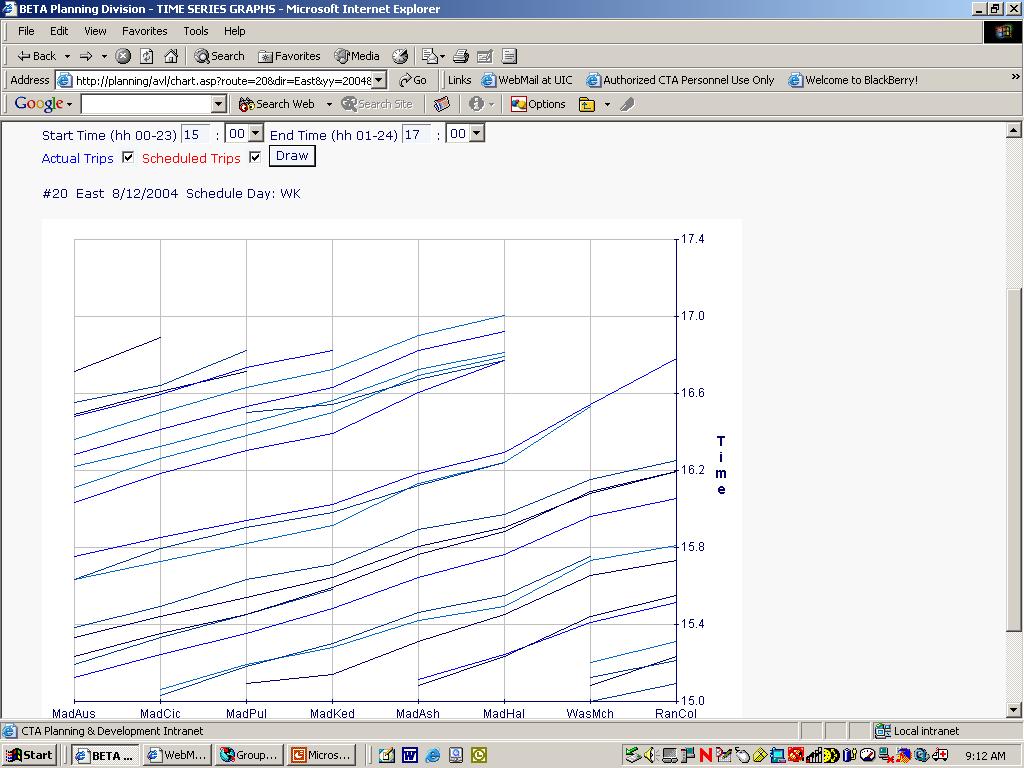
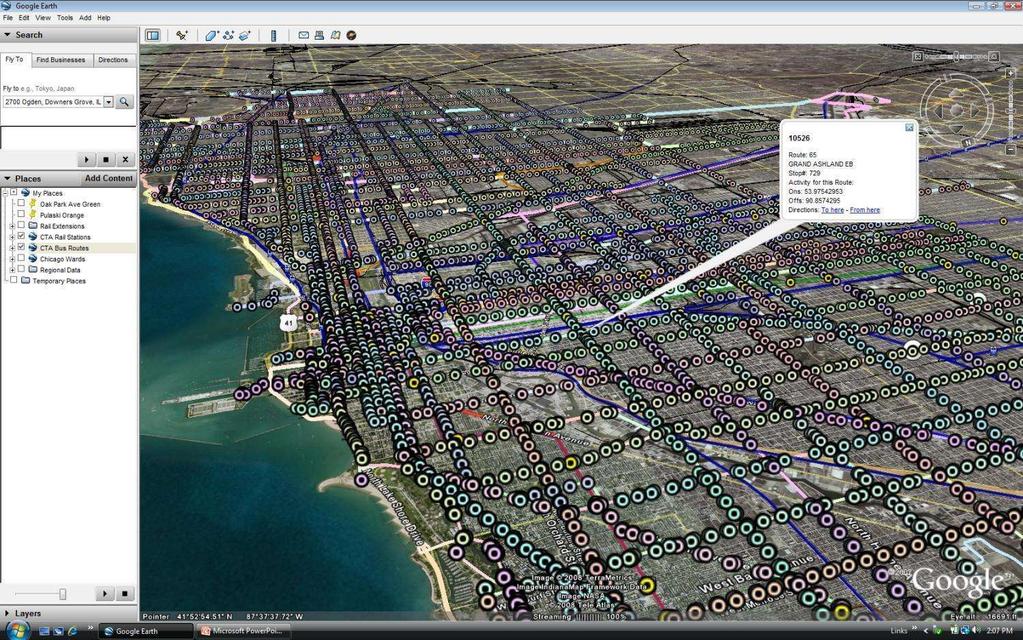
18 Chicago Transit Funding


19 Chicago Transit Authority Challenges Changing Customer Habits Shifting Land Use Manage Capacity Aging Infrastructure Funding
20 Approach Create a systematic process Develop information infrastructure Develop human capital Support discourse by leveraging technology
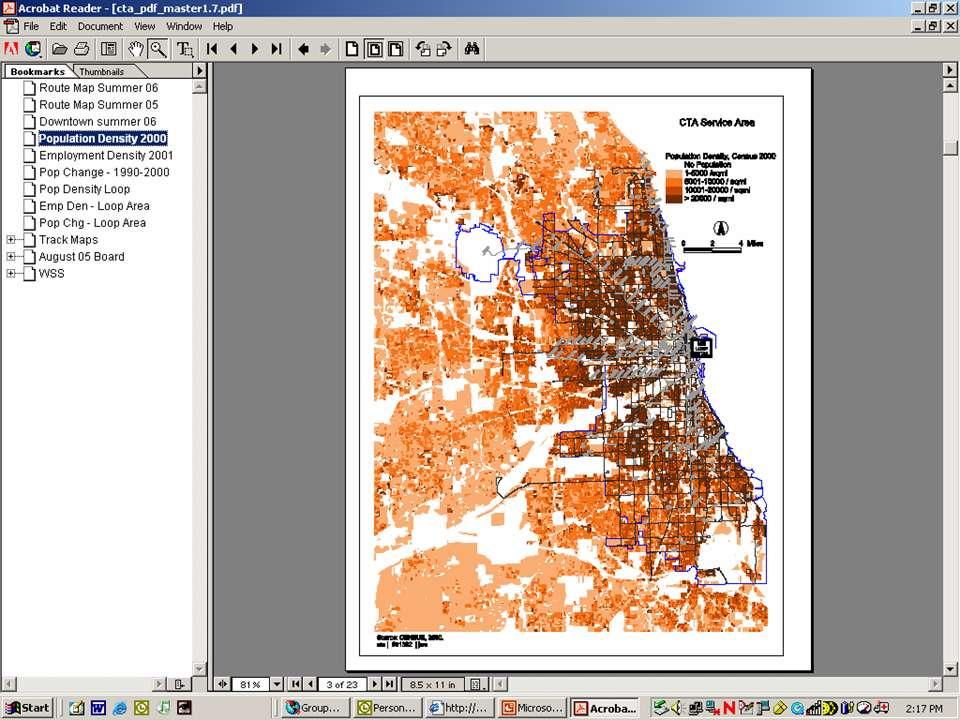
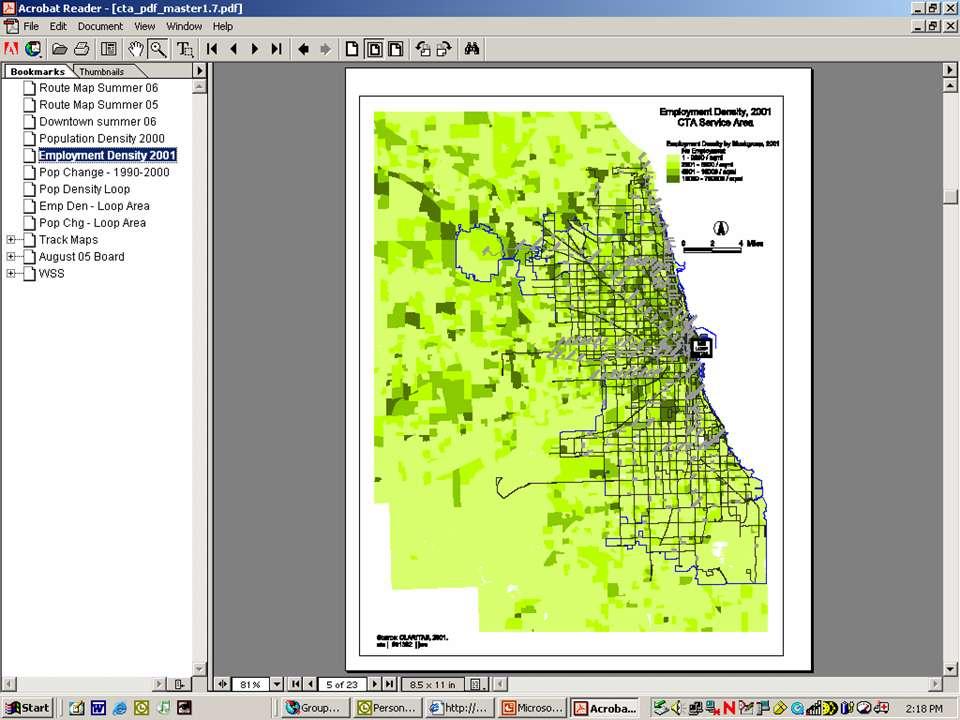
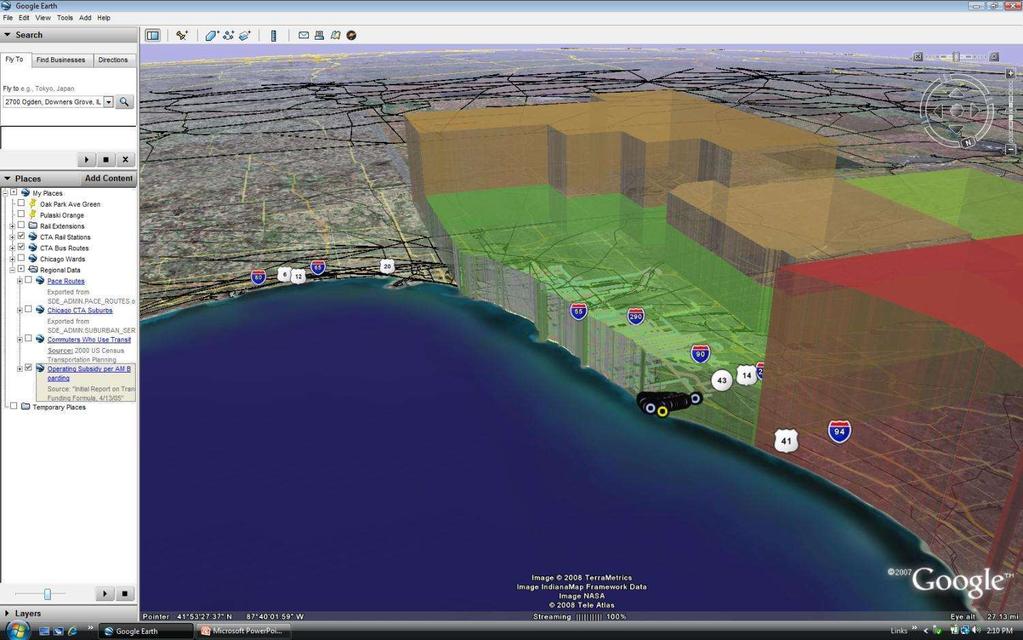
21 Spatial Data Strategy Develop a spatial data infrastructure Where people live Where they work What their travel patterns are Facilities needed to serve them

22 Information Infrastructure Census Data Housing Data Land Use Data Aerial Orthophotos Route Infrastructure Schedule Information Spatially Intelligent Vehicles Performance Ridership Data Specialized Models Field Data
23
24
25

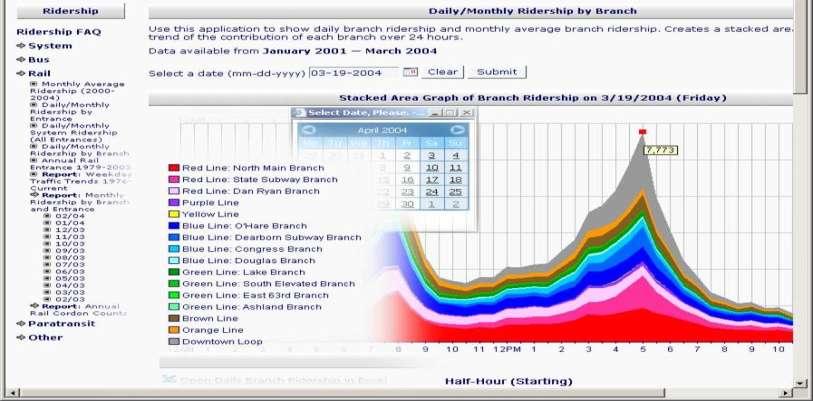
26 Rail Ridership Information

")

27 Bus Navigation System GPS (Global Positioning Satellite) Signal Heading Signal (Gyroscope) Distribution Data: Route data Odometer Signal TCH Operator Logon
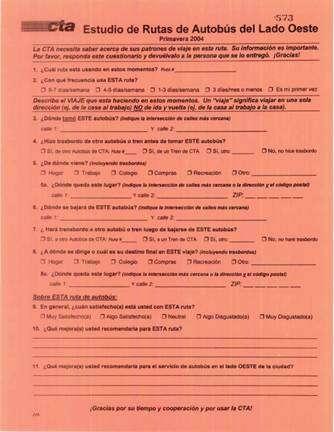
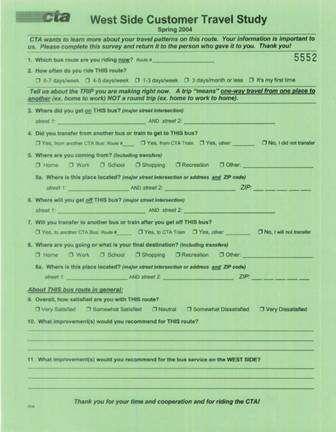
28
29
30 03-Jul Jul Jul Jul Jul Jul Jul Jul Jul Jul Jul Jul Jul Jul Jul Jul Jul Jul Jul Jul Aug Aug Aug Aug Aug Aug Aug Aug Aug Aug Aug Aug Aug Aug Aug Aug Aug Aug Aug Aug Aug Aug Aug Sep Sep Sep Sep Sep Sep Sep Sep Sep Sep Sep Sep Sep Sep Sep Sep Sep Sep Sep Sep Oct Oct Oct Oct Oct Oct Oct Oct Oct Oct Oct Oct Oct Oct Oct Oct Oct Oct Oct Oct Oct Oct-06 CTA Bus Bunching Measures (circa 2006) M F F F F F F F F F F F F F F C F F F 23:00 22:00 21:00 20:00 19:00 18:00 17:00 16:00 15:00 14:00 13:00 12:00 11:00 10:00 09:00 08:00 07:00 06:00 05:00 04:00 03:00 02:00 01:00 00:00 Percent of bus intervals 60-seconds or less by date and half-hour for weekdays from July to Sept in %-2.0% 2.0%-4.0% 4.0%-6.0% 6.0%-8.0% 8.0%-10.0%

 Bus")

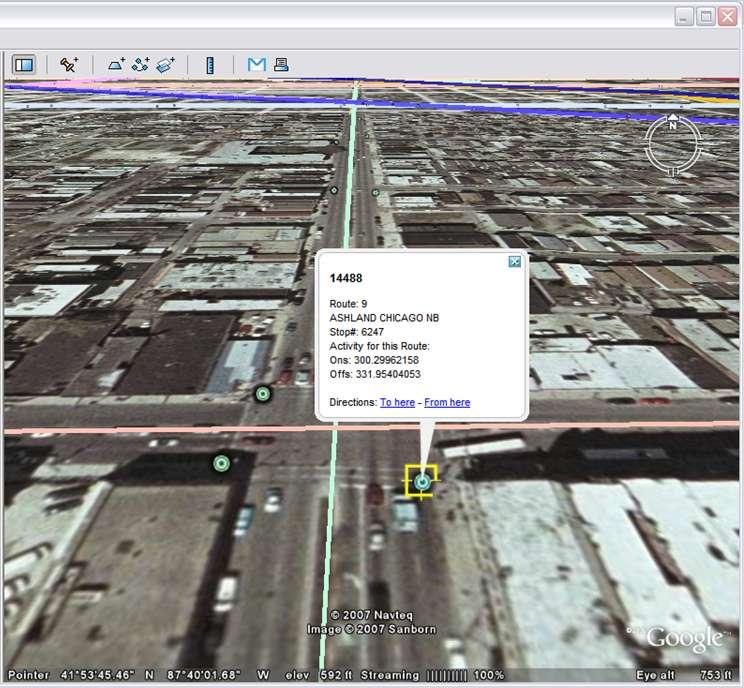
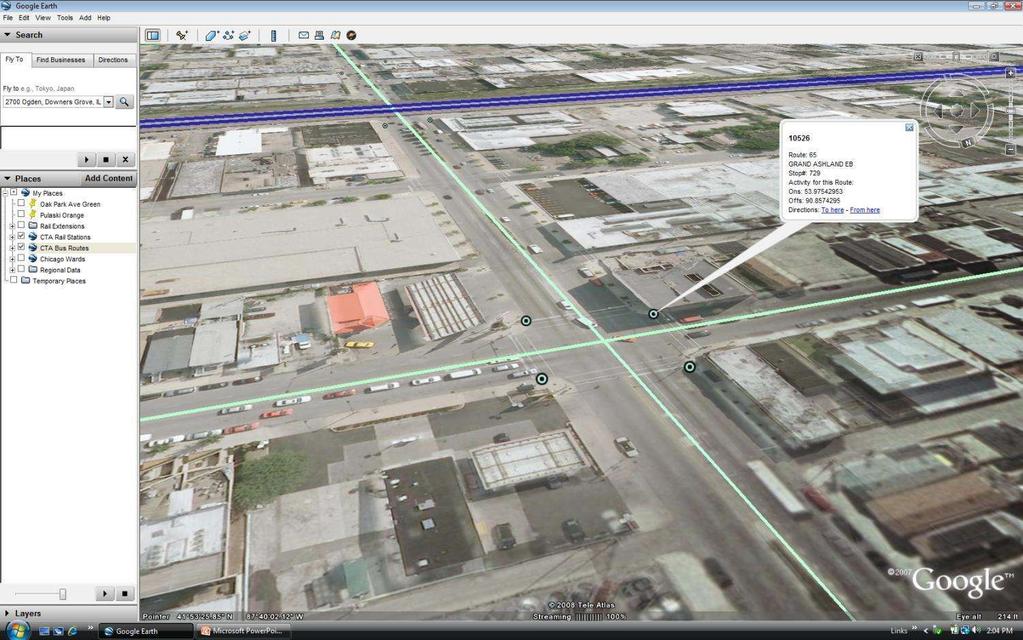
31 Automatic Passenger Counter (APC) Bus Ridership Tracking
32 New Forms of Visualization
33
34
35

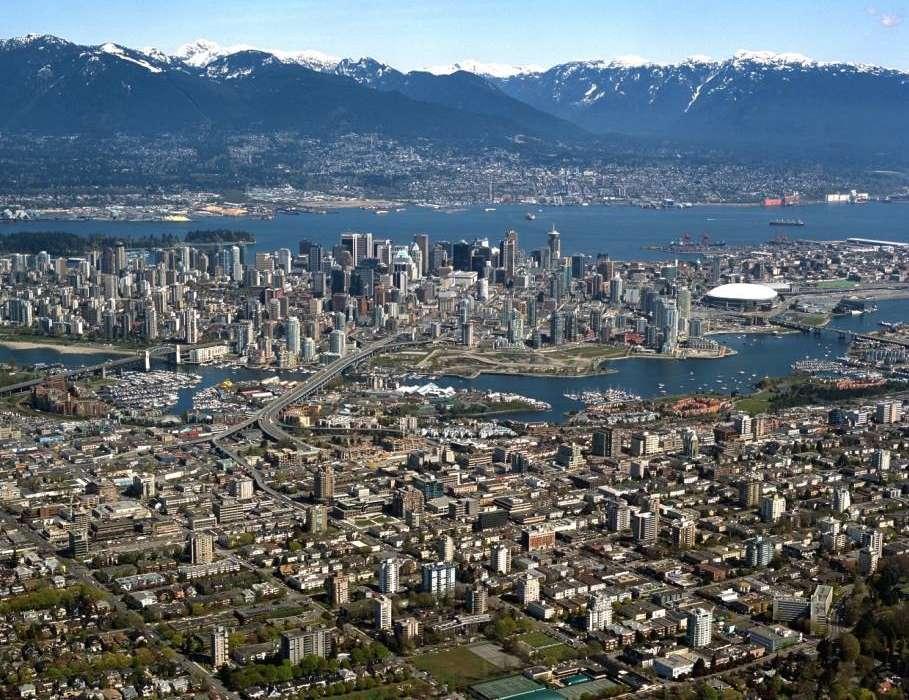
36 Ridership/Revenue Fare Model Elasticity of Demand Model Combines Stated and Revealed Preference Allows many pricing scenarios to be explored

37 Outreach Through Surveys

38 Outreach through Workshops

39 Service Planning Success Loop Loop Changes to the South Lakeshore and North Lakeshore were implemented in Fall Annual ridership has increased by 4.6 percent for the South Lakeshore sub-region, and 5.5 percent for the North Lakeshore sub-region. Travel times have decreased and customer satisfaction has improved. Loop Loop

40 Reconstruction of Infrastructure
41
42
43 Moving Forward in Metro Vancouver
44 The Context
45

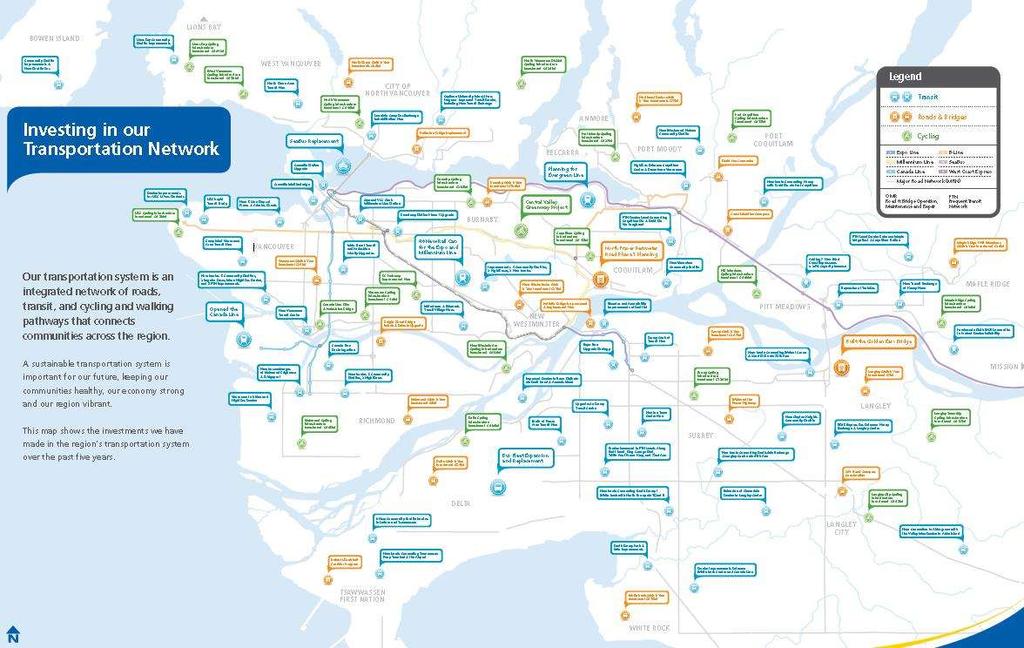
46 TransLink and the Metro Vancouver Region
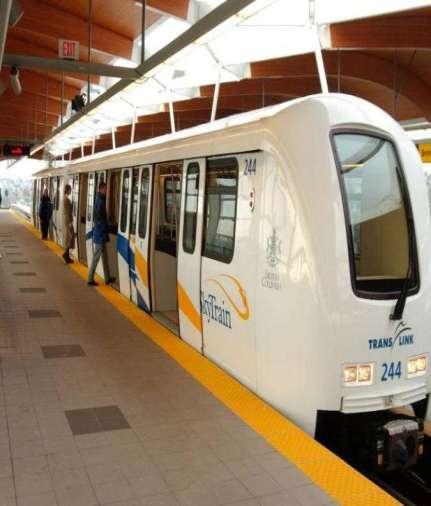
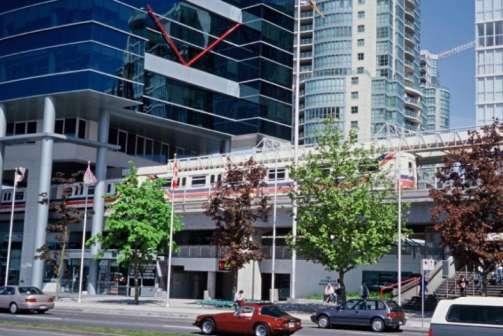
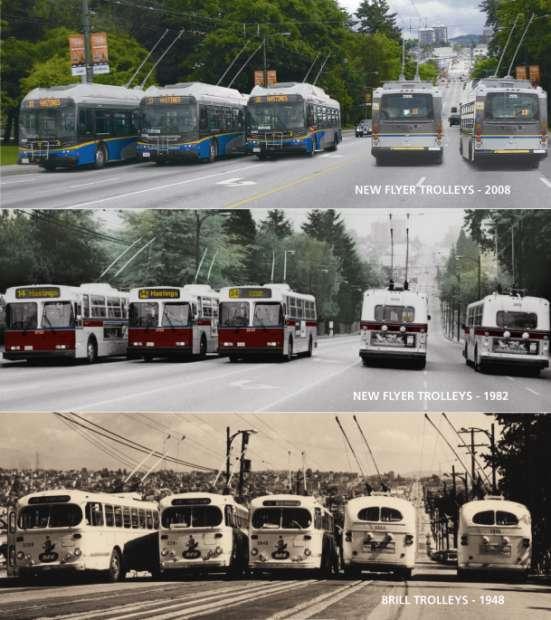
47
48
49

50 TransLink and the Metro Vancouver Region Over 1 million more people by 2040

51 18% 28% 74% 11% 240,000 95,000 19% 78% 360, , , ,000 53% 48% 420, ,000 56% 78% 79% 160,000 50,000 37% 49% 250, ,000 69% 835, ,000 56% 89% 230, ,000 Note: these projections are currently being reviewed as part of Metro Vancouver s regional growth strategy review process. Source: Metro Vancouver
52 TransLink and the Metro Vancouver Region Regional Travel patterns Traditional suburb to Downtown Travel (latter half of 20 th Century) Modern region to region Travel (21 st Century)


53 TransLink and the Metro Vancouver Region Journey-to-Work, 2006 Census
 Property & Replacement Tax")
 Other $49m (4%) Parking")
54 TransLink and the Metro Vancouver Region 2010 BUDGETED REVENUE Fuel Tax $319m (28%) Property & Replacement Tax $289m (25%) Transit Fares $413m (36%) Total approx. $1,146 Million GEB Tolls $29m (3%) Other $49m (4%) Parking Sales Tax $47m (4%)
 $843m (69%)")
 Contingency $10m (1%) TransLink $45m (4%) Total Roads & Bridges")
55 Financial challenge TransLink and the Metro Vancouver Region 2010 BUDGETED EXPENDITURE Total Transit Operations (Bus, Rail) $843m (69%) Bus $625m (51%) Rail $218m (18%) Police $28m (2%) Debt Service $251m (20%) Contingency $10m (1%) TransLink $45m (4%) Total Roads & Bridges $48m (4%)
56 Recent Accomplishments

57 TransLink Delivering a better transportation network From 2000 to 2010 More transit service, more routes, bigger more modern fleet - 75% more hours of service to 7.1 million hours per year more buses, 150 SkyTrain cars - 29 stations, a new SeaBus and 16 more West Coast Express cars - 90 million more transit riders per year - most on the system by choice


58 Using emerging technologies to Leverage our resources TransLink Delivering a better transportation network From 2000 to 2010 An expanded major arterial road network including: - Golden Ears Bridge - Dollarton Highway Bridges in North Vancouver - David Avenue Connector in Coquitlam - Coast Meridian Overpass in Port Coquitlam th Street Overpass in Langley Plus over $800 million in road improvement projects
59
60 TransLink and the Metro Vancouver Region Metro Vancouver Annual Transit Ridership million transit trips Ridership increased 52% between 1998 and 2009 Population increased by 15% = 5 million transit trips million transit trips
61 Annual Transit Trips Per Capita Annual Transit Service Hours per Capita TransLink and the Metro Vancouver Region Annual Transit Trips per Capita & Transit Service Hours per Capita (2002 to 2010) Annual Transit Trips/Capita Transit Service Hours/Capita
62 The Olympic Experience
63 Leveraging Resources

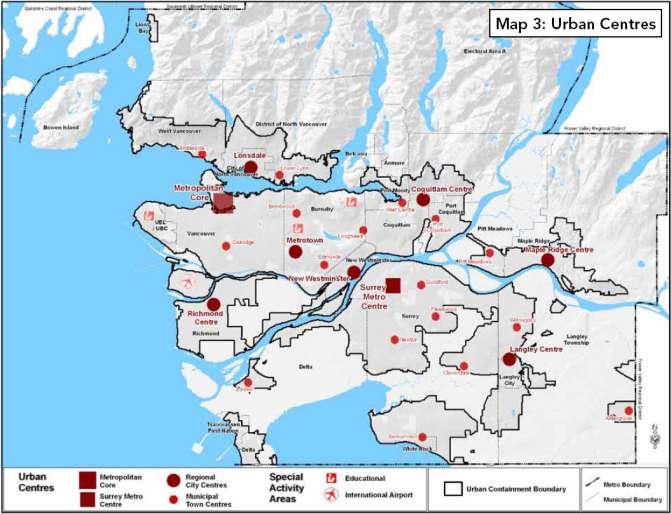
64 Steps Taken to Leverage Existing Resources Buses serve as important data collection devices

65 Steps Taken to Leverage Existing Resources APC equipped buses record passenger activity by stop, trip, time period, etc
66
67 Planning
68 Planning Framework 30Year Plan Major Supplement 7 Year Outlook 3 Year Funded Component Long Range Strategy Medium Range Plan Annual Base Plan


69 TransLink s Long Range Plan

70 Financial challenge Building the Asia-Pacific Gateway TransLink s Long Range Plan Future vision of Transport 2040 GOAL 1 - Greenhouse gas emissions aggressively reduced. GOAL 2 - Most trips are by transit, walking and cycling GOAL 3 - Most jobs and housing located along frequent transit network GOAL 4 - Traveling is safe, secure, and accessible for everyone GOAL 5 - Economic growth and efficient goods movement are facilitated GOAL 6 - Funding is stable, sufficient and influences choices.
71 1 Million Cars Congestion Funding GHG
72 Planning Approaches

73 The Land Use & Transportation Connection
74 The Land Use & Transportation Connection Frequent Transit Network (FTN) At least every 15 min throughout the day; 7 days/week Framework for a conversation around transit and land use coordination
 Catchment FTN Local Stop Trunk Line Frequent Bus Routes Linear Development 400M (2 block) Catchment Local Stop Local")
75 The Land Use & Transportation Connection Frequent Transit Network Transit Service Type Examples FTN Limited Stop w/exclusive ROW Fixed Guideway Rapid Transit Lines Nodal Development 800M (half mile) Catchment FTN Limited Stop Limited Stop Bus Lines Nodal Development 600M (3 block) Catchment FTN Local Stop Trunk Line Frequent Bus Routes Linear Development 400M (2 block) Catchment Local Stop Local Bus Routes No Specific Development 400M (2 block) Catchment


76 Area Transit Plans Area Transit Plans: Created with the formation of TransLink Provide more local involvement in transit planning TRAVEL PATTERNS Recognize regional differences and informs regional plans Create a vision for the future DEMOGRAPHICS AND DEVELOPMENT
77 Land Use & Transportation Connection More strategic approach to land use and transportation 1) Supply-side (transit provision) Frequent Transit Network (FTN) 2) Demand-side (land use shaping) Partnerships w/ municipalities on transit-oriented land use planning and development
78 Transit-Oriented Communities in Metro Vancouver Transit-Oriented Communities: are places that facilitate a decreased reliance on driving by focusing: higher-density development, diversity of uses, and pedestrian-friendly design, within walking-distance of frequent transit are really pedestrian-oriented communities connected by transit!
79 Transit-Oriented Communities in Metro Vancouver What are the Benefits? More cost-effective transit service Higher quality transit service Improved public realm & livability 79
80 Land Use & Transportation Connection
81 Land Use & Transportation Connection Passenger Facility and Community Design Guidelines
82 Rapid Transit Studies

83 The Land Use & Transportation Connection Rapid Transit Studies Need careful analysis: Long lead times Capital intensive Conversation about regional priorities: Advancement criteria to consider transitsupportive land-use potential

84 Enhancing Core Carrying Capacity: The Expo Line Upgrade Study

85 Serving Existing Need: The UBC Line Study


86 Rapid Transit Studies Defining Problems Existing transit services in the Corridor do not provide sufficient capacity or a reliable service Frequent pass-ups Unpredictable journey times Passenger experience

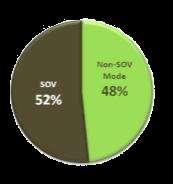
 30% growth of")
87 A Growing Corridor Central Broadway: 58,000 jobs 35,000 residents UBC : 6,500 residents 19,000 jobs 60,000 daytime population (students, faculty, staff) 30% growth of population and jobs

88 Shape Land Use: UBC Line Rapid Transit Study The Surrey Rapid Transit Study 84% of trips by car between seven urban centres

89 Support significant growth in Surrey Metro Centre and other urban centres...


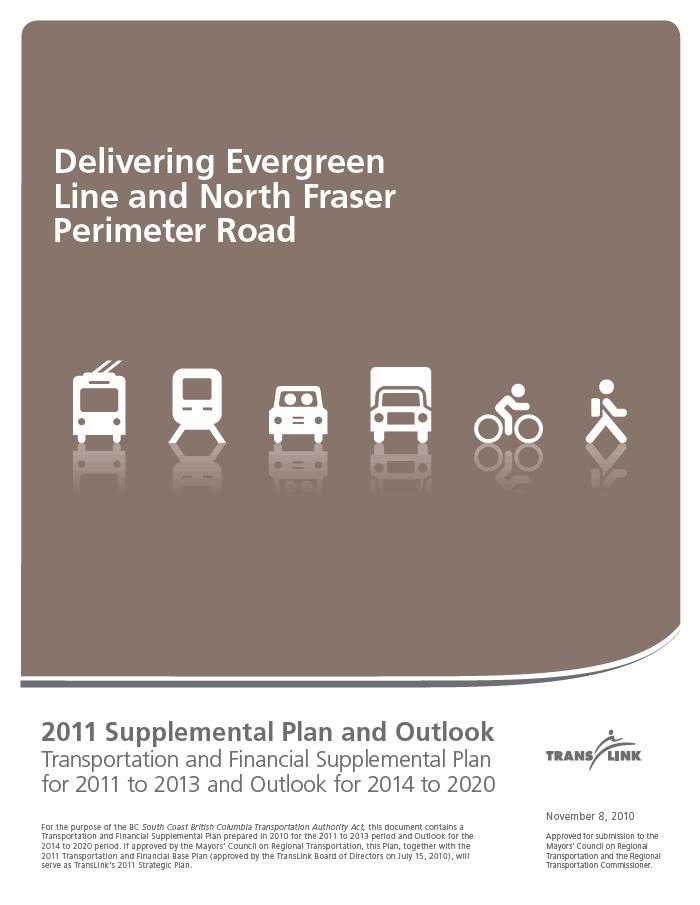
90 Enhance Economic UBC Line Rapid Transit Study Competitiveness Stimulate economic development and job access


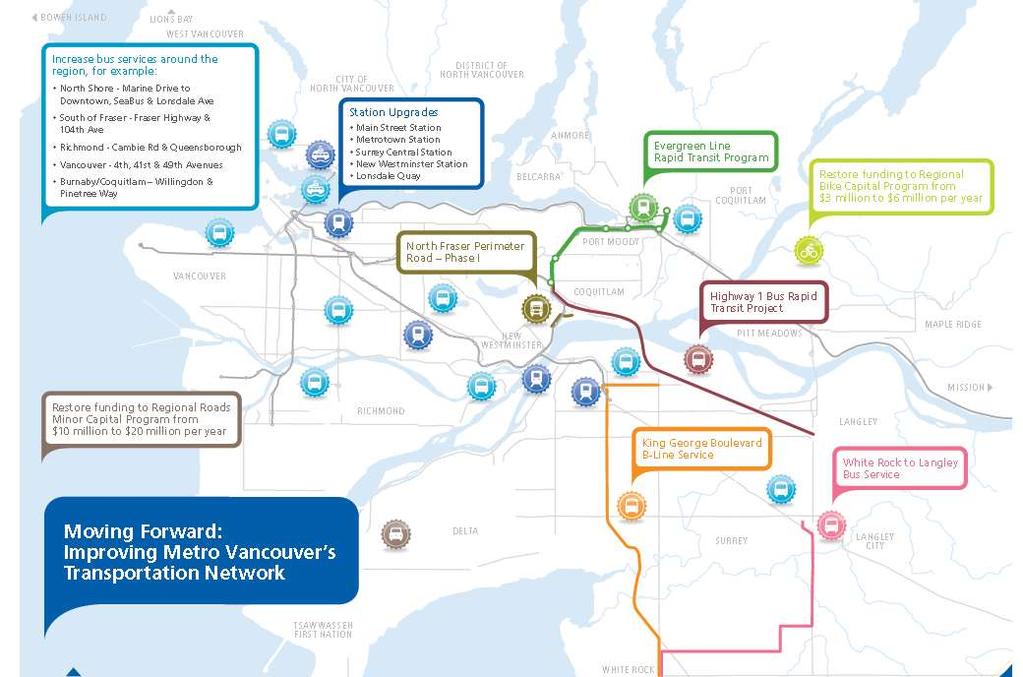
91 UBC Shape Line Rapid Future Transit Land Use Study Today... by encouraging transit-oriented development Future


92 UBC Line Rapid Transit Study Diverse range of urban transport technologies
93 Multiple Account Evaluation Multiple Account Evaluation Economic development Environmental Financial Social community Transportation Urban development Deliverability
94 Possible Challenging Unlikely Bus Rapid Transit Bus Rapid Transit Light Rail Transit Light Rail Transit Rail Rapid Transit Rail Rapid Transit Regional/ Commuter Rail Rail Regional In-street reserved lane Physically reserved instreet Private atgrade rightof-way Elevated Underground

95 The Land Use & Transportation Connection
96 The Land Use & Transportation Connection
97

98 Rapid Transit Studies Program
99 2011 Supplemental Plan
100 TransLink Priorities Maintaining Services State of Good Repair Upgrades Expansion Funding Stabilization Plan Additional Funding Required
101 Evaluation Framework & Process TransLink s plan evaluation process Outcomes-driven, performance-based plan development Will continue to apply to future supplements Responds to input of Commissioner and stakeholders The evaluation of candidate projects includes two parts: Effectiveness towards Transport 2040 Goals (i.e. reduced GHGs, mode share, complete communities, optimization, economic growth and goods movement, financially sustainable) Priorities specific to a particular plan (i.e. significant lost opportunity if not activated in 2010 and that Leverage significant other funding)
102 Evaluation Criteria Goal GHGs Aggressively Reduced Objective Reduces Vehicle Kilometres Travelled (VKT) Improves system operations and efficiency Greater use of low emission fleet technology Greater use of low carbon content fuel Non SOV Mode Share Protects existing transit ridership Promotes shifts to transit, cycling and walking Encourages future shifts to transit, cycling and walking Influences smart transportation choices Complete Communities Encourages complete and transit-oriented communities Expands access to regional transit and cycling networks Promotes regional mobility
103 Evaluation Criteria Goal System Optimization Objective Encourages modal integration Improves the resilience of the transportation system Improves system safety Promotes universal accessibility Economic Growth & Goods Movement Supports efficient access to regional centres and economic gateways Reduces congestion Improves travel time reliability Financially Sustainable Maximizes leveraging opportunities Make efficient use of existing infrastructure Prioritizes cost-effectiveness Prioritizes long-term growth in cost-effectiveness
104 Evaluation Criteria Goal Significant Lost Opportunity if Not Activated in 2010 Objective Leaves money on the table Dependence with other programs Significantly more expensive to do later Results in loss of passengers from the system Leverages Significant Other Funding Extent of capital contribution Impacts on operating costs Impacts on fare revenue Makes Best Use of Existing Fleet & Infrastructure Intensity of Previous Commitment Improves efficiency of existing assets Improves effectiveness in utilizing assets Nature of TransLink's commitment Importance of commitment to stakeholders
105 TransLink Funding Sources under SCBCTA Act TAXATION Fuel Tax Parking Sales Tax STATUS increased in 2010 to $.15/L -AT LEGISLATED MAX Increased in 2010 to 21% -AT LEGISLATED MAX Property Taxes Increase by 3% per year Hydro Levy Remains at $1.90/month/account -AT LEGISLATED MAX Replacement Tax Remains at $18M/yr -AT LEGISLATED MAX Benefitting Area Tax Not implemented USER FEES STATUS Transit Fares Increased in 2010 Transit Advertising Opportunities currently maximized. New Facility Tolls Vehicle Registration Fee -AT LEGISLATED MAX Not Implemented
106 Two Supplements

107 Two Supplements Evergreen Line NFPR Phase I Bus Service Hours Station Upgrades MRN Minor Road Capital Cycling Capital Program 67% funding from senior government and new ridership Defers regional funding to 2012 to identify new funding source If property tax, impact on avg household:~$62/yr or $8.90/100K Evergreen Line NFPR Phase I 68% funding from senior government Defers regional funding to 2012 to identify new funding source If property tax, impact on avg household:~$36/yr or $5.25/100K
108
")

109 Plan Benefits: Partner Funding Leverages significant funding from senior governments Revenue Distribution of Plan Funding ( Expenditures) Fare Revenue 15% $2.4 Billion in needed transit, road, and cycling capital and operating over the next 10 years Regional Source 32% Sr Gov't Funding 53%
110
111 Benefits of Moving Forward Retains federal funding Makes progress towards Transport 2040 Goals Accessibility and capacity improvements at stations Serves existing and new demand New service for growing areas of the region Provides funding to municipal road and bike programs that depend on TransLink for funding
112 Next Steps Regional Transportation Commissioner will review and provide comment Moving Forward on these investments requires Mayors Council approval
113 Next Steps
114 Key Long-range Planning Initiatives Moving forward Transport 2045 Goals, objectives, targets, policies Transp n Demand Management Strategy Investment Strategy Sustainable Funding Strategy Goods Movement Strategy Transit-Oriented Community Strategy Parking management Transportation pricing Financial tools Legislations and regulations Travelsmart Other supportive programs Performance-basis Asset management /renewal Multi-modal master plans Transit (rapid and bus) and road network plan Rapid transit prioritization FTN development Cycling and walking MRN User fees, e.g. Vehicle registration fees Tolls and road pricing Transit fares Parking charges General taxation, e.g. Property taxes Land value capture Others TransLink s role and priorities Overall policy framework Basis for future actions Management strategy Transport investments Land use goals, principles and standards Mechanism /system for input to OCPs, major developments and municipal planning processes Joint development policy FTN policy Station area planning policy
115 Concluding Thoughts 1. Land on a vision and stick to it. 2. Integrated transport planning works better than intermodal competition when enhancing mobility (roads v. transit). 3. Conversations on expansion are well supported if you can demonstrate efficiency and effectiveness. 4. Transport can be used as an effective incentive for supportive Land Use and viceversa. Linking the two is important. 5. Evidence-based planning provides a critical foundation for political discussions. 6. Never underestimate the value of a political champion.
116 Thank you. Michael J. Shiffer, Ph.D. Vice President Planning, Strategy & Technology TransLink