Feasibility Report Update February 2015
|
|
|
- Jesse Booker
- 5 years ago
- Views:
Transcription


A Project No.")
1 Prepared for: 205 South 17 th Avenue Phoenix, Arizona Feasibility Report Update February 2015 Prepared by: Interstate 10: Junction Interstate 19 to State Route 83 Tucson Benson Highway State Route 210: Golf Links Road to I-10 Barraza Aviation Parkway 101 North 1st Avenue, Suite 2600 Phoenix, Arizona Federal No.: 010-E(210)A Project No.: 010 PM 260 H L Tucson District Pima County
2


3
 from Golf Links Road to I-10.")

4 1.1. Introduction The Arizona Department of Transportation (ADOT) in cooperation with the Federal Highway Administration (FHWA) prepared a Feasibility Study to identify and evaluate alternatives for the improvement of I-10 from the Junction of I-19 to SR 83 and the extension of the Barraza- Aviation Parkway (SR 210) from Golf Links Road to I-10. This Feasibility Study presents the results of an investigation of alternative concepts for accomplishing improvements to both I-10 and SR 210. Subsequent to the finalization of the Feasibility Report, an additional alternative for the extension of SR 210 from Golf Links Road to I-10 was identified for the improvement. This Feasibility Report Update includes the alternatives included in the previously approved report, and supplements the report with an additional alternative for accomplishing improvements to both I-10 and SR 210. The study area is located in the ADOT Tucson District within the City of Tucson, the City of South Tucson and Pima County. I-10 is a full access controlled interstate freeway. ADOT Project No. 010 PM 260 H L; Federal No. 010-E(210)A has not been programmed by ADOT. It is anticipated that Federal Aid Interstate funds will be used for the improvement of I-10. The functional classification of SR 210 is Urban Other Freeway. SR 210 is a divided multi-lane urban highway that parallels I-10 and is located approximately 1.75 miles northeast of I-10. The project study team, in cooperation with participating agencies, initiated a study of the feasibility of improving I-10 from the I-19 traffic interchange (TI) (MP 260.2) easterly through the SR 83 TI (MP 282.0) and extending SR 210 from its current easterly end at Golf Links Road to an interchange connection with I-10 at a location to be determined. FHWA is serving as the lead federal agency and will continue to provide input and oversight for the alternatives identification and evaluation process. During development of the Feasibility Report, improvement alternatives I, II and IIIc were identified and evaluated for the extension of SR 210 to several connection locations with I-10. The additional alternative included in the Feasibility Report Update is Alternative IV. This Feasibility Report Update will evaluate and compare the four alternatives for the improvements for both I-10 and SR 210. The evaluation will include alternative configurations of I-10 for each of the SR 210 alternative alignments. The Study will also include I-10 EXECUTIVE SUMMARY mainline and interchange modifications from I-19 to SR 83. Improvements to I-10 and the extension of SR 210 to a connection with I-10 will accommodate design year 2040 traffic. In addition, the Pima Association of Governments (PAG) revised their Regional Transportation Plan reducing long-term population projections for the region. This update incorporates the resultant traffic projection changes for all of the alternatives including the no build alternative. Following completion of the Feasibility Report Update and the Environmental Overview (Phase I) Update a Design Concept Report and Environmental Assessment (Phase II) will be initiated by ADOT in cooperation with the FHWA to further analyze and develop the alternatives that were identified in the Feasibility Study Update as being viable improvement alternatives to carry forward for further evaluation. The Design Concept Study will identify the alternative to be carried forward for final design and construction. The following agencies and stakeholders have been involved in developing the study: FHWA, Pima Association of Governments (PAG), Pima County, City of Tucson, City of South Tucson, Davis- Monthan Air Force Base (DMAFB), US Customs & Border Protection, Tucson Airport Authority, Sun Tran, Arizona Game and Fish Department (AGFD), Arizona State Land Department (ASLD), the Regional Transportation Authority (RTA), and the Union Pacific Railroad (UPRR). Purpose and Need Increasing traffic volumes on I-10 in the vicinity of Tucson, Arizona have contributed to reduced operational effectiveness, particularly the segment of I-10 between I-19 and SR 83. The traffic modeling accomplished for the combined I-10/SR 210 traffic analysis has demonstrated that north-south traffic demands through the project area are constrained by limitations on north-south arterial corridors. The number, type, and close proximity of access points to I-10 in this area compound the problem, contributing to an increase in local traffic using the Interstate Highway for short local trips. In the future, increasing traffic volumes on this segment of I-10 originating from anticipated growth to the south and east of downtown Tucson, as well as growing demands on I-10 as an interstate facility, will lead to capacity and access restrictions on and along the interstate. Poor operational performance for local, regional, and interstate traffic will result from operations in many portions of I-10 declining to level of service (LOS) F by The decline to LOS F will show the roadway is failing to function as intended with forced flow and extensive delays. The purpose of the proposed improvement to I-10 and the extension of SR 210 to a direct connection with I-10 is to address deficiencies in the interstate highway system and provide motorists with an alternate route into Tucson s downtown business district. The improvements to I-10 and the extension of SR 210 will provide satisfactory service levels on both I-10 and SR 210 through the 2040 design year Traffic Data An Initial Traffic Report was prepared that identified and evaluated the design year 2040 transportation needs for I-10 from I-19 east to SR 90 in Cochise County, and for the extension of SR 210 to connect with I-10. The Pima Association of Governments (PAG) is in the process of finalizing the new 2045 Regional Transportation Plan (RTP). For this effort PAG reviewed and revised the forecasted regional growth. Due to the economic climate, PAG projected a more conservative growth with a significant reduction of population and employment in the PAG planning area. This has significantly impacted the study area travel demand and prompted a review of the recommendations made in the 2011 Initial Traffic Report. The new 2045 PAG model socioeconomic data and Traffic Analysis Zones were not revised for this study. For this study it was assumed that the 2045 population will be in place by 2040 as a conservative assessment. An Initial Traffic Report Addendum; I-10: Jct. Interstate 19 to SR 83/SR 210: Golf Links Road to I-10 has been prepared that utilizes the updated PAG data. The Initial Traffic Report Addendum identifies and evaluates the design year 2040 transportation needs for I-10 from I-19 east to SR 83, and for the extension of SR 210 to connect with I-10. Roadway Network System I and II roadway networks, developed for the 2011 Initial Traffic Report were used as the starting point for validating the recommended alternatives. Due to various environmental and design issues, System IIIc was eliminated and was replaced by System IV. Traffic Forecast The (2014) PAG Travel Demand Model for design year 2040 was used along with an external travel survey conducted by PAG in 2011 to develop future travel on I-10 and SR 210. Future forecasted traffic volumes were generated using the 2040 socioeconomic data to identify the magnitude of the change in travel i
5 demand between the old model assumptions used in the original traffic forecast and the assumptions used in the new model. The No Build Scenario was used to create a benchmark against which the System Alternatives were compared. Future forecasted traffic volumes were generated using the new 2040 socioeconomic data and future System I, II and IV roadway network alternatives. The roadway configurations needed to achieve acceptable levels of service for the alternatives. Traffic Operational Analysis The traffic operational analysis evaluates the peak hour traffic volumes obtained from the regional modeling efforts to refine and ensure that the improvement alternatives are operationally feasible. This iterative process includes roadway characteristics, traffic volumes, traffic control measures, and access spacing. A traffic operational analysis was conducted using the VISSIM microsimulation model for the following scenarios. 1. Year 2010: Existing Conditions I-10 and SR 210. The existing roadway network within the study area was evaluated using traffic data collected in year Year 2040: No-Build The existing roadway network within the study area was evaluated with the updated projected year 2040 traffic volumes. Under this scenario there were no proposed improvements made to either I-10 or SR Year 2040: System Alternative I. See Figure 3.1 System Alternative I. An improved roadway network was evaluated with the updated projected year 2040 traffic volumes. In the System Alternative I roadway improvement alternative, SR 210 is extended as a freeway along the Alvernon Way alignment to connect to I-10 at a system interchange. 4. Year 2040: System Alternative II. See Figure 3.2 System Alternative II. An improved roadway network was evaluated with the updated projected year 2040 traffic volumes. In the System Alternative II roadway improvement alternative, the freeway connection from I-10 to SR 210 begins just west of Valencia Road and continues parallel to the DMAFB before tying into the existing SR Year 2040: System Alternative IV. See Figure 3.5 System Alternative IV. An improved roadway network was evaluated with the updated projected year 2040 traffic volumes. The System Alternative IV roadway improvement alternative will extend SR 210 as a freeway along the Alvernon Way alignment and connect to I-10 with a system interchange. The improvement of I-10 will include the addition of Collector Distributor lanes both eastbound and westbound between the I-10/SR 210 System Interchange and Kolb Road. Per ADOT Roadway Design Guidelines, for I-10 and SR 210 mainline and ramp roadways, and for intersections of ramps and crossroads, LOS D is acceptable for urban conditions. The section of I-10 between I-19 and SR 83 as well as SR 210 within the study area is considered urban in character for design year Results of Operational Analysis The operational analysis showed that System Alternative I, System Alternative II and System Alternative IV will operate with satisfactory service levels. However, additional iterations to modify traffic movements, primarily at traffic interchange (TI) ramps and crossroads, will be required for some traffic movements during the Phase II Design Concept Study. 1.3 Alternatives Considered Improvements to I-10 and the extension of SR 210 to a connection with I-10 will be based primarily on developing the capacity to carry the projected 2040 design year traffic demand as identified via macro-level traffic modeling. This will require determining the minimum number of lanes in each direction needed for mainline I-10 with the SR 210 extension. Improvements will include improving existing conditions, such as; short weaving distances (especially regarding successive loop ramps), TIs spaced closer than the desirable one mile spacing, and short driver decision-making distances. A two level analysis is used to identify alternatives to be carried forward to the Phase II Design Concept Study. Level 1 examines alternatives for fatal flaws that render the alternative unusable. Alternatives that have no fatal flaws identified are then evaluated under Level 2. Level 2 analysis includes: A determination of the traffic handling capability of each alternative, using design year traffic projections. Identification of impacts to surrounding area resulting from each alternative. A rough estimate of cost based on conceptual configuration of the roadway. Other factors as identified during the study process. Level 1 Alternative Identification The Level 1 process identifies alternative locations along I-10 for the connection of the SR 210 extension. Alternative alignments for the extension of SR 210 are then identified and both SR 210 and I-10 are evaluated to determine fatal flaws that may eliminate some of the connection points. The fatal flaws consist of factors that prohibit locating the SR 210 roadway in particular areas. Only those alternatives that are feasible will be carried forward. Evaluation criteria include, but are not limited to: Support the major interchange of SR 210 with Alvernon Way/Golf Links Road. Avoid major impacts to DMAFB. Avoid major environmental, social and economic impacts identified along the alignment. Support the system interchange with I-10. Support local interchanges adjacent to the system interchange. Six initial connection locations to I-10 were identified and evaluated using the criteria listed above. System Alternative I I-10/SR 210 connection at Alvernon Way: There were no fatal flaws identified for the I-10/SR 210 connection at Alvernon Way. An alternative identified as System Alternative I will be carried forward for Level 2 analysis. See Figure 3.1 System Alternative I. System Alternative II I-10/SR 210 connection west of Valencia Road: There were no fatal flaws identified for the I-10/SR 210 connection west of Valencia Road. An alternative identified as System Alternative II will be carried forward for Level 2 analysis. See Figure 3.2 System Alternative II. System Alternatives III, IIIa & IIIb I-10/SR 210 connections east of Wilmot Road: Three alignment alternatives were investigated to connect SR 210 with I-10 east of Wilmot Road. See Figure 3.3 System Alternative III, IIIa and IIIb. System Alternative III impacts the Thomas Jay Regional Park, the Craycroft Elementary School and the Lauffer Middle School. System Alternative III was eliminated from consideration. Concerns with System Alternatives IIIa and IIIb: ii
6 System Alternatives IIIa and IIIb have the same horizontal alignment. The alignment of both alternatives impact DMAFB: o The alignment would pass within the restricted radius of a hazardous object pad that is located within DMAFB. o The alignments cross the corner of the runway Clear Zone, which is not allowed. o The alignments are within the Accident Potential Zone. o The alignments are located within Military Munitions Response Program areas. The possibility of realigning System Alternatives IIIa and/or IIIb was reviewed. However, no satisfactory alignment for these alternatives could be developed. System Alternatives IIIa and IIIb were eliminated from consideration. System Alternative IIIc System Alternative IIIc would connect the extension of SR 210 to I- 10 at Wilmot Road. This alternative was identified after it was determined that System Alternatives III, IIIa and IIIb were not acceptable. See Figure 3.4 System Alternative IIIc. System Alternative IIIc was eliminated because: The estimated cost of System Alternative IIIc, not including the costs of right-of-way, utilities, hazardous material protection, or relocation, significantly higher than either System Alternative I or II. System Alternative IIIc would require relocation of approximately 50 more residences than either System Alternative I or II. There would be numerous conflicts with utilities located within local streets that would be crossed by System Alternative IIIc. The vertical alignment would be depressed for much of the route including a portion under a major wash. Right-of-way acquisition would be required from DMAFB. The alignment of System Alternative IIIc passes near areas on DMAFB where explosive ordinance is removed from aircraft, creating a likely danger to users of the roadway if accidental explosions occurred. The alignment of the roadway near DMAFB would need to be checked for unexploded ordinance. System Alternative IV System Alternative IV is the extension of SR 210 south along the Alvernon Way alignment to I-10 and the addition of collectordistributor (CD) roadways adjacent to both the eastbound and westbound I-10 mainline roadway from Alvernon Way easterly through the Kolb Road TI. System Alternative IV will be carried forward for Level 2 analysis. Other I-10/SR 210 Connection Locations: Craycroft Road: The I-10/SR 210 connection at Craycroft Road was eliminated because: It bisected the community of Littletown and impacted both Lauffer Middle School and Craycroft Elementary School. The system interchange ramps would conflict with the Valencia Road/I-10 TI, which would require the removal of the Valencia Road/I-10 TI ramps. Kolb Road and Rita Road: The I-10/SR 210 connections at both Kolb Road and Rita Road were eliminated because they shared the same alignment through the environmentally sensitive areas as the connection east of Wilmot Road identified above as System Alternative III. Analysis of projected traffic on I-10 in the design year 2040 showed there would be only marginal improvements in I-10 traffic if the SR 210 connection with I-10 was extended to the east of Wilmot Road. This analysis reduces the value of alternative connections of SR 210 to I-10 east of Wilmot Road. See the Initial Traffic Report for further details. Level 2 Alternative Analysis The Level 2 further evaluates alternatives that were found to have no fatal flaws. Alternatives are developed to the extent that the traffic handling capability is identified and impacts to the adjacent properties are identified. The evaluation includes an estimate of cost based on the conceptual configuration. Other factors identified during the study process are also included in the evaluation of the alternatives. System Alternative I This alternative extends SR 210 southerly along the existing Alvernon Way alignment to I-10. See Figure 3.1 System Alternative I. SR 210 between Golf Links Road and I-10 is a minimum of four lanes in each direction to accommodate both SR 210 through traffic and local traffic. The SR 210/Alvernon Way/Golf Links TI provides all traffic movements except access to Contractors Way. Access to Contractors Way is provided from SR 210 via the Ajo Way TI. The I-10/SR 210 system interchange lies on top of and incorporates the existing diamond TI at Alvernon Way and I-10. System Alternative II This alternative extends SR 210 southerly through the Alvernon Way/Golf Links TI, where it turns to the east along the southern edge of Davis-Monthan AFB, and then south along the Swan Road alignment to I-10. See Figure 3.2 System Alternative II. SR 210 is a minimum of two lanes in each direction. The SR 210/Alvernon Way/Golf Links TI provides all traffic movements except access to Contractors Way. Access to Contractors Way is provided from SR 210 via a TI at Irvington Road. Because of the proximity of the proposed system interchange to the existing diamond TI at Valencia Road, the westbound Valencia Road and Craycroft Road ramps will be incorporated into the system interchange to provide access to/from both I-10 and SR 210. System Alternative IV System Alternative IV is the extension of SR 210 south along the Alvernon Way alignment to I-10 and the addition of collector-distributor (CD) roadways adjacent to both the eastbound and westbound I-10 mainline roadway from Alvernon Way easterly through the Kolb Road TI. See Figure 3.5 System Alternative IV. A system interchange will provide access between SR 210 and the eastbound and westbound I-10 CD roadways. The eastbound CD roadway is a continuation of the southbound SR 210 roadway. A ramp will be provided to allow vehicles on eastbound I-10 to exit I-10 and enter the eastbound CD roadway. The westbound CD roadway will curve to the north approaching Alvernon Way and become the northbound SR 210 roadway. Traffic interchanges will provide access between the CD roadways and major cross streets at Valencia Road, Craycroft Road, Wilmot Road and Kolb Road within the limits of the CD roadways. Modifications to Existing I-10 Modifications to existing I-10 from I-19 to SR 83 are required to provide an acceptable LOS for design year The modifications include improvements to both the I-10 mainline roadway and to the existing I-10 TIs within the project limits. I-10 Traffic Interchanges (TI) In urban conditions, TIs should nominally be one mile apart. However, the location of some major cross-roads that intersect I-10 with TIs results in distances between TIs of less than one mile. iii
7 Park Avenue TI is approximately 0.7 miles from both 6 th Avenue TI and Kino Parkway TI. Craycroft Road TI is approximately 0.85 miles from the Valencia Road TI. Palo Verde Road TI is approximately 0.6 miles from the Alvernon Way TI. Elimination of these TIs is not practical, as they provide needed access to local businesses and governmental services. Therefore, reconfiguration of TI ramps is needed to maintain access, yet maximize weaving distances and safety for the traveling public. The Palo Verde Road TI can be removed and a new TI at Country Club Road is needed and will be added. Country Club Road is located approximately 1.2 miles from Kino Boulevard TI and Alvernon Way TI. All other TIs meet or exceed the minimum one mile spacing criteria. Each of the existing TIs within the project limits was evaluated from a capacity and safety standpoint to determine needed improvements. The evaluation process involved: Using the projected 2040 peak hour traffic volumes and micromodeling software to identify problem areas or movements that have unacceptable levels of service. Identifying solutions. Testing solutions by re-running the micro-model with the proposed solutions coded into the software. Repeating the iterative process until adequate solutions are produced. A description of improvements for each existing and new TI is included in Section 3.3 of this report. Improvements meet the capacity and operational requirements, but are not necessarily the final recommended solution. That is to be determined in the Phase II Design Concept Study. Alternatives for Further Consideration Three alternatives will be carried forward to the Phase II Design Concept Study for further consideration: I-10/SR 210 System Alternative I I-10/SR 210 System Alternative II I-10/SR 210 System Alternative IV Section 3.3 identifies items that will require additional analysis during the Phase II Design Concept Study. Evaluation Criteria As a result of input from the Study Team, Performance Measures have been developed for evaluating the impact of alternative transportation improvements during the Phase II Design Concept Study. The Performance Measure Ranking percentages are as follows: 30% Transportation Performance 25% Financial/Economic Performance 15% Social Impact 15% Land Use/Economic Development Impacts 15% Environmental Impacts 1.4 Environmental Overview The Environmental Overview is summarized in Section 5 of this report. The entire Environmental Overview is in Appendix H of this report. A Public Information Meeting was held October 6, The meeting is summarized in the Environmental Overview Summary. 1.5 Cost Estimates The total estimated costs for System Alternative I and II are listed below. The costs exclude the cost of utilities and ROW. The amount of ROW to be acquired, in acres, is listed separately. System Alternative I I-10 $691,100,000 SR 210 $194,940,000 System Alternative I Total $886,040,000 System Alternative I ROW 196 acres System Alternative II I-10 $671,270,000 SR 210 $171,200,000 System Alternative II Total $842,470,000 System Alternative II ROW 337 acres System Alterative IV I-10 $761,590,000 SR 210 $193,650,000 System Alternative IV Total $955,240,000 System Alternative IV ROW acres iv


8
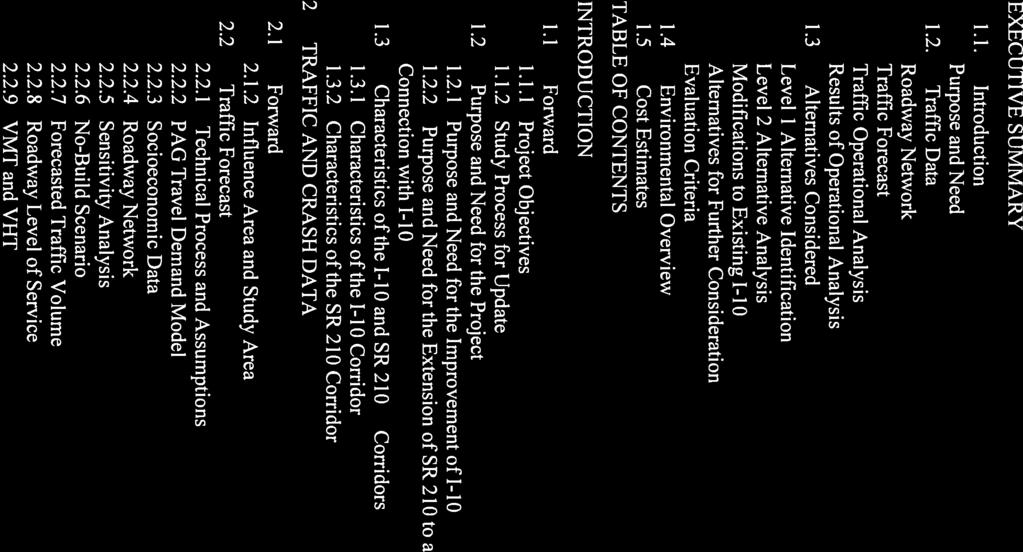
9 LIST OF FIGURES I-10; Jct. I-19 to SR 83 & SR 210; Golf Links Road to I-10 Feasibility Report Update Figure 1.1 Project Location Map... 1 Figure 1.2 Vicinity Map... 3 Figure 2.1 Influence Area and Study Map... 7 Figure LOS Depiction... 9 Figure Number of Lanes System I Figure Number of Lanes System II Figure Number of Lanes System IV Figure 2.6 Screenlines Figure 2.7 I-10 Existing Conditions 2010 Mainline Lanes & LOS Summary Figure 2.8 I-10 No-Build Alternative Mainline Lanes & LOS Summary.19 Figure 2.9 I-10 System Alternative I Build - Mainline Lanes & LOS Summary 20 Figure 2.10 I-10 System Alternative II Build - Mainline Lanes & LOS Summary...21 Figure 2.11 I-10 System Alternative IV Build - Mainline Lanes & LOS Summary 22 Figure 3.1 System Alternative I Figure 3.2 System Alternative II 33 Figure 3.3 System Alternative III, IIIa and IIIb...33 Figure 3.4 System Alternative IIIc...34 Figure 3.5 System Alternative IV.34 LIST OF TABLES Table 1.1 Previous Projects Within the I-10 Study Area 4 Table 1.2 Existing I-10 Structures 5 Table 1.3 Previous Projects within the SR 210 Study Area 6 Table 1.4 Existing Structures - SR 210 Study Area 6 Table and 2040 Socioeconomic Summary 8 Table 2.2 V/C and LOS 9 Table 2.3 Summary of Findings by System Alternatives I Table 2.4 Summary of Findings by System Alternative SR Table System Alternatives Screenline Analysis 14 Table 2.6 VMT and VHT System Alternatives I, II and IV 14 Table 2.7 I-10 Ramps LOS Summary Table 23 Table 2.8 SR 210 Ramps LOS Summary Table 25 Table 2.9 I-10 Intersection LOS Summary Table 26 Table 2.10 SR 210 Intersection LOS Summary Table 27 Table 2.11 Summary of Crashes Table 2.12 I-10 TIs 5-Year Crash Summary ( ) 29 Table 2.13 I-10 Mainline 5-Year Crash Summary ( ) 30 Table 2.14 SR 210 Mainline 5-Year Crash Summary ( ) 31 Table 2.15 SR 210 Intersections 5-Year Crash Summary ( ) 31 Table 4.1 Utility and Railroad Contacts 48 Table 6.1 I-10/SR 210; System Alternative I (I-10 Improvements) Estimated Cost 52 Table 6.2 I-10/SR 210; System Alternative I (SR 210 Extension) Estimated Cost 52 Table 6.3 I-10/SR 210; System Alternative II (I-10 Improvements) Estimated Cost 53 Table 6.4 I-10/SR 210; System Alternative II (SR 210 Extension) Estimated Cost 53 Table 6.5 I-10/SR 210; System Alternative IV (I-10 Improvements) Estimated Cost 54 Table 6.6 I-10/SR-210; System Alternative IV (SR 210 Extension) Estimated Cost 54 APPENDICES APPENDIX A: EXISTING CONDITIONS 55 APPENDIX B: TRAFFIC MODELING 77 APPENDIX C: SYSTEM ALTERNATIVE I (Typical Sections and Plan Sheets) 85 APPENDIX D: SYSTEM ALTERNATIVE II (Typical Sections and Plan Sheets) 125 APPENDIX E: SYSTEM ALTERNATIVE IV (Typical Sections and Plan Sheets) 167 APPENDIX F: ACCESS CONTROL STRATEGIES AT CROSSROADS 207 APPENDIX G: TRANSIT OPPORTUNITIES (OCTOBER 2011) 215 APPENDIX H: ENVIRONMENTAL OVERVIEW 227 APPENDIX I: MEETING NOTES 291 APPENDIX J: SUMMARY OF COMMENTS 337 vi
 from Golf Links Road to I-10.")
10 1.1 Forward The Arizona Department of Transportation (ADOT) in cooperation with the Federal Highway Administration (FHWA) prepared a Feasibility Study to identify and evaluate alternatives for the improvement of I-10 from the Junction of I-19 to SR 83 and the extension of the Barraza- Aviation Parkway (SR 210) from Golf Links Road to I-10. Figure 1-1 Project Location Map shows the location of the study area for both I- 10 and SR 210 in the State of Arizona. Subsequent to the finalization of the Feasibility Report, an additional alternative for the extension of SR 210 from Golf Links Road to I-10 was identified for the improvement. This Feasibility Report Update includes the alternatives included in the previously approved report, and supplements the report with an additional alternative for accomplishing improvements to both I-10 and SR 210. The study area is located in the ADOT Tucson District within the City of Tucson, the City of South Tucson and Pima County. I-10 is a full access controlled interstate freeway. ADOT Project No. 010 PM 260 H L; Federal No. 010-E(210)A has not been programmed by ADOT. It is anticipated that Federal Aid Interstate funds will be used for the improvement of I-10. The functional classification of SR 210 is Urban Other Freeway. SR 210 is a divided multi-lane urban highway that parallels I-10 and is located approximately 1.75 miles northeast of I-10. SR 210 begins at Broadway Boulevard and ends just past South Palo Verde Road. From Broadway Boulevard through the intersection of Country Club Road, SR 210 has three-lanes in each direction. The roadway then narrows and continues with two-lanes in each direction to the end of SR 210. However, the road continues east and connects to Golf Links Road. FHWA is serving as the lead federal agency and will provide input and oversight for the alternatives identification and evaluation process. Following completion of the Feasibility Report Update and Environmental Overview Update (Phase I) a Design Concept Study and Environmental Assessment (Phase II) will be initiated by ADOT in cooperation with the FHWA. Alternatives that were identified as being viable improvement alternatives will be further analyzed and developed. The Design Concept Study will identify the alternative to be carried forward for final design and construction. INTRODUCTION Figure 1.1 Project Location Map PROJECT LOCATION 1
11 During Phase II the Design Concept Study will be extended on I-10 through the SR 90 interchange in Benson, AZ. The Environmental Assessment will end just beyond the I-10 /SR 83 interchange. The following were involved in developing the study: FHWA, Pima Association of Governments (PAG), Pima County, Davis- Monthan Air Force Base (DMAFB), City of Tucson, City of South Tucson, US Customs & Border Protection (CBP), Tucson Airport Authority, Sun Tran, Arizona Game and Fish Department (AGFD), Arizona State Land Department (ASLD), the Regional Transportation Authority (RTA), and the Union Pacific Railroad (UPRR) Project Objectives The project study team, in cooperation with participating agencies, initiated a study of the feasibility of improving I-10 from the I-19 traffic interchange (TI) (MP 260.2) easterly through the SR 83 TI (MP 282.0) and extending SR 210 from its current easterly end at Golf Links Road to an interchange connection with I-10 at a location to be determined. This Feasibility Report Update will identify the improvements for each of the highways. The updated report will identify and evaluate alternative alignments for extending SR 210 and connecting SR 210 to I- 10 with a System Interchange. The evaluation will include alternative configurations of I-10 for each of the SR 210 alternative alignments. The Study will also include I-10 mainline and interchange modifications from I-19 to SR 83. Improvements to I-10 and the extension of SR 210 to a connection with I-10 will accommodate design year 2040 traffic Study Process for Update The purpose of the I-10/SR 210 Feasibility Study is to develop and evaluate alternatives for improvement of I-10 between I-19 and SR 83 and for the extension of SR 210 to a connection with I-10 to meet future traffic demands for Design Year The Feasibility Study presents various alternatives for accomplishing the necessary improvements and evaluates each alternative with recommendations for alternatives to be retained and carried forward for further study. During development of the Feasibility Report, improvement alternatives I, II and IIIc were identified and evaluated for the extension of SR 210 to several connection locations with I-10. The alternatives included incorporation of a system interchange where SR 210 would connect to I- 10. Improvement of the I-10 mainline and existing interchanges from I- 19 to SR 83 was included in the alternative evaluations. Traffic modeling of the alternatives was done for design year 2040 traffic projections to identify alternatives that would provide acceptable levels of service on both I-10 and SR 210. The additional alternative included in the Feasibility Report Update is Alternative IV. The Feasibility Report Update for I-10; Jct. I-19 to SR 83 & SR 210; Golf Links Road to I-10 was initiated with a Kickoff Meeting that included representatives from participating agencies. The meeting was held January 27, 2014 at the ADOT Tucson District Conference Room. See Meeting Notes, Appendix H. Progress Meetings for the Feasibility Report Update were held beginning in June 2014 to inform team members and agencies of progress and to obtain input relative to ongoing tasks on both I-10 and SR 210. See Meeting Notes, Appendix H. 1.2 Purpose and Need for the Project Purpose and Need for the Improvement of I- 10 The Interstate Highway System was intended to relieve congestion, improve safety, and enhance the economy by facilitating the movement of people and goods throughout the nation. Increasing traffic volumes on I-10 in the vicinity of Tucson, Arizona have contributed to reduced operational effectiveness, particularly the segment of I-10 between I-19 and SR 83. The traffic modeling accomplished for the combined I-10/SR 210 traffic analysis has demonstrated that north-south traffic demands through the project area are constrained by limitations on north-south arterial corridors. The UPRR switching yard located parallel to SR 210, north of I-10 prohibits any north-south arterials between Kino Parkway and Alvernon Way. The Davis-Monthan Air Force Base (AFB) prohibits any north-south arterials between Alvernon Way and Kolb Road. Traffic along I-10 concentrates at certain TIs where major north-south arterials exist. The number, type, and close proximity of access points to I-10 in this area compound the problem, contributing to an increase in local traffic using the Interstate Highway for short local trips. Conflicting interaction between local and regional/interstate traffic has led to a reduction in the capacity of I-10 to accommodate through travel. The numerous access points on I-10 present additional performance issues because they typically have their own operational limitations associated with location, proximity, design, and capacity. These limitations further slow travel on the I-10 mainline and lead to more conflict between local and regional traffic. The resulting combination of factors contributes to a growing degradation of the primary purpose and operational characteristics of I- 10 as originally designed, and compromises the purposes of the overall roadway network in the study area. Analysis of existing 2010 traffic shows that I-10 in the study area still operates at level of service (LOS) D or better in the AM and PM peak hours except for isolated areas where AM or PM peak hour LOS is less than LOS D, as discussed in Section 2.3, Traffic Operational Analysis, in this report. In the future, increasing traffic volumes on this segment of I-10 originating from anticipated growth to the south and east of downtown Tucson, as well as growing demands on I-10 as an interstate facility, will lead to capacity and access restrictions on and along the interstate. Poor operational performance for local, regional, and interstate traffic will result from operations on this portion of I-10 declining to LOS D then to LOS F by The decline from LOS D to LOS F will show the roadway is failing to function as intended with forced flow and extensive delays. The combination of demand exceeding capacity and poor access along I-10 will restrict and compromise the primary functions of the roadway network in the study area. The purpose of the proposed improvement to I-10 is to address deficiencies in the Interstate highway system through the study area and ultimately develop improvements that will provide satisfactory service levels on the Interstate highway through the 2040 design year Purpose and Need for the Extension of SR 210 to a Connection with I-10 SR 210 in the City of Tucson, Arizona, was built as an urban highway subsequent to the construction of I-10. SR 210 is approximately 3.4- miles long and is oriented in a northwest to southeast direction, extending southeast from West Broadway Boulevard at North 1 st Avenue, with intersections at Kino Parkway, East 22 nd Street, South Country Club Road, East 34 th Street, and South Palo Verde Road, before terminating at Alvernon Way / Golf Links Road. Much of SR 210 was constructed adjacent to the Union Pacific Railroad (UPRR); they share a number of grade separations from the City s street network. This proximity to the railroad minimizes the number of cross streets and access points to SR 210, which is advantageous to the use of SR 210 as an urban parkway. However, the presence of the UPRR switch yard serves as a barrier to north-south city arterials, which has a negative effect on traffic that is destined to and from North Tucson. Much of the north-south traffic that is blocked by the UPRR remains on I-10 to access major north-south arterials to reach their destinations. SR 210 is intended to provide motorists with an alternate route into Tucson s downtown business district from points east and south of downtown. 2

12 Figure 1.2 Vicinity Map 3
13 4 I-10; Jct. I-19 to SR 83 & SR 210; Golf Links Road to I-10 Feasibility Report Update The use of SR 210 as a business spur is limited by the fact that motorists on westbound I-10 desiring to access downtown Tucson via SR 210 must currently use city arterials to get from I-10 to SR 210. The additional trips on the city arterials tend to exceed the capacity of the local roadway network, which causes motorists to stay on I-10. Commercial and commuter traffic heading into downtown Tucson also use I-10 and add to peak hour congestion, causing increased volume and stress to the operation of the interstate highway. As is, the limited capacity and limited access for local trips prevents the existing roadway network in the study area from functioning as primarily intended. Since I-10 runs parallel to SR 210 approximately 1.75 miles south of SR 210, connecting SR 210 and I-10 would facilitate the intended use of SR 210 as a business spur. It would provide westbound local traffic with an attractive alternative to using I-10 for accessing downtown Tucson and would allow the interstate route to better serve through-traffic. For SR 210 traffic to increase to a level nearer capacity, local traffic currently using I-10 would require improved access via an extension of SR 210 to the south and east, likely connecting to I-10 somewhere between the existing Alvernon Way TI and the Rita Road TI south of DMAFB. This connection would allow SR 210 to become a viable alternative to I-10 for local traffic to and from the business, university and cultural districts in the downtown Tucson area. The purpose of extending SR 210 to an interchange with I-10 is to provide traffic originating east and south of downtown Tucson an alternative route to access the city center. Improved operational performance for local, regional, and interstate traffic would result from better utilization of SR 210 and improved operations on I Characteristics of the I-10 and SR 210 Corridors Characteristics of the I-10 Corridor The study area begins within the limits of the I-10/I-19 System Interchange at MP and extends eastward approximately 22 miles to I-10 MP 282.0, east of the I-10/SR 83 TI. See Figure 1-2 Vicinity Map. Property adjacent to I-10 is primarily industrial from I-19 east through Alvernon Way. East of Alvernon Way to approximately Rita Road, the adjacent property is a mixture of residential and commercial properties with areas that are undeveloped. From Rita Road through the end of the project at SR 83 the adjacent property is primarily undeveloped. The Union Pacific Railroad approaches I-10 from the north along the east side of Alvernon Way. The railroad turns and continues southeast approximately 250-feet north of I-10 for a short distance. The railroad and I-10 then separate and continue south-east about three-quarters of a mile apart. At the beginning of the project, I-10 turns from a north-south direction to an east-west direction as the corridor proceeds to the east. Just east of Park Avenue, I-10 turns to the southeast. From Park Avenue to the end of the project I-10 is oriented on a northwest to southeast diagonal that intersects the city street grid at approximately a 45-degree angle. From the beginning of the project at I-19 to Kino Parkway, I-10 has three lanes eastbound and three lanes westbound with 10-foot inside and outside shoulders. From Kino Parkway to the end of the project just east of SR 83, I-10 has two eastbound lanes and two westbound lanes with 10-foot outside shoulders and 4-foot inside shoulders. I-10 has a variable width median running through the project area. From the beginning of the project through 6 th Avenue the median width is 32- feet, with a concrete barrier located in the center of the median. Through the horizontal curve east of 6 th Avenue the median narrows to 26-feet. The 26-foot median continues to Park Avenue, where the median transitions to 60-feet wide and the concrete barrier ends. The 60-foot wide median continues to Kino Parkway, where the width of the median transitions to 84-feet wide. The 84-foot wide median continues to Valencia Road. The median width narrows to 68-feet wide through the horizontal curve on I-10 at Valencia Road. The 68-foot wide median continues through Houghton Road to approximately MP 277.4, where the eastbound and westbound roadways separate and continue on independent alignments to approximately MP 281.3, west of the SR 83 TI where the eastbound and westbound roadways come together and continue with an 88-foot median. The existing cross-slope of the I-10 roadway in tangent sections as shown on as-built plans is: Beginning of MP to MP 267.5: roadway cross-slope is -0.01ft/ft from median to shoulder. MP to End of MP 282.0: roadway cross-slope is ft/ft from median to shoulder. TIs are located at all of the major cross streets including from west to east: 6 th Avenue, Park Avenue, Kino Parkway, Palo Verde Road, Alvernon Way, Valencia Road, Craycroft Road, Wilmot Road, Kolb Road, Rita Road, Houghton Road, Wentworth Road / Colossal Cave Road, and SR 83. The Design Speed on I-10 through the project limits is 65 mph in accordance with the ADOT RDG for urban/fringe urban Controlled Access Highways. The speed limit on I-10 is 55 mph from I-19 through the Kino Parkway TI where the speed limit increases to 65 mph through Kolb Road TI. The speed limit then increases to 75 mph easterly through the end of the Feasibility Study area. Previous I-10 Projects Based upon available data at ADOT Engineering Records, the following I-10 projects have been completed within the Study Area. Table 1.1 Previous Projects Within the I-10 Study Area Project No. Begin MP End MP Const. Date Description UI-141(4) PCC + 10 AC IR 10-5(54) I-19 Park Ave. Remove & Replace Exist. EB, WB & Structures NH 10-5(71) I-19 Park Ave. Landscape & Irrigation ARRA 010- D(206)A I-19 Valencia Rd. FMS I-10-5(32) th Ave. TI Ramps, Vet OP & Fr. Rd. F 002-4(1) Veterans OP and Approaches MBS I Jct. I-19 TI Groove Ramps IM 10-5(77)P Jct. I-19 Craycroft Rd. Signing I-10-5(16) Vet OP Hughes Access Rd. GD I-10-5(28) Vet OP Valencia Rd. BC PCC I-10-5(42) Lighting & Safety ACIR-10-5(58) Park Ave. Valencia Rd. Pavement Rehab I Ajo Way OP (EB) Bridge Repair N , Kino & Craycroft TIs Minor Improvements I-10-5(30) Campbell Rd TI GD/Str I-10-5(17) Hughes Access Rd. East GD 010 E NFA Palo Verde TI Construct TI Lighting IR 10-5(55) Alvernon Way (Valencia- Irvington Rd) GD IR 10-5(61) Alvernon Way OP BP-IR-10- Kolb Rd.( I-10 Valencia 5(57) & BP-F Rd.) New TI 084-1(9) I-10-5(56) Valencia Rd. New TI I-10-5(5) & F 002-4(6) AC (EB) I-10-5(12) GD/AC (WB) IR-10-5(62) Valencia Rita Rd. Remove, Recycle, AC Olay
14 Table 1.1 Previous Projects Within the I-10 Study Area Project No. Begin MP End MP Const. Date IR-I-10-5(40) IR-10-5(30) ARRA 010- E(203)A ACIR 10-5(66) I-10-5(20) I-10-5(47) I-10-5(45) IM 10-5(74) ARRA 010- E(205)A I IM 010-E(1)P FI 18(19) I-10-5(10) Description Valencia Rd. Mtn. View TI Resurface I-10 Access Ramps (Kino Blvd/Ajo Way) Mod. TI, GD/AC Pave Rita Rd. Houghton Rd. Mill & Replace ½ AR-ACFC Rita Rd. Houghton Rd. Mill, Replace & ACFC Rita Rd. Mtn. View Rd AC (WB) Houghton Rd. Cochise C. L. Overlay Houghton Rd. Mtn. View Rd. Resurface Houghton Rd. Mtn View Rd. Pavement Pres. Houghton Rd. Mtn. View TI Mill & Replace AC & AR- ACFC Wash Bridge #689 Scour Protection Vail Rd. TI Minor TI Improvements Jct. SR 83 Cienega Wash Construct 40 Bit Pavement Mtn. View Pantano (WB) GD/AC Existing I-10 Right-of-Way The existing right-of-way (ROW) width of I-10 varies through the length of the project. At each TI the right-of-way increases substantially, depending on the configuration of the TI. The ROW is also increased to accommodate frontage roads. The following ROW mainline widths provide a general overview of the ROW corridor. However, it will be necessary to refer directly to the ADOT ROW plans for detailed information. From the I-19 TI to the 6 th Avenue TI Mainline ROW width is 200-feet. From the Park Avenue TI to the Valencia Road TI Mainline ROW width is 300-feet. From the Valencia Road TI to the Kolb Road TI Mainline ROW width is 280-feet. From the Kolb Road TI to the Rita Road TI Mainline ROW width varies from 300-feet to 400-feet. From the Rita Road TI through the Houghton Road TI to MP Mainline ROW width is 400-feet. At MP 277 the I-10 EB and WB roadways split into independent alignments. From MP 277 to MP 281 the ROW width of the I-10 mainline is: EB I feet south of the EB construction centerline. WB I-10 width varies with a 60-foot minimum north of the WB construction centerline. The area between the EB and WB construction centerlines is included in the I-10 ROW. From the SR 83 TI to the end of the project at MP 282 the width of the I-10 mainline ROW is 362-feet. Existing I-10 Structures The following existing structures are located along I-10 within the study area: Table 1.2 Existing I-10 Structures Milepost Structure No. Structure Name Spans/Str. Length Br. Rdwy. Width th Ave. Connector Br. 1/ th Avenue OP 4/ th Ave. TI UP 2/ Frontage Road. UPRR OP WB Loop Road. UPRR PB EB FR 3/ / Veterans UPRR OP 3/ Park Ave. TI OP EB 4/ Park Ave. TI OP WB 4/ Ramp K3 Over Ajo Way 2/ Ajo Way OP EB 4/ Ajo Way OP WB 4/ Kino Pkwy TI UP NB 7/ Kino Pkwy TI UP SB 6/ Diversion Channel Br EB 1/ Diversion Channel Br WB 1/ Country Club OP EB 3/ Country Club OP WB 3/ Table 1.2 Existing I-10 Structures Milepost Structure No. Structure Name Spans/Str. Length Br. Rdwy. Width Irvington Road. OP EB 4/ Irvington Road. OP WB 4/ Palo Verde TI OP EB 4/ Palo Verde TI OP WB 4/ Alvernon Way TI OP EB 2/ Alvernon Way TIOPWB 2/ Julian Wash RCB 6Brl/ Drexel Road. OP EB 3/ Drexel Road. OP WB 3/ Valencia Road. TI OP EB 4/ Valencia Road. TI OP WB 4/ Earp Wash Trib Br EB 4/ Earp Wash Trib Br WB 4/ Earp Wash Trib Br FR Br 4/ Earp Trib RCB/EB FR 3Brl/ Craycroft TI OP EB 4/ Craycroft TI OP WB 4/ Wilmot Road TI OP EB 4/ Wilmot Road. TI OP WB 4/ Kolb Road TI UP 2/ Rita Road TI UP 4/ Houghton Road TI UP 4/ Wash Bridge EB 4/ Wash Bridge WB 4/ Wash Bridge NFR 3/ RCBC NFR 2Brl/ Vail Road TI UP EB 3/ Vail Road TI UP WB 3/ SR 83 (Mtn View) TI UP 4/
15 1.3.2 Characteristics of the SR 210 Corridor The study area begins at the east end of SR 210 near Golf Links Road and Alvernon Way. The north-west end of the Davis-Monthan AFB is located just east of the end of SR 210. Alignments to extend SR 210 south-east to connect with I-10 will be identified east from Alvernon Way. The northern limits of the study area will be the southern boundary of Davis-Monthan AFB. Alignments to extend SR 210 will have to turn to the south to avoid Davis-Monthan AFB. Property through the study area for extending SR 210 is primarily industrial from Alvernon Way east to Craycroft Road. From Craycroft Road to the east the property is primarily residential with some undeveloped land. The Thomas Jay Regional Park is located to the east of Craycroft Road and south of the UPRR. The Pima Air Museum is located just east of Valencia Road and north of the UPRR. Previous SR 210 Projects Based upon available data at ADOT Engineering Records, the following project has been completed within the project limits. Table 1.3 Previous Projects within the SR 210 Study Area Project No. Begin MP End MP Const. Date Description M Grade, Drain, Pave, Structures Existing SR 210 Right-of-Way and Access Control Existing Right-of Way (ROW) for SR 210 is shown on the ADOT Right of Way Plan for the Aviation Corridor Highway; Park Avenue Palo Verde Road, SR 210; Project No. AZP The northern ROW line and the southern ROW line and access control line is shown on this set of plans. The north access control line is defined on the Results of Survey; Aviation Corridor Highway; 6 th Avenue Palo Verde Road; Project No. 210 PM 001 H R, Federal No. N PM(1). Access control is broken at 22 nd Street, 34 th Street and Richie Boulevard. The southern ROW and Access Control line is a common line with the northern UPRR Right-of-Way line. East of Palo Verde Road all existing ROW is Tucson City Street Rightof-Way. Existing SR 210 Structures The following existing structures are located along SR 210 within the study area. Table 1.4 Existing Structures - SR 210 Study Area Roadway Struct. No. Structure Name Spans/Str. Length Br. Rdwy. Width Golf Links Rd Aviation Hwy. Ramp OP 3/ Alvernon Way 9809 Aviation Hwy. UP Br. 1/86 76 Alvernon Way 9811 Alvernon NB FR. OP 3/ Alvernon Way 8733 Small Wash RCB 3/

16 2.1 Forward I-10 is one of the major travel routes in the State of Arizona. It serves national, regional and local trips connecting large metropolitan areas to rural communities. The I-10 corridor from I-19 to SR 90 provides connectivity between the rural communities of Sierra Vista and Benson in Cochise County to the Tucson urban core in Pima County. PAG is the agency responsible for the Tucson metropolitan area regional transportation planning. SouthEastern Arizona Governments Organization (SEAGO) is the counterpart for Cochise County. PAG has identified the SR 210 extension from Golf Links Road to I-10 as a vital connection required to meet future mobility needs in the Tucson metro area. PAG is in the process of finalizing the new 2045 Regional Transportation Plan (RTP). For this effort PAG reviewed and revised the forecasted regional growth. Due to the economic climate, PAG projected a more conservative growth with a significant reduction of population and employment in the PAG planning area. This has significantly impacted the study area travel demand and prompted a review of the recommendations made in the 2011 Initial Traffic Report. An Initial Traffic Report Addendum; I-10: Jct. Interstate 19 to SR 90/SR 210: Golf Links Road to I-10, has been prepared that identifies and evaluates the design year 2040 transportation needs for I-10 from I-19 east to SR 90 in Cochise County, and for the extension of SR 210 to connect with I-10. This Feasibility Report Update utilizes the Initial Traffic Report Addendum for the analysis of improvements to I-10 from I-19 to SR 83, and the extension of SR 210 to a connection with I Influence Area and Study Area Travel patterns and transportation facilities operations are very much influenced by land use growth assumptions for a particular area. To identify what the future transportation needs might be, it is first necessary to understand the area growth trends. For this purpose we have established an influence area shown in Figure 2.1, Influence Area and Study Area. An influence area is the locale with the highest potential influence on the transportation facility by either daily use of the facility or by proximity to the facility. For this feasibility study update the influence area is bounded to the north by Broadway Road, to the south by Sahuarita Road, to the east by SR 83, and to the west by I- 19. The study area for both corridors includes the areas up to one mile on either of I-10 and the future SR-210 extension. In addition, the area from 2 TRAFFIC AND CRASH DATA Palo Verde Road to Rita Road along I-10 was analyzed for potential termini of the SR-210 extension. Figure 2.1 Influence Area and Study Area 7
17 2.2 Traffic Forecast Technical Process and Assumptions A regional travel demand model is a planning tool used to assess how transportation systems will perform based on the future land use and forecasted growth in the study area. The current transportation system is often used as the initial roadway system and new improvements are identified based on the future demand. Using the travel demand model as a planning tool, future transportation needs are assessed and potential roadway improvements are modeled and evaluated. The macro scale nature of this tool only provides a planning evaluation for the operation of roadway between intersections or interchanges. It provides an order of magnitude of the travel demand to help us identify the location, type and capacity of the improvements. The 2014 PAG Travel Demand Model and the Northwest Cochise County Transportation Plan which forecasted travel demand has been utilized to identify future transportation deficiencies, reduced mobility and bottleneck locations in the study area PAG Travel Demand Model The (2014) PAG Travel Demand Model, for the design year 2040, was obtained for the study at the end of February The model covers approximately 4,300 square miles in Pima County and includes the more populated urban areas of Tucson, Marana, Oro Valley and Green Valley. However for this study, the modeling efforts were focused in the area of influence. In 2011 PAG conducted an external travel survey to better understand the patterns of the traveling public in, out and through the PAG planning area. The survey results were used to calibrate the external travel component of the model. The new 2010 Census information and the American Community Survey data provided more accurate information about population distribution and current travel characteristics in the PAG region. These items together with new growth assumptions directly affect future travel on I-10 and SR Socioeconomic Data Socioeconomic data in the PAG model consists of population, housing units, and employment and is compiled at the Traffic Analysis Zone (TAZ) level. Traffic Analysis Zones (TAZs) are geographic zonal units used to tabulate land use and employment data. Boundaries of the TAZs are defined based on similar land uses, physical barriers, and major streets in the transportation system. PAG revised the TAZ structure used in the 2011 Initial Traffic Report. Some large TAZs in the influence area were split to provide a better and more accurate access to the future roadways in the network. The New Traffic Analysis Zone (TAZ) Structure exhibit in Appendix B, Traffic Modeling presents the 2040 PAG model TAZs within the area of influence. The new 2045 PAG model socioeconomic data and TAZs were not revised for this study. For this study we assumed that the 2045 population will be in place by 2040 as a conservative assessment. The socioeconomic data provided for this study in February 2014 was not final. The overall population and employment forecast will not change, but its allocation may change slightly. Future model traffic volumes are a result of the PAG 2040 population, housing units, and employment projections. Table and 2040 Socioeconomic Summary displays the socioeconomic data for years 2010 and 2040 for the influence area and for the entire PAG model area. By 2040 the PAG model area will have approximately 1.45 million people, a 31 percent increase from 2010 which correlates to a linear growth rate of 1.04 percent per year. By 2040, the area of influence is estimated to have a population of 612,243, an increase of 47 percent and a linear growth rate of 1.6 percent per year. Employment in the PAG region will double by 2040 from 307,249 to 613,575 in the PAG model area and from 156,482 to 294,231 in the influence area. The New 2040 Population and the New 2040 Total Employment exhibits in Appendix B, Traffic Modeling display the 2040 population density and employment density within the area of influence respectively. As the figures illustrate, the area of influence is planned for residential growth with some employment concentrated along I-10 and I-19. With the major employment located in the northwestern portion of the influence area, in the vicinity of downtown Tucson, residents will have to travel through the influence area to reach employment centers. Table and 2040 Socioeconomic Summary RTP Area of Influence PAG Model Area Area of Influence PAG Model Area Total Population 416,990 1,109, ,243 1,455,443 Population in Housing Units 398,755 1,082, ,445 1,431,551 Population in Group Quarters 18,213 27,043 15,798 23,892 Institutionalized Population 5,862 11,038 Non-institutionalized Population 12,378 16,105 Housing Units 152, , , ,457 Total Employees* 156, , , ,575 Retail 15,717 36,201 40,639 83,817 Whole Sale 5,243 8,336 9,509 16,488 Fire 7,791 16,986 17,516 39,474 Industrial 26,644 42,016 47,279 78,018 Service 74, , , ,555 Public Service 26,722 44,709 29,652 44,223 David Monthan Air Force Base 10,283 10,283 7,340 7,340 *Does not include the employment at David Monthan Air Force Base 8


18 2.2.4 Roadway Network System I and II roadway networks, developed for the 2011 Initial Traffic Report were used as the starting point for validating the recommended alternatives. Due to various environmental and design issues, System IIIc was eliminated and was replaced by System IV. System IV introduces a collector distributor road on I-10 from the I-10/SR 210 interchange to Kolb Road to provide congestion relief to I-10 in that section of the proposed improvement Sensitivity Analysis To verify if the improvements recommended in the 2011 Initial Traffic Report were still applicable, future forecasted traffic volumes were generated using the new 2040 socioeconomic data and System I and II roadway network alternatives. This step was also necessary in order to identify the magnitude of the change in travel demand between the old model assumptions and the new model assumptions. Based on the new traffic forecast, the recommended improvements for each system were reviewed. Due to the decrease in population and employment, especially in the study area, the decrease in future travel demand was significant. This resulted in the reduction of one lane in each direction along I-10 from Alvernon Way to SR 90 from the configuration recommended in the 2011 Initial Traffic Report. System I and II where revised to include one less lane along I-10 from Alvernon and SR 90. System IV was developed using the same assumptions. Figure 2.3, 2040 Number of Lanes System I, Figure 2.4, 2040 Number of Lanes System II, and Figure 2.5, 2040 Number of Lanes System IV depict the revised System I, II and IV roadway number of lanes respectively No-Build Scenario The No build scenario is often used to determine how future transportation systems operate without planned improvements on specific facilities. This will also help locate and quantify future travel needs and deficiencies. For this analysis, the 2040 revised roadway network was used, but the I-10 and SR 210 facilities were coded to current conditions. The primary purpose of the No-Build is to create a benchmark against which the System Alternatives will be compared Forecasted Traffic Volumes Future forecasted traffic volumes were generated using the new 2040 socioeconomic data and future System I, II and IV roadway network alternatives. The traffic volumes were reviewed for reasonability and compared to other study results for consistency. In addition, the forecasted traffic volumes were used to evaluate the performance of the improvements based on the following measures: level-of-service (LOS), vehicle miles traveled (VMT), vehicle hours traveled (VHT) and screenline analysis Roadway Level of Service Roadway segment level-of-service (LOS) is a qualitative measurement describing traffic conditions in terms of speed, travel time, freedom to maneuver, comfort, convenience, traffic interruptions, and safety. Six classifications, designated by the letters A through F, are used to define level-of-service. LOS A represents the best free flow conditions, whereas LOS F represents heavily congested flow with traffic demand exceeding highway capacity. Roadway planning level capacities stratified by functional classification and area types were applied to each roadway segment in the study network. For regional planning purposes, unsatisfactory capacity of a roadway segment is typically defined as the forecasted annual average daily traffic (AADT) that results in LOS E-F in the urban environment and D-F in the rural environment. Typically these conditions are characterized by low travel speeds, between two points, and are reflective of speeds that are much below the posted speeds. For this study, roadway configurations and capacity improvements were made until a planning level LOS E and LOS D were achieved in the urban and rural areas respectively for the majority of the roadways in the study area. Figure LOS Depiction presents a visual representation of LOS with respect to traffic flow. Figure LOS Depiction LOS C LOS E LOS D LOS F A factor that affects traffic flow and ultimately LOS is a roadway s directional or per lane capacity. This capacity is a designation of how much traffic a roadway segment can carry, and is usually based on the road s functional classification as defined by U.S. Department of Transportation. The daily volume to capacity ratio (v/c) was used to calculate the roadway segment LOS. Table 2.2 V/C and LOS shows the relationship between v/c, LOS and congestion used on all roadways in this study area. Roadways with unsatisfactory levels of service, LOS E and F, are identified by orange and red lines on the roadway map. These unsatisfactory LOS levels are generally associated with the high traffic volume roads, such as I-10, I-19, Kino Parkway and Valencia Road. These v/c values were compared with v/c resulting from the alternative roadway networks identified in the study and used to determine the effectiveness of each alternative. Table 2.2 V/C and LOS V/C LOS Congestion A-C Low D Medium E High <1.0 F Severe VMT and VHT Vehicle miles traveled (VMT) and vehicle hours traveled (VHT) are frequently used to measure congestion. VMT refers to the number of miles that are traveled in a day, while VHT refers to the amount of time spent traveling in a day. Their ratio is often referred to as the average network speed. Since the speed is an average for an entire roadway system, minor changes are significant. Regardless if VMT increases, VHT should decrease to confirm improved performance. This results in an increase in the average network speed and improved mobility. 9
19 Figure Number of Lanes System I 10

20 Figure Number of Lanes System II 11
21 Figure Number of Lanes System IV 12

22 Screenlines In addition to reviewing the daily congestion levels and traffic volumes, a screen line analysis was conducted to evaluate the impacts of the improvements. Screenlines are imaginary lines that cross arterials at specific locations. Traffic volume results from the various system alternatives were compared at those locations. As presented in Figure 2.6 Screenlines, ten (10) screenlines were strategically placed throughout the area of influence to capture the distribution of traffic on the surrounding facilities for each scenario. The resulting volume for each screenline provides an indication of how the improvements on I-10 or SR 210 will affect the east-west or north-south thoroughfares in the influence area. Figure 2.6 Screenlines Turning Movement Module A separate module, using TransCAD, was developed for the study to estimate turning movement volumes at specific intersection locations within the influence area. Turning movement volumes from the model were post processed based on traffic count data and utilized in the operational analysis of the facilities and intersections during Traffic Operational Analysis portion of the study described in Section 2.3, Traffic Operational Analysis of this report System Alternatives Upon review of the alternative analysis results and stakeholder input, the three distinct system alternatives were finalized: System I comprised of interchange and mainline improvements along I-10 and SR 210 with a System Interchange at I-10 and Alvernon Way. System II comprised of interchange and mainline improvements along I-10 and SR 210 with a System Interchange at I-10 west of Valencia Road. System IV System comprised of interchange and mainline improvements along I-10 and SR 210 with a System Interchange at Alvernon Way and a collector distributor roadway from Alvernon Way to Kolb Road I-10 Summary of Findings The 2040 System I Level Of Service, the 2040 System II Level Of Service and the 2040 System IV Level Of Service exhibits in Appendix B, Traffic Modeling display the volumes and levels of congestion through the project area and Table 2.3 Summary of Findings by System Alternatives I-10 displays the level-ofservice (LOS) summary of findings in tabular form. All system alternatives show definite improvements when compared to the No- Build scenario, especially on the segment between Kino Parkway and Rita Road. Systems I and II show LOS D between Alvernon Way and Rita Road, while System IV only shows LOS D between Kolb Road and Rita Road. This is to be expected due to the presence of the collectordistributor roadways in System IV. Table 2.3 Summary of Findings by System Alternatives I-10 Location I-19-6th St 6th St - Kino Pkwy Kino Pkwy - Country Club Rd Country Club Rd - Alvernon Way Alvernon Way - Valencia Rd Valencia Rd - Craycroft Rd Craycroft Rd - Wilmont Rd Wilmont Rd - Kolb Rd Kolb Rd - Rita Rd Rita Rd - Houghton Rd Houghton Rd - Wentworth Rd Wentworth Rd - SR 83 SR 83 - Mescal Rd Mescal Rd - SR 90 CONGESTION LEVELS I No Build System I System II System IV LOS A - C D E F SR 210 Summary of Findings All segments of SR 210 operate at a good LOS in the No-Build and all system alternatives. However, in System II the segment of SR 210 from Alvernon Way to Valencia displays LOS F. This is attributed to the facility type (parkway) planning level capacity used in this analysis, which is much lower than the freeway capacity. Table 2.4 Summary of Findings by System Alternatives SR 210 displays the summary of findings. Table 2.4 Summary of Findings by System Alternative - SR 210 Location Broadway Blvd - Kino Pkwy Kino Pkwy - 22nd St 22nd St - County Club Rd Country Club Rd - Alvernon Way Alvernon Way - I-10 Alvernon Way - Valencia Rd CONGESTION LEVELS SR No Build System I System II System IV LOS A - C D E F 13
23 System Alternatives Scenario Screenline Analysis The screenline analysis, displayed in Table System Alternatives Screenline Analysis for the system alternatives, shows an overall decrease of traffic on arterials along I-10 between the No-Build and any of the system alternatives. The increased capacity on I-10 in the system alternatives provides the most relief to the arterials in screenlines 4, 5 and 6. Table System Alternatives Screenline Analysis Screenline Year 2040 Volumes No Build System I System II System VI 1 199, , , , , , , , , , , , , , , , , , , , , , , , ,202 86,403 86,841 85, , , , , , , , , ,458 79,504 79,927 79, System Alternatives Scenario Mobility Improvement Analysis The VMT and VHT for all system alternatives shown in Table 2.6 VMT and VHT System Alternatives I, II and IV are very similar with System IV producing the best average speed, even if the difference between systems is very minor. Table 2.6 VMT and VHT System Alternatives I, II and IV ALTERNATIVES VMT VHT Speed No Build 13,735, , System I 14,211, , System II 14,211, , System IV 14,232, ,
24 2.3 Traffic Operational Analysis A Traffic Operational Analysis was conducted to evaluate the effectiveness of the existing roadway and traffic conditions and to evaluate the improvement alternatives developed to handle future traffic volumes as projected by the 2040 PAG Travel Demand Model. The study limits for the traffic operational analysis included I-10 from I- 19 to SR 83, and SR 210 from 34 th Street to Alvernon Way. The study area included freeway mainline, ramps, arterials, traffic interchange intersections, and intersections adjacent to the interchange that are directly affected by the interchange operations Methodology The regional traffic modeling provided a macroscopic analysis of the potential improvement alternatives and provided information on the general number of lanes and general concept of the interchanges for future conditions. The traffic operational analysis evaluates the peak hour traffic volumes obtained from the regional modeling efforts, at a microscopic level, to refine and ensure that the improvement alternatives are operationally feasible. This is an iterative process and takes into account existing and future roadway characteristics, traffic volumes, traffic control measures, and access spacing. The methodology involved in the operational analysis included the following: Spot Checks were conducted on mainline freeway segments and merge/diverge areas, for the proposed improvement alternatives, per the Highway Capacity Manual (HCM) using the Highway Capacity Software (HCS). The optimal configuration and operation of the traffic interchange intersections and adjacent arterial intersections were evaluated using the Synchro/Sim Traffic software. The AM and PM peak-hour operations of the roadway network system within the study area were modeled using the VISSIM microsimulation software and included: o I-10: mainline, merge/weave areas, ramps, ramp junctions with cross streets, traffic interchange intersections and adjacent intersections directly impacted by the interchange operations. o SR 210 (Barraza-Aviation Parkway): arterial, signalized and unsignalized intersections, and ramps. VISSIM is a microscopic time step and behavior based simulation model developed to model urban traffic and public transit operations. The program can analyze traffic and transit operations under constraints such as lane configuration, traffic composition, traffic signals, transit stops, etc. This makes it a useful tool for the evaluation of various alternatives based on transportation engineering and planning measures of effectiveness. The measures of effectiveness (MOE s) obtained from the VISSIM microsimulation model include delay, speed, volume/density, queues, etc. These are then translated into a level-ofservice (LOS) description by facility type, based on the 2010 Highway Capacity Manual definitions. Level-of-service is a qualitative measure of the operational efficiency or effectiveness of a roadway. Six levels of service are defined and are designated by letters ranging from A through F, with LOS A representing the best range of operating conditions and LOS F representing the worst. The specific terms in which each level of service is defined vary with the type of facility involved. Per ADOT Roadway Design Guidelines, for mainline I-10 and SR 210, LOS D is the design criteria for urban conditions while LOS B is the design criteria for rural conditions Operational Analysis A traffic operational analysis was conducted using the VISSIM microsimulation model for the following five scenarios: 1. Year 2010: Existing The existing roadway network within the study area was evaluated using traffic data collected in year The section of I-10 between I-19 and Houghton is considered urban in character, and the section of I-10 between Houghton and SR 83 is considered rural in character. SR 210 within the study area is considered urban in character. 2. Year 2040: No-Build The existing roadway network within the study area was evaluated with the projected year 2040 traffic volumes. Under this scenario there were no proposed improvements made to either I-10 or SR 210. The section of I-10 between I-19 and SR 83 as well as SR 210 within the study area are considered urban in character. 3. Year 2040: System I An improved roadway network (improvements to freeway/highway, ramps, and traffic interchange intersections) was evaluated with the projected year 2040 traffic volumes. In the System I roadway improvement alternative, SR 210 is extended as a freeway along the Alvernon Way alignment to connect to I-10 at a system interchange. The section of I-10 between I-19 and SR 83 as well as SR 210 within the study area are considered urban in character. 4. Year 2040: System II An improved roadway network (improvements to freeway/highway, ramps, and traffic interchange intersections) was evaluated with the projected year 2040 traffic volumes. In the System II roadway improvement alternative, the freeway connection from I-10 to SR 210 begins just west of Valencia Road and continues parallel to the Davis-Monthan Air Force Base (AFB) before tying into the existing SR 210. The section of I-10 between I-19 and SR 83 as well as SR 210 within the study area are considered urban in character. 5. Year 2040: System IV An improved roadway network (improvements to freeway/highway, ramps, and traffic interchange intersections) was evaluated with the projected year 2040 traffic volumes. In the System IV roadway improvement alternative, SR 210 is extended as a freeway along the Alvernon Way alignment to connect to I-10 at a system interchange. A collector-distributor roadway parallels I-10 in both directions between the I-10/SR 210 interchange and Kolb Road. The section of I-10 between I-19 and SR 83 as well as SR 210 within the study area are considered urban in character Results of Operational Analysis The following figures summarize the results of the I-10 Mainline Operational Analysis: Year 2010 Existing Conditions Mainline: For more details, refer to Figure 2.7: I Existing Conditions Mainline Lanes & LOS Summary on page 18. For the section of I-10 between I-19 and Houghton Road, the LOS is D or better in both the AM and PM peak hour. For the section of I-10 between Houghton Road and SR 83, the LOS is B or better in both the AM and PM peak hour, except: I-10 EB between Houghton Road and Wentworth Road operates at LOS F in the PM peak hour due to the EB Off-ramp traffic backing up onto the mainline. Ramps: For more details, refer to Table 2.7 I-10 Ramps LOS Summary on page 23. For the section of I-10 between I-19 and Houghton Road, the LOS is D or better in both the AM and PM peak hour, except: I-10 EB Off-ramp to Kino Parkway NB operates at LOS E in the AM peak hour due to queuing backups at the stop control. I-10 EB Off-ramp to Rita Road operates at LOS F in the AM peak hour due to queuing backups at the stop control. I-10 EB Off-ramp to Houghton Road operates at LOS F in the PM peak hour due to queuing backups at the stop control. For the section of I-10 between Houghton Road and SR 83, the LOS is B or better in both the AM and PM peak hour, except: 15
25 I-10 EB Off-ramp to Wentworth Road operates at LOS F in the PM peak hour due to queuing backups at the stop control. I-10 WB On-ramp from Wentworth Road operates at LOS C in the AM peak hour. Intersections: For more details, refer to Table 2.9 I-10 Intersection LOS Summary on page 26; and Table 2.10 SR 210 Intersection LOS Summary on page 27. For the section of I-10 between I-19 and Houghton Road, all the intersections in the vicinity of the project operate at LOS D or better during the AM and PM peak hour, except: I-10 WB ramp and Valencia Road operates at LOS E during the AM peak hour. For the section of I-10 between Houghton Road and SR 83, all the intersections in the vicinity of the project operate at LOS B or better during the AM and PM peak hour. except: I-10 EB ramp and Wentworth Road operates at LOS C during the PM peak hour. For the section of SR 210 between Broadway Boulevard and Alvernon Way, all the intersections operate at LOS C or better during the AM and PM peak hour. Year 2040 No Build Mainline: For more details, please refer to Figure 2.8: I-10 No-Build Alternative Mainline Lanes & LOS Summary on page 19. For the section of I-10 between I-19 and SR 83, the LOS is E or worse in both the AM and PM peak hour, except: I-10 WB section between Rita Road and Houghton Road operates at LOS D in the PM peak hour. I-10 WB section between Houghton Road and Wentworth Road operates at LOS C in both the AM and PM peak hour. I-10 EB section between Wentworth Road and SR 83 operates at LOS A in the AM peak hour and LOS C in the PM peak hour. I-10 WB section between Wentworth Road and SR 83 operates at LOS B in both the AM and PM peak hour. I-10 EB section east of SR 83 operates at LOS A in both the AM and PM peak hour. I-10 WB section east of SR 83 operates at LOS A in the AM peak hour and LOS B in the PM peak hour. Ramps: For more details, please refer to Table 2.7 I-10 Ramps LOS Summary on page 23. For the section of I-10 between I-19 and SR 83, the LOS is E or worse in both the AM and PM peak hour, except: I-10 WB off-ramp to I-19 operates at LOS D in the AM peak hour and LOS B in the PM peak hour. I-10 EB off-ramp to 6 th Avenue operates at LOS C in the AM peak hour and LOS B in the PM peak hour. I-10 WB on-ramp from 6 th Avenue operates at LOS C in the AM peak hour and LOS D in the PM peak hour. I-10 WB off-ramp to 6 th Avenue operates at LOS B in both the AM and PM peak hour. I-10 EB off-ramp to Park Avenue operates at LOS D in the AM peak hour. I-10 WB on-ramp from northbound Park Avenue operates at LOS B in both the AM and PM peak hour. I-10 WB off-ramp to Park Avenue operates at LOS D in the AM peak hour. I-10 EB on-ramp from northbound Kino Parkway operates at LOS A in both the AM and PM peak hour. I-10 WB on-ramp from Kino Parkway operates at LOS B in the AM peak hour and LOS D in the PM peak hour. I-10 WB on-ramp from Ajo Way operates at LOS D in the AM peak hour and LOS C in the PM peak hour. I-10 WB off-ramp to Ajo Way operates at LOS C in the PM peak hour. I-10 WB on-ramp from Hotel Drive operates at LOS A in the AM peak hour and LOS B in the PM peak hour. I-10 WB off-ramp from Hotel Drive operates at LOS C in the AM peak hour and LOS B in the PM peak hour. I-10 EB off-ramp to Alvernon Way operates at LOS A in both the AM and PM peak hour. I-10 WB off-ramp to Alvernon Way operates at LOS B in both the AM and PM peak hour. I-10 WB on-ramp from Valencia Road operates at LOS C in both the AM and PM peak hours. I-10 EB off-ramp to Craycroft Road operates at LOS C in the AM peak hour. I-10 WB on-ramp from Craycroft Road operates at LOS C in the PM peak hour. I-10 WB on-ramp from Wilmot Road operates at LOS C in both the AM and PM peak hour. I-10 WB off-ramp to Wilmot Road operates at LOS C in the PM peak hour. I-10 EB off-ramp to Kolb Road operates at LOS C in the PM peak hour. I-10 WB on-ramp from Kolb Road operates at LOS A in both the AM and PM peak hour. I-10 WB on-ramp from Rita Road operates at LOS C in the AM peak hour. I-10 WB on-ramp from Houghton Road operates at LOS C in the PM peak hour. I-10 WB on-ramp from Wentworth Road operates at LOS C in both the AM and PM peak hour. I-10 EB on-ramp from Wentworth Road operates at LOS A in both the AM and PM peak hour. I-10 WB off-ramp to Wentworth Road operates at LOS A in the AM peak hour and LOS B in the PM peak hour. I-10 EB off-ramp to SR 83 operates at LOS A in the AM peak hour. I-10 EB on-ramp from SR 83 operates at LOS A in both the AM and PM peak hour. I-10 WB on-ramp from SR 83 operates and LOS C in the AM peak hour and LOS B in the PM peak hour. I-10 WB off-ramp to SR 83 operates at LOS A in the AM peak hour. Intersections: For more details, please refer to Table 2.9 I-10 Intersection LOS Summary on page 26; and Table 2.10 SR 210 Intersection LOS Summary on page 27. For the section of I-10 between I-19 and SR 83, all the intersections in the vicinity of the project operate at LOS E or worse during the AM and PM peak hour, except: Palo Verde Road and Irvington Road operates at LOS D in both the AM and PM peak hour. Hotel Drive and Irvington Road operates at LOS D in both the AM and PM peak hour. Alvernon Way and Irvington Road operates at LOS D in the AM peak hour. I-10 EB ramp and Alvernon Way operates at LOS B in the AM peak hour. For the section of SR 210 between 34 th Street and Alvernon Way, all the intersections operate at LOS E or worse during the AM and PM peak hour, except: SR 210 and 34 th Street operates at LOS A in both the AM and PM peak hour. Palo Verde Road and the Frontage Road operates at LOS A in both the AM and PM peak hour. 16
26 Palo Verde Road and 37 th Street operates at LOS A in both the AM and PM peak hour. SR 210 and Alvernon Way operates at LOS C in both the AM and PM peak hour. Year 2040 System Alternative I Improvements Mainline: For more details, refer to Figure 2.9 I-10 System Alternative I 2040 Build - Mainline Lanes & LOS Summary on page 20. For the section of I-10 between I-19 and SR 83, the LOS is C or better in both the AM and PM peak hour. SR 210 Mainline: For more details, please refer to Figure 2.9: I-10 System I Alternative 2040 Build - Mainline Lanes & LOS Summary on page 20. For the section of SR 210 between 34 th Street and the I-10/SR 210 system interchange, the LOS is D or better in both the AM and PM peak hour. I-10 Ramps: For more details, please refer to Table 2.7 I-10 Ramps LOS Summary on page 23. For the section of I-10 between I-19 and SR 83, the LOS is D or better in both the AM and PM peak hour. SR 210-Ramps: For more details, refer to Table 2.8 SR 210 Ramps LOS Summary Table on page 25. For the section of SR 210 between Golf Links Road and the I-10/SR 210 system interchange, the LOS is B or better in both the AM and PM peak hour. Intersections: For more details, refer to Table 2.9 I-10 Intersection LOS Summary on page 26; and Table 2.10 SR 210 Intersection LOS Summary on page 27. For the section of I-10 between I-19 and SR 83, all the intersections in the vicinity of the project operate at LOS C or better during the AM and PM peak hour. For the section of SR 210 between 34 th Street and the I-10/SR 210 system interchange, all the intersections operate at LOS C or better during the AM and PM peak hour. Year 2040 System Alternative II Improvements Mainline: For more details, refer to Figure 2.10 I-10 System Alternative II 2040 Build - Mainline Lanes & LOS Summary on page 21. For the section of I-10 between I-19 and SR 83, the LOS is C or better in both the AM and PM peak hour. SR 210 Mainline: For more details, please refer to Figure 2.10: I-10 System II Alternative 2040 Build - Mainline Lanes & LOS Summary on page 21. For the section of SR 210 between 34 th Street and the I-10/SR 210 system interchange, the LOS is C or better in both the AM and PM peak hour. I-10 Ramps: For more details, refer to Table 2.7 I-10 Ramps LOS Summary on page 23. For the section of I-10 between I-19 and SR 83, the LOS is D or better in both the AM and PM peak hour. SR 210 Ramps: For more details, refer to Table 2.8 SR 210 Ramps LOS Summary on page 25. For the section of SR 210 between Golf Links Road and the I-10/SR 210 system interchange, the LOS is C or better in both the AM and PM peak hour. Intersections: For more details, refer to Table 2.9 I-10 Intersection LOS Summary on page 26; and Table 2.10 SR 210 Intersection (LOS) Summary on page 27. For the section of I-10 between I-19 and SR 83, all the intersections in the vicinity of the project operate at LOS C or better during the AM and PM peak hour. For the section of SR 210 between 34 th Street and Alvernon Way, all the intersections operate at LOS C or better during the AM and PM peak hour. Year 2040 System Alternative IV Improvements Mainline: For more details, please refer to Figure 2.11: I-10 System IV Alternative 2040 Build - Mainline Lanes & LOS Summary on page 22. For the section of I-10 between I-19 and SR 83, the LOS is C or better in both the AM and PM peak hour. For the CD roadway between the I-10/SR 210 system interchange and Kolb Road, the LOS is C or better in both the AM and PM peak hour. SR 210 Mainline: For more details, please refer to Figure 2.11: I-10 System IV Alternative 2040 Build - Mainline Lanes & LOS Summary on page 22. For the section of SR 210 between 34 th Street and the I-10/SR 210 system interchange, the LOS is C or better in both the AM and PM peak hour. I-10 Ramps: For more details, please refer to Table 2.7: I-10 Ramps LOS Summary on page 23. For the section of I-10 between I-19 and SR 83, the LOS is D or better in both the AM and PM peak hour. SR 210 Ramps: For more details, please refer to Table 2.8: SR 210 Ramps LOS Summary on page 25. For the section of SR 210 between Golf Links Road and the I-10/SR 210 system interchange, the LOS is B or better in both the AM and PM peak hour. Intersections: For more details, please refer to Table 2.9: I-10 Intersection LOS Summary on page 26, and Table 2.10 SR 210 Intersection LOS Summary on page 27. For the section of I-10 between I-19 and SR 83, all the intersections in the vicinity of the project operate at LOS D or better during the AM and PM peak hour. For the section of SR 210 between 34th Street and the I-10/SR 210 system interchange all the intersections operate at LOS C or better during the AM and PM peak hour. 17
27 Figure 2.7 I-10 Existing Conditions 2010 Mainline Lanes & LOS Summary 18
28 Figure 2.8 I-10 No-Build Alternative 2040 Mainline Lanes & LOS Summary 19
29 Figure 2.9 I-10 System Alternative I 2040 Build Mainline Lanes & LOS Summary 20
30 Figure 2.10 I-10 System Alternative II 2040 Build Mainline Lanes & LOS Summary 21
31 Figure 2.11 I-10 System Alternative IV 2040 Build Mainline Lanes & LOS Summary 22
32 Traffic Interchange (TI) I-10 & I-19 System 6 th Ave. Park Ave. Kino Pkwy. Ajo Way Country Club Rd. Palo Verde Rd. Irvington Rd. Table 2.7 I-10 Ramps LOS Summary Table Operational Analysis Scenarios Ramp Name 2010 Existing LOS 2040 No Build LOS System I LOS System II LOS System IV LOS AM Peak Hr PM Peak Hr AM Peak Hr PM Peak Hr AM Peak Hr PM Peak Hr AM Peak Hr PM Peak Hr AM Peak Hr PM Peak Hr I-10 WB to I-19 SB Ramp A C D F C C C D C C I-19 NB to I-10 EB Ramp C B F F C B C B C C WB Off-Ramp A A B B B B B A B B WB On-Ramp A B C D B B B B B B EB Off-Ramp B A C B B B B B B B EB On-Ramp A A D F A B A B B B WB Off-Ramp A A D E B B C B B C WB On-Ramp A B C D B C B D B C EB Off-Ramp B A D F B B B A B B EB On-Ramp A A F F A A A A A A EB Off-Ramp to SB Kino Pkwy. B A F F (2) (2) (2) (2) (2) (2) EB Off-Ramp to NB Kino Pkwy. E A F F (2) (2) (2) (2) (2) (2) EB On-Ramp from SB Kino Pkwy. A A F F B C B C B C EB On-Ramp from NB Kino Pkwy. A A A A (2) (2) (2) (2) (2) (2) WB Off-Ramp (1) (1) (1) (1) C B C B C B WB On-Ramp B B B D B C B C B C EB Off-Ramp (1) (1) (1) (1) B B B B B B EB On-Ramp (1) (1) (1) (1) A A B D A A WB Off-Ramp B A F C (2) (2) (2) (2) (2) (2) WB On-Ramp A C D C (2) (2) (2) (2) (2) (2) WB Off-Ramp (1) (1) (1) (1) B B B B C B WB On-Ramp (1) (1) (1) (1) C D C D B C EB Off-Ramp (1) (1) (1) (1) C B C B C B EB On-Ramp (1) (1) (1) (1) B B A B B B EB Off-Ramp to SB Palo Verde Rd. A A F F (2) (2) (2) (2) (2) (2) EB Off-Ramp to NB Palo Verde Rd. B A F F (2) (2) (2) (2) (2) (2) EB On-Ramp from SB Palo Verde Rd. A D F F (2) (2) (2) (2) (2) (2) WB On-Ramp from SB Palo Verde Rd. A B F F (2) (2) (2) (2) (2) (2) WB Off-Ramp A A C B (2) (2) (2) (2) (2) (2) WB On-Ramp B D A B (2) (2) (2) (2) (2) (2) (1) Currently not a ramp. (2) Not a future ramp. 23
33 Traffic Interchange (TI) Alvernon Way I-10 & SR 210 System Valencia Rd. Craycroft Rd Wilmot Rd Kolb Rd. Rita Rd. Houghton Rd. Wentworth Rd. Table 2.7 (Continued) I-10 Ramps LOS Summary Table Operational Analysis Scenarios Ramp Name 2010 Existing LOS 2040 No Build LOS System I LOS System II LOS System IV LOS AM Peak Hr PM Peak Hr AM Peak Hr PM Peak Hr AM Peak Hr PM Peak Hr AM Peak Hr PM Peak Hr AM Peak Hr PM Peak Hr WB Off-Ramp B A B B A A B A A A WB On-Ramp (1) (1) (1) (1) A C C C A C EB Off-Ramp A A A A A A B B A B EB On-Ramp A B E F A B A B A A I-10 WB to SR 210 NB (1) (1) (1) (1) B B C B B A I-10 EB to SR 210 NB (1) (1) (1) (1) A A A A B A SR 210 SB to I-10 EB (1) (1) (1) (1) A B A B A B SR 210 SB to I-10 WB (1) (1) (1) (1) A A A A A A WB Off-Ramp B A F F C B B B B C WB On-Ramp B A C C D D B B B B EB Off-Ramp A B F F C D A B B B EB On-Ramp A A F F B C B C B C WB Off-Ramp A A F F B A A A A A WB On-Ramp A A F C B B B B B B EB Off-Ramp A A C F A B A B A B EB On-Ramp A A F F A B A B A B WB Off-Ramp A A F C A A A A A A WB On-Ramp A A C C C C D C C C EB Off-Ramp A A F F B C B C B C EB On-Ramp A A E E A A A A A B WB Off-Ramp A A F F B B B B B B WB On-Ramp A A A A B A B B B C EB Off-Ramp A A F C A B A B B C EB On-Ramp A A F F A A A A B C WB Off-Ramp A A F F B B B B B B WB On-Ramp A B C F C B C B C B EB Off-Ramp F B F F B B B C B C EB On-Ramp A A F F A B A B B B WB Off-Ramp A A F F B A B A B B WB On-Ramp B A F C C C C C C C EB Off-Ramp A F F F B C B C B D EB On-Ramp A A F F A B A B A B WB Off-Ramp A A A B A A A A A A WB On-Ramp C A C C C B C B C B EB Off-Ramp A F F F A B A B A B EB On-Ramp A A A A A A A A A A (1) Currently not a ramp. (2) Not a future ramp. 24
34 Traffic Interchange (TI) SR 83 Table 2.7 (Continued) I-10 Ramps LOS Summary Table Operational Analysis Scenarios Ramp Name 2010 Existing LOS 2040 No Build LOS System I LOS System II LOS System IV LOS AM Peak Hr PM Peak Hr AM Peak Hr PM Peak Hr AM Peak Hr PM Peak Hr AM Peak Hr PM Peak Hr AM Peak Hr PM Peak Hr WB Off-Ramp A A A E A A A A A A WB On-Ramp A A C B B B B B B B EB Off-Ramp A A A F A B A B A B EB On-Ramp A A A A A A A A A A Traffic Interchange (TI) Ajo Way Golf Links Rd. Table 2.8 SR 210 Ramps LOS Summary Table Operational Analysis Scenarios Ramp Name 2010 Existing LOS 2040 No Build LOS System I LOS System II LOS System IV LOS AM Peak Hr PM Peak Hr AM Peak Hr PM Peak Hr AM Peak Hr PM Peak Hr AM Peak Hr PM Peak Hr AM Peak Hr PM Peak Hr NB Off-Ramp (1) (1) (1) (1) A A (2) (2) A A NB On-Ramp (1) (1) (1) (1) B B (2) (2) B B SB Off-Ramp (1) (1) (1) (1) B B (2) (2) B B SB On-Ramp (1) (1) (1) (1) A A (2) (2) A A NB Off-Ramp (1) (1) (1) (1) B B (2) (2) B B SB On-Ramp (1) (1) (1) (1) B B (2) (2) B B Alvernon Way NB Off-Ramp (1) (1) (1) (1) (2) (2) B B (2) (2) SB On-Ramp (1) (1) (1) (1) (2) (2) B C (2) (2) (1) Currently not a ramp. (2) Not a future ramp. 25
35 Traffic Interchange (TI) 6 th Ave. Park Ave. Kino Pkwy. Country Club Rd. Palo Verde Rd. Alvernon Way Valencia Rd. Craycroft Rd. Wilmot Rd. Kolb Rd. Rita Rd. Houghton Rd. Wentworth Rd. SR 83 Table 2.9 I-10 Intersection LOS Summary Table Operational Analysis Scenarios Intersection Name 2010 Existing LOS 2040 No Build LOS System I LOS System II LOS System IV LOS AM Peak Hr PM Peak Hr AM Peak Hr PM Peak Hr AM Peak Hr PM Peak Hr AM Peak Hr PM Peak Hr AM Peak Hr PM Peak Hr I-10 WB Ramps & 6 th Ave. B B F F B C B C B C I-10 EB Ramps & 6 th Ave. A B F F B B B B B B I-10 WB Ramps & Park Ave. B A F F B B B B B B I-10 EB Ramps & Park Ave. A A E F B C C B B C Kino Pkwy. & Ajo Connector C B F F C C B C C D I-10 WB Ramps & Kino Pkwy. (1) (1) (1) (1) B C C C C C I-10 EB Ramps & Kino Pkwy. (1) (1) (1) (1) B B B B B B Ajo Connector & Ajo Way D C F F B B B B B B I-10 WB Ramps & Country Club Rd. (1) (1) (1) (1) B B C B B B I-10 EB Ramps & Country Club Rd. (1) (1) (1) (1) B B B B B B Palo Verde Rd & Irvington Rd. C C D D C C C C C C I-10 EB Ramp & Palo Verde Rd. (1) (1) (1) (1) A A A A A A Hotel Dr. & Irvington Rd. B C D D (2) (2) (2) (2) (2) (2) I-10 WB Ramps & Alvernon Way (1) (1) (1) (1) B C B B B C I-10 EB Ramps & Alvernon Way B B B E B B B B B B I-10 EB Ramps & Valencia Rd. B C F F B C C C B C I -10 WB Ramps & Valencia Rd. E B F F B C B B B C I-10 EB Ramps & Craycroft Rd. A A F F B C B B B B I-10 WB Ramps & Craycroft Rd. A A F F B B C C B B I-10 WB Ramps & Wilmot Rd. A A F F B B B B B B I-10 EB Ramps & Wilmot Rd. A B F F B B B B B B I-10 WB Ramps & Kolb Rd. A A F F B B B B B B I-10 EB Ramps & Kolb Rd. A A F F A B A A A A I-10 WB Ramps & Rita Rd. A A F F C C B A C C I-10 EB Ramps & Rita Rd. C A F F C C A A C C I-10 WB Ramps & Houghton Rd. A A F F B B A A B B I-10 EB Ramps & Houghton Rd. A D F F B B B B B C I-10 WB Ramps & Wentworth Rd. A A F F B B B B B A I-10 EB Ramps & Wentworth Rd. A C F F B B B B B B I-10 WB Ramps & SR 83 A A F F A B A A A A I-10 EB Ramps & SR 83 A A F F A B A B A B SR 83 & Frontage Rd. A A F F (2) (2) (2) (2) (2) (2) (1) Currently not an intersection. (2) Not a future Intersection. 26
36 Table 2.10 SR 210 Intersection LOS Summary Table Traffic Operational Analysis Scenarios Interchange Intersection Name 2010 Existing LOS 2040 No Build LOS System I LOS System II LOS System IV LOS (TI) AM Peak Hr PM Peak Hr AM Peak Hr PM Peak Hr AM Peak Hr PM Peak Hr AM Peak Hr PM Peak Hr AM Peak Hr PM Peak Hr Ajo Way SR 210 SB Ramps & Ajo Way (1) (1) (1) (1) B C (2) (2) B C SR 210 NB Ramps & Ajo Way (1) (1) (1) (1) B B (2) (2) B B N/A SR 210 & Alvernon Way C B C C B B C C B B N/A Alvernon Way & 37th St. (1) (1) (1) (1) C C B B B B N/A Palo Verde Rd. & 37th St. B B A A C C B B C C N/A Palo Verde Rd. & Frontage Rd. B B A A B B B B B B N/A SR 210 & Richey Blvd. B B F F C A B A A B N/A SR 210 & 34th St. A A A A B B B A B B (1) Currently not an intersection. (2) Not a future Intersection. 27
37 2.4 Crash Data Crash Analysis The 5-year crash data for the period from January 2005 to December 2009 was obtained from ADOT Traffic Safety Section (TSS), for both I- 10 and SR210 corridors, within the study area. Crash data will be updated during preparation of the Design Concept Study. Annual Average Daily Traffic (AADT) data for the years was obtained from ADOT Multimodal Planning Division (MPD), and for the years was obtained from ADOT Transportation Data Management System (TDMS). Crash frequencies over the 5-year period were summarized by segment on both I-10 and SR 210 corridors within the study area. Crash rates for total crashes and fatal crashes per million vehicle miles traveled (MVMT) were calculated and summarized by segment and direction. Statewide crash rate averages by functional classification were obtained from ADOT. The crash data was analyzed to identify operational issues and high crash areas along the I-10 and SR 210 corridors within the study area by comparing the crash rates to statewide averages. Further analysis of the crash data to determine specific causes and identify crash patterns that can be addressed in future designs will be conducted during the Phase II Design Concept Study. Crash Summary The crashes for the I-10 and SR 210 corridors for the 5-year period are summarized in Table 2.7 Summary of Crashes based on crash severity. Table 2.11 Summary of Crashes Location Crash Severity Fatal Injury Property Damage/ None or Possible Total Injury I-10 Mainline ,113 SR 210 Mainline I-10 Corridor: I-19 to SR 83 The total number of crashes for the I-10 study area was 1,113 which included 18 fatal crashes. The remaining crashes were either injury or non-injury crashes. On the I-10 corridor, the segment with the highest number of crashes was from Kino Parkway to Palo Verde Road with a total of 200 crashes for both directions. Table 2.8 I-10 TIs 5-Year Crash Summary ( ) summarizes the crashes for the mainline within a TI, ramps, frontage roads, and cross streets at each of the TIs on I-10 from I-19 to SR 83 for the 5-year period between 2005 and Table 2.9 I-10 Mainline 5-Year Crash Summary ( ) summarizes the crashes and the crash rates for I-10 from I-19 to SR 83 for the 5-year period between 2005 and On the I-10 corridor, all of the mainline segments had crash rates lower than the statewide average for an Urban Principal Arterial Interstate, as shown in Table 2.9 except: The segment from MP to MP (between Houghton Road and Wentworth Road) has a crash rate 1.30 times higher than the state average in the westbound direction. The segment from MP to Wentworth Road has a crash rate 1.23 times higher than the state average in the eastbound direction; and a crash rate 1.27 times higher than the state average in the westbound direction. The segment from Wentworth Road to SR-83 has a crash rate 1.17 times higher than the state average in the eastbound direction. The I-10 roadway through all three of the above sections is within the independent roadway section west of SR 83, where the alignment is well within design limits. Most of the crashes were single vehicle, run off the road type crashes. There are no significant anomalies that would appear to cause the crashes. During the Phase II Design Concept Study, a more thorough analysis will be made. SR 210 Corridor: Broadway Boulevard to Alvernon Way The total number of crashes for the SR-210 study area was 170 which included 3 fatal crashes. The remaining crashes were either injury or non-injury crashes. On the SR-210 corridor, the segment with the highest number of crashes was from Broadway Boulevard to Kino Parkway with a total of 40 crashes for both directions. The next highest segment, which was from 22nd Street to Country Club Drive, had a total of 33 crashes in both directions. Table 2.10 SR 210 Mainline 5-Year Crash Summary ( ) summarizes the crashes and the crash rates for SR 210 from Broadway Boulevard to Alvernon Way for the 5-year period between 2005 and Table 2.11 SR 210 Intersections 5-Year Crash Summary ( ) summarizes the crashes for SR 210 at each of the intersections and TIs between Broadway Boulevard and Alvernon Way for the 5-year period between 2005 and Crashes Involving Wildlife Arizona Game and Fish Department had expressed a concern about the high frequency of crashes involving wildlife on the I-10 corridor. The 5- year crash data was analyzed in detail to sort crashes involving Wild Animal-Game/Non-Game/Pet. The wildlife related crashes were summarized by segment for the I-10 corridor between I-19 and SR 83. The segment of I-10 between milepost 278 to SR 83 had the highest number of crashes involving wildlife, as shown in Table
38 Table 2.12 I-10 TIs 5-Year Crash Summary ( ) TI Number of Crashes Totals Crossroad (3) Exit No. On Mainline, Within TI Area 1, Not Related to TI On Mainline, Related to TI On Ramps or Attached Frontage Road System, Not Related to TI Intersections At or Related to a Primary TI Intersection On Cross Street, Not Related to Primary TI Intersections At or Related to a Detached Frontage Rd Intersection On Detached Frontage Rd Unknown Ramp-Related (Mainline, On a Ramp, or At a TI Intersection) TI-Related (Ramp- Related + Detached- Frontage-Related) All Except Mainline All Segment 1 6 th Ave N/A N/A Park Ave N/A N/A Kino Pkwy N/A N/A Palo Verde Rd N/A N/A Alvernon Way N/A N/A Segment 2 Valencia Rd N/A N/A Craycroft Rd N/A N/A Wilmot Rd N/A N/A Kolb Rd Rita Rd N/A N/A Houghton Rd N/A N/A Segment 3 Wentworth Rd SR AVERAGE Segment N/A N/A AVERAGE Segment AVERAGE Segment AVERAGE - All TIs TOTAL - All TIs Notes: 1 TI Area is defined as the portion of the mainline between the first and last ramps associated with the TI; may be different for EB and WB 2 Average per TI (Does not include TIs where category is not applicable - "N/A") 3 I-10 Segments are divided as follows: - Segment 1, I-10, 6 th Avenue to Alvernon Way is urban in character - Segment 2, I-10, from Alvernon Way to Houghton Road is urban fringe in character - Segment 3, I-10, from Houghton Road to SR 83 is rural in character 29
39 Beginning TI 1 or MP (7) I-10; Jct. I-19 to SR 83 & SR 210; Golf Links Road to I-10 Feasibility Report Update Table 2.13 I-10 Mainline 5-Year Crash Summary ( ) Segment EB WB Animal-Related Crashes All Crash Types Fatal Crashes All Crash Types Fatal Crashes EB WB Both Directions Fatal Fatal Crash Rate Crash Rate Crash Rate Crash Rate Ending Type of Number Ratio to Number Ratio to Number Ratio to Number Ratio to Number Number Number TI 1 or MP Facility 2 (Crashes (Fatal (Crashes (Fatal Animal Animal Animal of Statewide of Statewide of Statewide of Statewide of of of per Crashes MVMT 3 Average 4,6 Crashes Crashes Average 4,6 per Crashes ) per 100 MVMT 3 Average 4,6 Crashes Crashes Average 4,6 Type(s) Type(s) Type(s) Crashes Crashes Crashes ) per 100 MVMT 3 ) MVMT 3 ) Segment 1 I th Ave Urban Principal Arterial - Interstate th Ave Park Ave Urban Principal Arterial - Interstate Park Ave Kino Pkwy Urban Principal Arterial - Interstate Kino Pkwy Palo Verde Rd Urban Principal Arterial - Interstate Pet 1 Pet Palo Verde Rd Alvernon Way Urban Principal Arterial - Interstate Alvernon Way Valencia Rd Urban Principal Arterial - Interstate Wild (Non- Game) 0 1 Segment 2 Valencia Rd Craycroft Rd Urban Principal Arterial - Interstate Craycroft Rd Wilmot Rd Urban Principal Arterial - Interstate Pet 0 1 Pet Wild Wilmot Rd Kolb Rd Urban Principal Arterial - Interstate (Game) 1 Wild (Game) Wild Kolb Rd Rita Rd Urban Principal Arterial - Interstate (Game) 1 Wild (Game) Rita Rd Houghton Rd Urban Principal Arterial - Interstate Segment 3 Wild Houghton Rd MP Rural Principal Arterial - Interstate (Game) 1 Wild (Game) MP MP Rural Principal Arterial - Interstate Pet 1 Pet Wild Wild MP Wentworth Rd Rural Principal Arterial - Interstate (Game) (Game) 5 Wild (Game) Wild Wild (Game) (Game) - 3 Wild - 4 Wentworth Rd SR 83 Rural Principal Arterial - Interstate Wild (Non- (Game) Wild (Non- Game) - 1 Game) - 1 TOTAL Segment 1 TOTAL Segment 2 TOTAL Segment 3 Urban Principal Arterial - Interstate Urban Principal Arterial - Interstate Rural Principal Arterial - Interstate Wild (Non- Game) Wild (Non- Game) Pet - 1 Wild (Non- Game) - 1 Wild (Game) - 5 Wild (Non- Game) Wild (Non- Game) 1 Pet Wild (Game) - 2 Wild (Non- Game) - 1 Pet - 1 Wild (Game) Wild (Non- Game) Wild (Non- Game) Pet - 1 Wild (Non- Game) - 1 Pet - 1 Wild (Game) - 2 Wild (Non- Game) - 2 Pet - 1 Wild (Game) - 10 Wild (Non- Game) - 1 TOTAL - ALL SEGMENTS Pet - 1 Wild (Game) - 5 Wild (Non- Game) Pet - 2 Wild (Game) - 7 Wild (Non- Game) Pet - 3 Wild (Game) - 12 Wild (Non- Game) - 4 Notes: 1 From/to crossroad overpass or underpass, unless otherwise noted 6 Ratio to Statewide Average - Legend 2 Facility Functional Classification used for Statewide Average comparison X.XX < 1 3 MVMT = Million Vehicle-Miles Traveled 1 <= X.XX < Statewide average crash rates based on data provided by ADOT TSS in March <= X.XX < Statewide Average Crash Rates: 2.00<= X.XX Urban Principal Arterial - Interstate (All Crash Types): per MVMT 7 I-10 Segments are divided as follows: Rural Principal Arterial - Interstate (All Crash Types): per MVMT Segment 1, I-10, from 6 th Avenue to Alvernon Way is urban in character Urban Principal Arterial - Interstate (Fatal Crashes): 0.69 per 100 MVMT Segment 2, I-10, from Alvernon Way to Houghton Road is urban fringe in character Rural Principal Arterial - Interstate (Fatal Crashes): 1.92 per 100 MVMT Segment 3, I-10, from Houghton Road to SR 83 is rural in character 5 From the eastmost ramp eastward (does not include the area within the TI) 30
40 Beginning Crossroad 1 I-10; Jct. I-19 to SR 83 & SR 210; Golf Links Road to I-10 Feasibility Report Update Table 2.14 SR 210 Mainline 5-Year Crash Summary ( ) Segment EB WB All Crash Types Fatal Crashes All Crash Types Fatal Crashes Ending Crossroad 1 Type of Facility 2 Number of Crashes Crash Rate (Crashes per MVMT 3 ) Ratio to Statewide Average 4,5 Number of Crashes Fatal Crash Rate (Fatal Crashes per 100 MVMT 3 ) Ratio to Statewide Average 4,5 Number of Crashes Crash Rate (Crashes per MVMT 3 ) Ratio to Statewide Average 4,5 Number of Crashes Fatal Crash Rate (Fatal Crashes per 100 MVMT 3 ) Broadway Blvd Kino Pkwy Urban Principal Arterial - Other Kino Pkwy 22nd St Urban Principal Arterial - Other nd St Country Club Dr Urban Principal Arterial - Other Country Club Dr 34th St Urban Principal Arterial - Other th St Richey Blvd Urban Principal Arterial - Other Richey Blvd Dodge Blvd Urban Principal Arterial - Other Dodge Blvd Alvernon Way Urban Principal Arterial - Other Alvernon Way End of SR 210 Urban Principal Arterial - Other TOTAL Notes: 1 From/to crossroad overpass or underpass, unless otherwise noted 2 Facility Functional Classification used for Statewide Average comparison 3 MVMT = Million Vehicle-Miles Traveled 4 Statewide average crash rates based on data provided by ADOT TSS in March Statewide Average Crash Rates: Urban Principal Arterial - Other (All Crash Types): per MVMT Urban Principal Arterial - Other (Fatal Crashes): per 100 MVMT 5 Ratio to Statewide Average - Legend X.XX < 1 1 <= X.XX < <= X.XX < <= X.XX Ratio to Statewide Average 4,5 Intersection Crossroad On Mainline, Not Related to Crossroad On Mainline, Related to Crossroad On Mainline, Related to Ramps Table 2.15 SR 210 Intersections 5-Year Crash Summary ( ) On Crossroad, Not Related to TI On Crossroad, Related to TI Number of Crashes On Crossroad, Related to Ramps Totals Not Intersection Related Intersection Related Ramp Related Unknown All Broadway Blvd Kino Pkwy nd St Country Club Rd th St Richey Blvd Dodge Blvd Alvernon Way Golf Links Rd AVERAGE TOTAL
41 3.1 Introduction The primary objective of the Feasibility Report Update of improvements to I-10 and the extension of SR 210 is to identify and evaluate additional alternatives for the improvement of I-10 between the I-10/I-19 System Interchange and SR 83 to accommodate updated design year 2040 traffic at an acceptable level of service. Alternatives for the I-10 improvement include both the extension of SR 210 from Golf Links Road to a connection with I-10, and improvements to the I-10 mainline roadway and TIs, in accordance with AASHTO and ADOT RDG requirements. Improvements to I-10 through the I-10/I-19 TI and to the north and west of the TI are not addressed in this study. The Traffic Report prepared as part of the studies for the improvement of I-10 analyzed three No-Build concepts including (1) no lane improvements to I-10 and no extension of SR 210 to intersect with I-10, (2) improving only I-10, and (3) only extending SR 210. The conclusion was that both improvement of I-10 and extension of SR 210 to a connection with I-10 are required to provide to provide improved mobility and an acceptable level of service on both highways for the 2040 design year. See Section 2. Traffic and Crash Data of this Feasibility Report Update. Improvements to I-10 and the extension of SR 210 to a connection with I-10 will be based primarily on developing the capacity to carry the projected 2040 design year traffic demand as identified via macro-level traffic modeling. This will require determining the number of lanes in each direction needed for mainline I-10 with the SR 210 extension. Improvements will include improving existing conditions, such as; short weaving distances (especially regarding successive loop ramps), TIs spaced closer than the desirable one mile spacing, and short driver decision-making distances. This Feasibility Report Update will also include consideration of modified configurations of TIs and the mainline roadways. Per ADOT Roadway Design Guidelines, LOS D is the design criteria in urban conditions for I-10 and SR 210 mainline and ramp roadways, and for ramp/crossroad intersections. LOS B is the design criteria for rural conditions. The sections of I-10 between I-19 and SR 83 as well as SR 210 within the study area are considered urban in character for design year The alternative development and evaluation process for I-10 first determines projected traffic demand and identifies capacity problems under a No-Build scenario. Revisions to existing conditions needed to 3 ALTERNATIVES CONSIDERED accommodate the projected traffic demand at an adequate Level of Service will be identified. The extension of SR 210 will be based primarily on alternative connection points with I-10 and the resulting alignments for the extension of SR 210. The process of alternative development starts with the identification of the alternative connection points. Then an alignment for the extension of SR 210 from Golf Links Road to the connection point for each alternative is developed and evaluated. Each alternative requires a major TI with Alvernon Way/Golf Links Road on the west end and a system interchange with I-10 on the east end. An alternative to incorporate collector-distributor roadways with the I-10 mainline roadways has been identified to separate traffic entering and exiting I-10 from I-10 mainline through traffic. Pima County has advised that consideration should be given to extending half-mile minor arterial or major collector streets across I-10 between I-10 TIs. to improve the connectivity of neighborhoods across I-10 and relieve the traffic volume of arterial streets at TIs. This request was outside the current scope of work but could be explored in Phase II at appropriate locations. 3.2 Level 1 Alternative Identification Alternatives for the extension of SR 210 are based on different connection points of SR 210 to I-10. The resultant alignments for the extension of SR 210 and the modifications to I-10 are then identified and evaluated. The Level 1 process identifies alternative locations along I-10 for the connection of the SR 210 extension. Alternatives alignments for the extension of SR 210 are then identified and evaluated to determine fatal flaws that may eliminate some of the connection points. The fatal flaws consist of factors that prohibit locating the SR 210 roadway in particular areas. Only those alternatives that are feasible will be carried forward into the Level 2 Analysis. Evaluation criteria include, but are not limited to: Support the major interchange of SR 210 with Alvernon Way/Golf Links Road. Avoid major impacts to Davis-Monthan AFB. Avoid major environmental, social and economic impacts identified along the alignment. Support the system interchange with I-10. Support local interchanges adjacent to the system interchange. Six initial connection locations to I-10 were identified and evaluated using the criteria listed above. A seventh alternative that modified the configuration of I-10 was also identified and evaluated. System Alternative I System Alternative I is the improvement of I-10 and the extension of SR 210 with the connection of SR 210 to I-10 at Alvernon Way. See Figure 3.1 System Alternative I. SR 210 would be extended south along the Alvernon Way alignment, to a system interchange with I-10. A diamond interchange would be provided at the junction of SR 210 and Ajo Way. SR 210 overpass structures would be provided at the intersection of E. Michigan St. and the intersection of E. Irvington Rd. A system interchange would be integrated with the diamond interchange movements at the junction of Alvernon Way and I- 10. Additional ROW would be required for SR 210, the SR 210/Golf Links interchange, the SR 210/Ajo Way interchange and the I- 10/SR 210 system interchange. There are no apparent major environmental, social or economic impacts identified with the SR 210 extension to a connection with I-10 at Alvernon Way. System Alternative II System Alternative II is the improvement of I-10 and the extension of SR 210 with the connection of SR 210 to I-10 located approximately one-half mile west of the existing Valencia Road diamond interchange. See Figure 3.2 System Alternative II. SR 210 would be extended southerly through the Alvernon Way/Golf Links TI, where it turns to the east along the southern edge of DMAFB, and then south along the Swan Road alignment to a system interchange with I-10. The alignment of the extension of SR 210 along DMAFB crosses a triangular corner of the DMAFB property near Irvington Road. A site identified as IRP by DMAFB is located within the triangular piece of property. During the Phase II Design Concept Study a determination will be made as to whether the IRP site must be avoided or what measures may be necessary to allow the SR 210 extension to pass through the site. 32


42 I-10; Jct. I-19 to SR 83 & SR 210; Golf Links Road to I-10 Figure 3.1 System Alternative I Feasibility Report Update Figure 3.2 System Alternative II Figure 3.3 System Alternative III, IIIa and IIIb 33


43 Figure 3.4 System Alternative IIIc I-10; Jct. I-19 to SR 83 & SR 210; Golf Links Road to I-10 Feasibility Report Update Figure 3.5 System Alternative IV 34