Pre-Conference Workshop: Changing Methods in Pavement Data Collection
|
|
|
- Elmer Alexander Barton
- 5 years ago
- Views:
Transcription


1 Pre-Conference Workshop: Changing Methods in Pavement Data Collection Alvaro Ulloa-Calderon, PhD Kurt Keifer, PhD, PE 2014 NWPMA Conference Seattle, WA October 28, 2014
2 Presentation Outline Background Pavement Condition Index (PCI) Inspections Evolution of Pavement Imaging 2D vs 3D Laser Imaging Distress Detection vs Classification Automated vs. Manual PCI Inspections Benefits and Limitations of Automated PCI Inspections Case Study: Cook County Questions and Answers


 Reconstruction")
3 Proactive Pavement Preservation Good Preventive Maint. Pavement condition data impacts M&R decisions. Rehabilitation Overall Condition Index (OCI) Reconstruction Pavement Preservation Poor Pavement Age
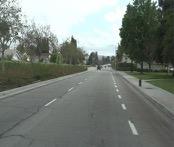


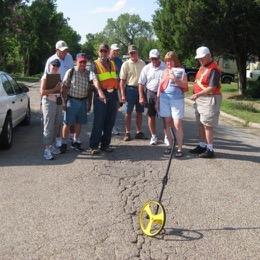
4 Traditional Pavement Inspections


5 ASTM Pavement Condition Index (PCI) ASTM D : Standard Test Method for Airport Pavement Condition Index Surveys ASTM D : Standard Practice for Roads and Parking Lots Pavement Condition Index Surveys Manual surveys only!
6 Pavement Condition Index (PCI) Pavement Condition Index Rating scale Pavement inspection data Distress type 100 Adequate Distress quantity PCI Degraded Distress severity Unsatisfactory 0


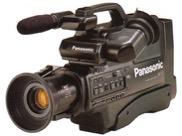
7 Evolution of Pavement Imaging 2D Laser Imaging 3D Laser Imaging

8 Current Developers Pavemetrics Pathway Systems Waylink Systems and others?


9 Technology Infusion Technology Infusion

10 2D Laser Imaging System (LRIS)


11 2D Laser Imaging System (LRIS) Crack shadow detection
12 3D Laser Crack Measurement System (LCMS)
13 3D Laser Crack Measurement System (LCMS)

14 Asphalt Pavement 2D 3D 2D Laser Intensity Image 3D Laser Range Image

15 Asphalt Pavement 3D 3D 3D Laser Range Image Automated Crack Detection


16 Concrete Pavement 2D 3D 2D Laser Intensity Image 3D Laser Range Image


17 Concrete Pavement Grooving 3D Grooves 3D Laser Range Image 3D Laser Range Image


18 Asphalt Pavement Raveling Sand Patch? 3D Digital Sand Patch
 Durability ( D ) Cracking Joint Seal Damage Patching, Small Patching, Large and Utility Cuts Scaling, Map Cracking, Crazing Shattered")
19 Distress Detection vs. Classification Step 1 Distress Detection We have detected something! Step 2 Distress Classification Now what have we detected? Corner Break Cracks (Longitudinal, Transverse, and Diagonal) Durability ( D ) Cracking Joint Seal Damage Patching, Small Patching, Large and Utility Cuts Scaling, Map Cracking, Crazing Shattered Slab/Intersecting Cracks Shrinkage Cracks Alkali- Silica Reaction (ASR)


20 ASTM D6433 Pavement Distresses Automated Manual + Automated Manual ASPHALT PAVEMENT Alligator Cracking Bleeding Block Cracking Corrugation Depression Edge Cracking Joint Reflection Cracking Longitudinal and Transverse Cracking Patching and Utility Cut Patching Potholes Lane- to- Shoulder Dropoff Pumping Polished Aggregate Raveling Rutting Shoving Slippage cracking Swell Weathering CONCRETE PAVEMENT Alkali Silica Reaction (ASR) Blowup/Buckling Corner Break Cracks (Longitudinal, Transverse, and Diagonal) Durability ( D ) Cracking Joint Seal Damage Patching, Small Patching, Large and Utility Cuts Popouts Lane- to- Shoulder Dropoff Polished Aggregate Pumping Scaling Settlement or Faulting Shattered Slab/Intersecting Cracks Shrinkage Cracking Spalling, Longitudinal and Transverse Joint Spalling, Corner


 images Rutting in")

 Applanix DGPS")
21 Dynatest Pavement Condition Survey System (PCSS) High resolution downward images High resolution right- of- way (ROW) images Rutting in both wheelpaths Longitudinal profile in both wheelpaths International Roughness Index (IRI) Applanix DGPS receiver and DMI
 3.")

22 1. Rutting (wheelpath) 2. International Roughness Index (IRI) 3. Ride Number (RN) A PCI survey is not just crack counting. Inertial profiling is needed as well.

 10. Pavement Characteristics Pavement ride quality (IRI) and continuous rutting measurements (Vehicle based system) 11.")
23 Benefits Advantages 1. Fast minimize impact to operations, collect several lane miles of pavement data in a day 2. Comprehensive capture the entire pavement surface and profile! 3. Safer fewer bodies on the road, and pavement inspectors not exposed to traffic hazards. 4. Day or night survey 5. Automated distress detection may aid manual interpretation 6. Easier to QC/QA 7. Permanent record of pavement condition witness 3D time- series pavement deterioration! 8. Geo- referenced Data High accuracy GPS coordinates provide an exact location for each data unit captured 9. Quality of Data ROW pictures (daytime) 10. Pavement Characteristics Pavement ride quality (IRI) and continuous rutting measurements (Vehicle based system) 11. Pavement Geometry Cross slope, radius of curvature and grade.
 3.")

24 Limitations Limitations 1. Require manual interpretation of imagery 2. Sensitive to weather conditions (rain) 3. No forward facing images during night surveys only downward! 4. Difficult in narrow lanes 5. May require nominal investment in server space to warehouse imagery 6. May require redefinition of inspection protocol
25 Case Study: Cook County Pavement Network Definition and Sectioning via GIS Pavement Work History Development PAVER Training Level 1 PAVER Database Creation, Customization and GIS linkage Automated Pavement Condition Index (PCI) Survey Falling Weight Deflectometer (FWD) Testing Collaborative QC/QA Program PAVER Training Level 2 ELMOD Training PAVER Analysis and Reporting PAVER Training Refresher

26 1. Pavement Network Definition PAVER Hierarchy Network Branch Roadway Parking lot Alley Section Uniform lengths/areas of a branch


27 2. Pavement Work History Development Maintenance and Rehabilitation Records Major Rehabilitation and Reconstruction (MR&R) Global Maintenance Localized Maintenance A somewhat painful but ultimately beneficial process!


28 Training 3. PAVER and ELMOD Training Level 1 Pavement management with PAVER PAVER capabilities PAVER customization Pavement Condition Index (PCI) Level 2 Real- world PAVER County s database Analysis and reporting PAVER refresher training ELMOD Training


")
29 Automated PCI Survey Dynatest Pavement Condition Survey System (PCSS)

30 Dynatest Explorer (DE) Distress Rating Module (DRM)
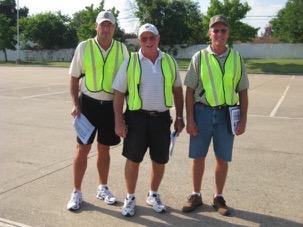

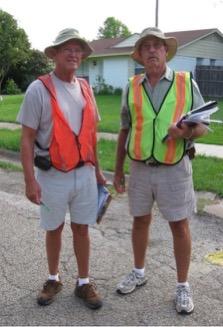
31 Trained, Experienced PCI Inspectors Excellent In the Field or In the Office

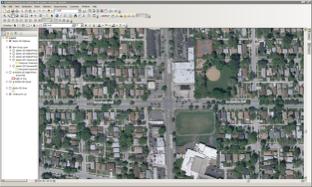
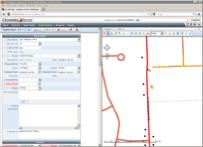
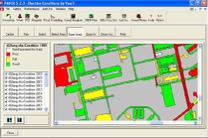
32 PAVER in GIS


33 Pavement Condition Distresses Images Profile Data Base GIS
")
34 Performance ( Family ) Models


35 Condition Reporting Performance Models PAVER is a tool that must be maintained Work history Performance models Improve with multiple PCI inspections, but must be updated Current condition reports Require updated PCI data Price data and funding sources Must be identified and included in analyses Predicting Repairs and Allocating Funding Sources Construction and maintenance History
36 Data QC/QA 7. Project QC/QA Tasks Responsible Parties Data Element(s) Quality Control Quality Assurance Pavement Inventory Definition and Database Integrity Dynatest Team Project Engineers Dynatest Project Manager and County Staff Before and after the automated PCI survey Description of Check (Standard Practice) Verify pavement section attribute data were collected and entered into PAVER prior to and after survey. GIS Sectioning Dynatest Team Project Engineers Dynatest Project Manager and County Staff Before and after the automated PCI survey Verify pavement sections were correctly defined in GIS and properly linked to the pavement management database. Automated PCI Inspection Data Collection Dynatest Project Engineers and Technicians Dynatest Project Manager (in the field) Daily checks and calibration of vehicle instrumentation GPS, DMI, RSP, and image collection hardware and software. Automated PCI Inspection Data Interpretation Dynatest Project Engineers and Technicians Dynatest Project Manager and County Staff (in the field/office) Verify accuracy of processed data during and following data interpretation. Analysis and Reporting Dynatest Project Engineers Dynatest Project Manager and County Staff Verify accuracy of analyses.
37 PAVER Analysis and Reporting Cook County Conditions and M&R Budget Scenarios
38 Overall Pavement Conditions 0.37 Overall Pavement Conditions
39 Impact of Funding on Pavement Condition 100 Pavement Condition Index (PCI) $91.5M/Year, Eliminate M&R Backlog $44.5M/Year, Maintain Current Conditions $25.0M/Year Existing Budget Condition History (Estimated) Fake Vertical Line Data Fiscal Year
40 Impact of Funding on Pavement M&R Backlog Backlog, Millions of Dollars $500 $450 $400 $350 $300 $250 $200 $150 $100 $ $91.5M/Year, Eliminate M&R Backlog $44.5M/Year, Maintain Current Conditions $25.0M/Year Existing Budget $ Fiscal Year 0
41 Summary Pavement Imaging Technologies Faster Data Collection Comprehensive (Surface distresses + Profile + Rutting + Pavement Geometry) Safer Day and Night (Airports) Permanent Record (QC/QA) Geo- referenced Data Automatic Export to PMS Software (PAVER) A Successful Application of Pavement Imaging Technologies for PMS implementation requires: Excellent trained and experienced PCI inspectors Excellent project management and communication In- house pavement management champions along with GIS and IT resources Trained and experienced project staff with subject matter expertise Active QC/QA program

42 Thank You! Northwest Pavement Management Association Conference 2014 Presented By: Alvaro Ulloa- Calderon, PhD Dynatest Consulting, Inc.