Smart Ports and smart infrastructure Big data and simulations. Jan Egbertsen, , Delft
|
|
|
- Dana Willis
- 5 years ago
- Views:
Transcription


1 Smart Ports and smart infrastructure Big data and simulations Jan Egbertsen, , Delft


2 Game changers in logistics 2
3 The world of logistics is changing Internationals hubs Individual transports Optimizing on individual company level Logistics as supporting act Cost International networks Logistical operations Optimizing logistical chain (door to door), supply chain management Logistics as strategic USP Sustainable / PPP Reliable, flexible, efficiency 3
4 Port model is changing Traditional port model: Land lord port City owned department City financed City oriented Land lease & harbour dues Competition Local harbour baron Economic development instrument Licence to operate New port model: Port development Ltd City owned Company Market financed City and region oriented New business models Investing in hinterland Cooperation Multinationals as customers International logistical network Economic development & dividend EU port governance & transparancy Licence to grow
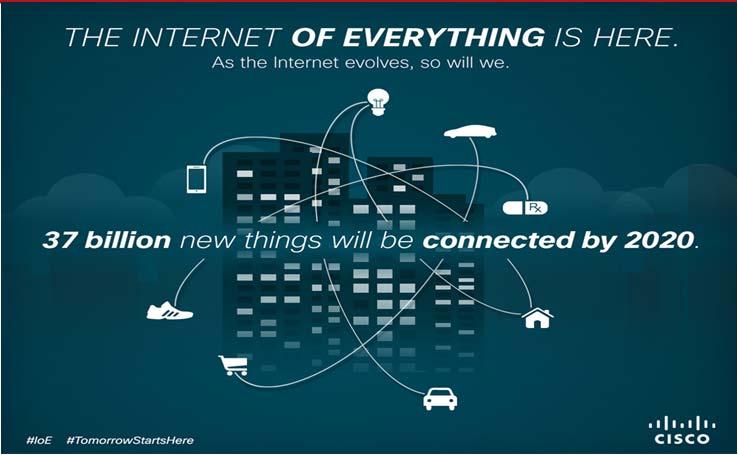
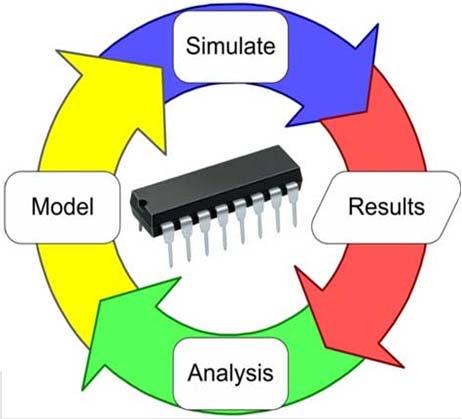
5 Big data, predictive analytics, simulations Dimensions big data: - Volume - Velocity (speed retrieve and process) - Variety (sources) - Veracity (quality) - Value More value from data (proces): 1. Identification data opportunities 2. Data analytics (history and future) 3. Realise business value Data opportunities: - Customer or market driven - Context driven (technological and social developments) - Business activity driven (operational excellence) - Data driven

6 Port of Amsterdam 4 th port in Europe; 98 mln tons, 125 mln tons 2030 Good hinterland connections rail, inland waterways and road Ha, companies, employees Smart Metropolitan Hub Amsterdam (airport, green port, science, creative industry, finance) 6

7 Port of Amsterdam N.V. Tasks: Port development, innovation and management Infrastructure New companies and cargo flows Nautical command 360 employees Operating income 140 mln / year Investment mln / year 7


8 Port model Information Technology Infrastructure Space & Environment Intermodal Transport concepts
 Provide incubator, small scale and flexible area Participate and")
9 Port Authority Market master Match maker Co-creator to reinforce to connect to realize demand supply Provide location and conditions for business Facilitate transport and transhipment Provide network infrastructure Organize business community Promote clustering for plug & play environment Fill in white spots (intermodal and IT) Provide incubator, small scale and flexible area Participate and invest, (MIF II) New Business (4 topics)
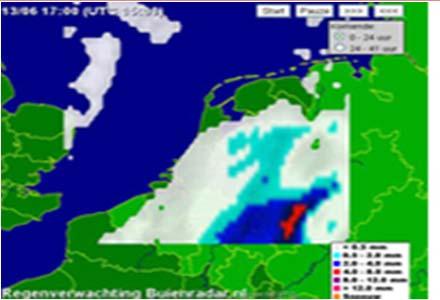


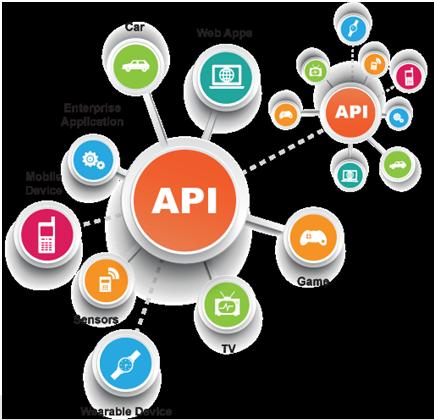
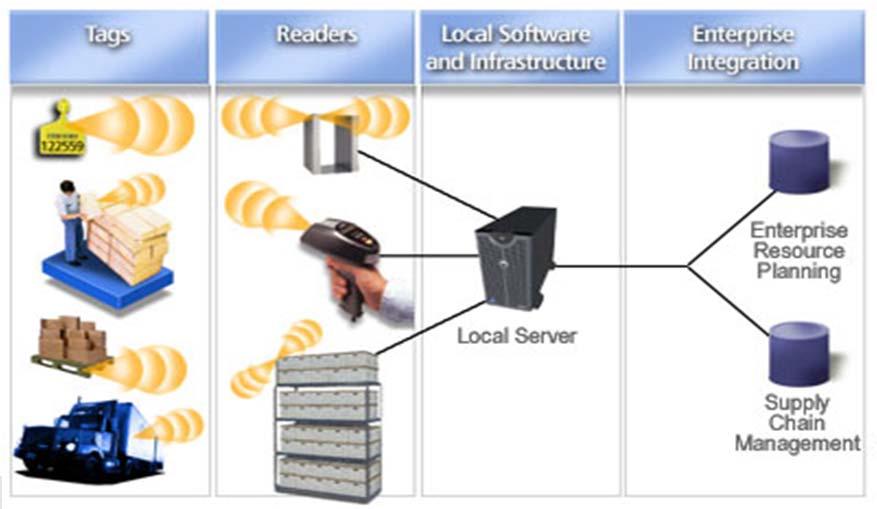
10 Retrieving data combining data smart infrastructure 10


11 Locks complex IJmuiden: new large sea lock Second large lock 500m x 65m x 18m Operational Expected 2019 Simulation, Monte Carlo, Ship movements through sealocks Present: max. capacity 95 mln tons New: max. capacity 125 mln tons

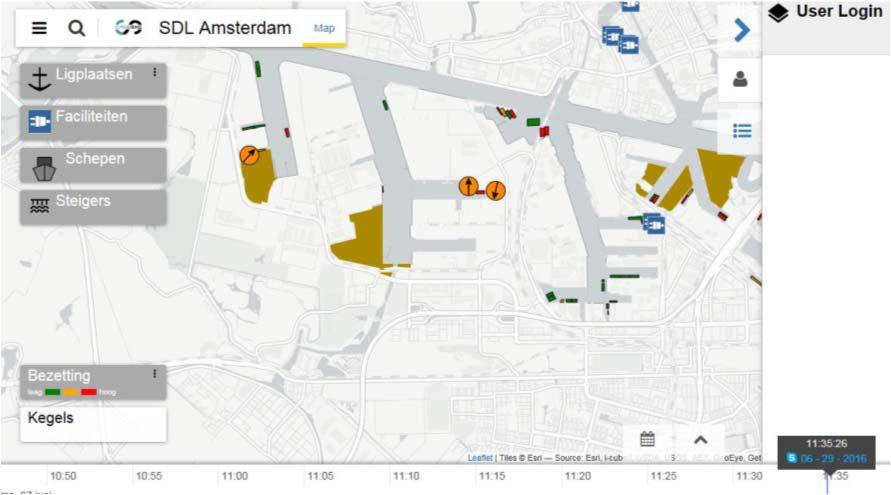
12 Portbase Port Community System ports of Rotterdam and Amsterdam Simple and efficient information exchange, BtoG and BtoB Real-time insight into the status of cargo Arrival => departure Sea, barge, road and rail Synchro modal transport Single window

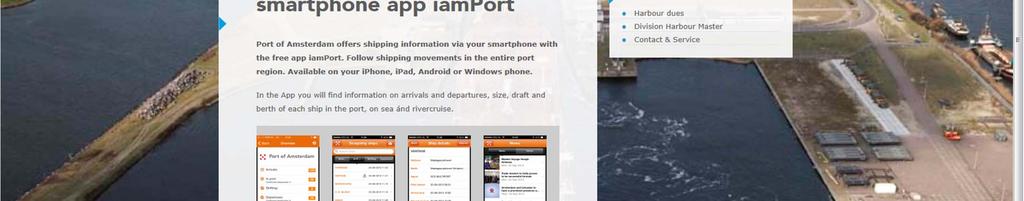
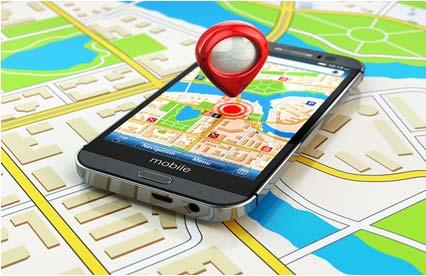
13 App IamPort 13

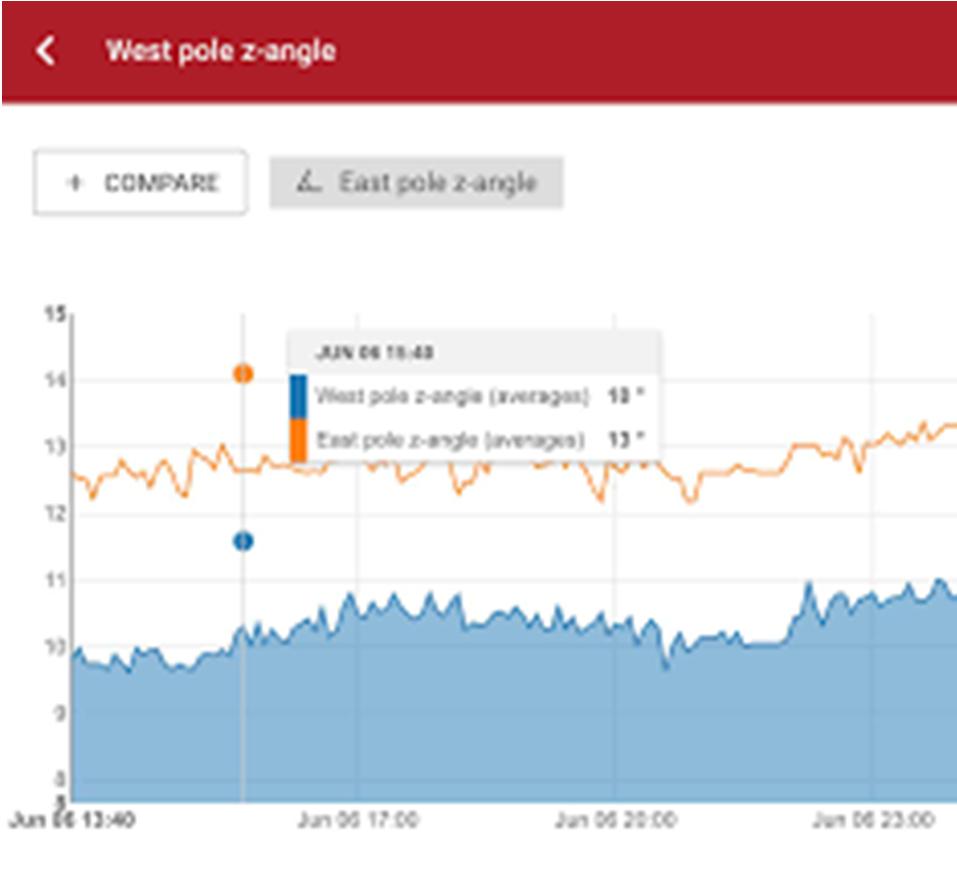
14 Sensors IJ-Palen


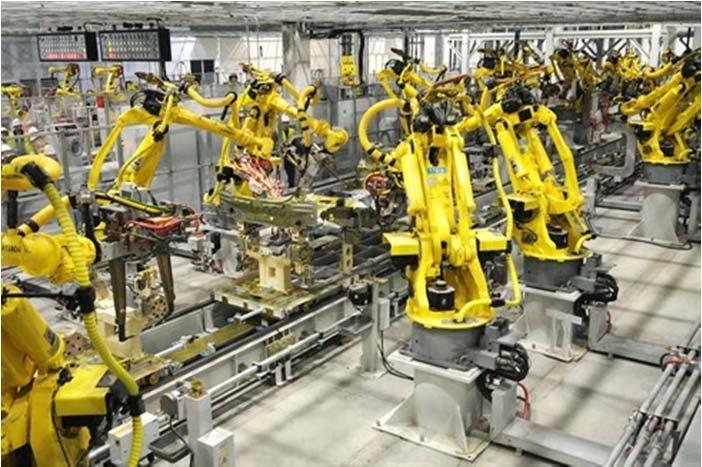
15 Trucking Siemens and Duisburger Hafen AG enter into strategic cooperation, Munich, 2015-May-04 The objective is development of innovative concepts for optimizing traffic Automation and digitization enhance efficiency in logistics First pilot project is being implemented in the port of Duisburg


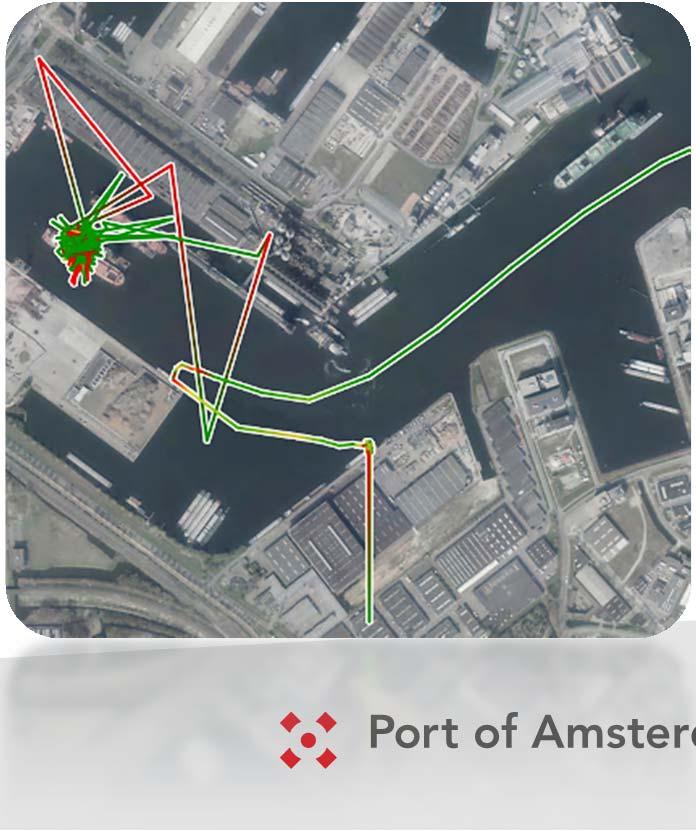
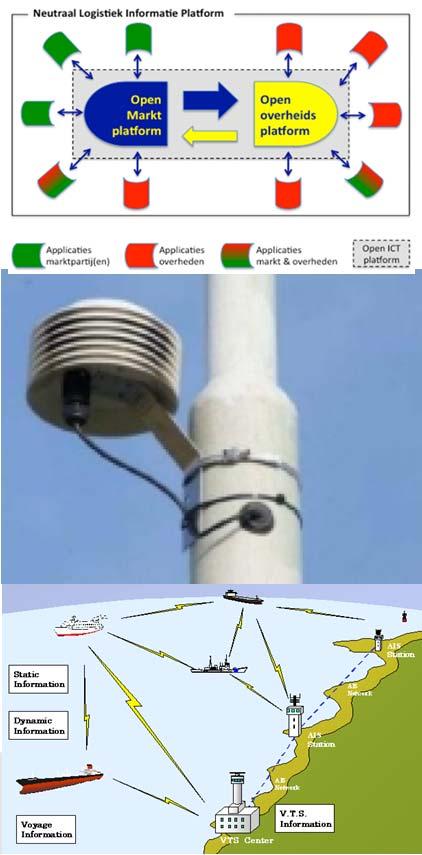
16 AIS data and port planning

17 We4Sea Performance monitoring platform: cargo, fleet and ship owners to follow performance of ships / cargo. Location, speed data of ship, combined with meteo / seastate data => the instantaneous performance of ship and components simulated and displayed. Fuel consumption / emissions presented calibrated with actual on-board measurements. Performance monitoring tool insight actual usage of fleet, relative performance of fleet compared to similarly vessels Overview well-performing components and "efficiency killers". Performance monitoring tool first step towards efficiency improvement.

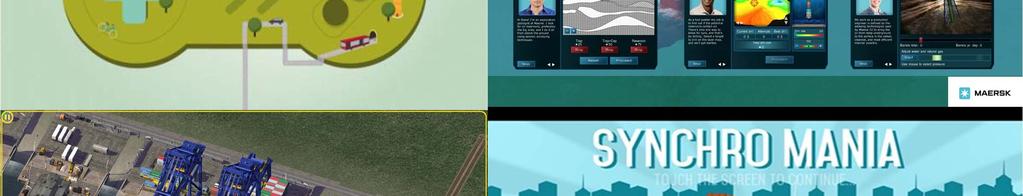
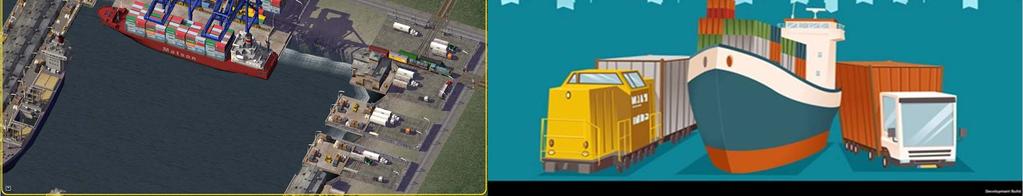
18 Serious gaming
19 To conclude Smart Infrastructure and simulations in Seaports: Optimize use of possibilities: big data, IoT, sensors and machine learning, predictive analytics, simulations. For all modalities: rail, road and water. Focus on: terminal, supply chain, port as a hub in a network Sensors in infrastructure (for maintance planning) Optimize day to day operations in ports and terminals / warehouses (ETA / ETD, etc.). Historical data analyses use of port infrastructure and hinterland infrastructure. Efficiency use existing infrastructure Cargo flow analyses => simulations use of infrastructure in 2020 and 2030 => input for investments new infrastructure.


20 Port of Amsterdam Port of partnerships 20