Multi-Resolution Traffic Modeling for Transform 66 Inside the Beltway Projects. Prepared by George Lu, Shankar Natarajan
|
|
|
- Everett Horn
- 5 years ago
- Views:
Transcription

1 Multi-Resolution Traffic Modeling for Transform 66 Inside the Beltway Projects Prepared by George Lu, Shankar Natarajan 2017 VASITE Annual Meeting, June 29, 2017
2 Outline Transform I-66 Inside the Beltway (ITB) projects Challenges Modeling methodology framework Micro-simulation analysis Mesoscopic analysis Summary and lessons learned 2
 HOV-2 only in the peak direction during peak hours Four major parallel routes Limited widening capacity Various bike and transit options 25 miles 10")
3 Project Background Outside the Beltway (OTB) Concurrent HOV and SOV operations Limited parallel facilities Available right-of-way Fixed travel choices Inside the Beltway (ITB) HOV-2 only in the peak direction during peak hours Four major parallel routes Limited widening capacity Various bike and transit options 25 miles 10 miles 3

4 Inside the Beltway Roadway congestion (peak and non-peak directions) Capacity issues at arterial interchanges Non-HOV users during HOV operation Metrorail congestion Adverse impact of roadway congestion on bus service Challenges to intermodal transfers Limitations/gaps in bicycle and pedestrian accessibility and connectivity Typical Weekday - 7:00 PM 4
5 Transform 66 ITB Projects N WB Widening (Sycamore St Washington Blvd) Before 2040 I-66 Spot Improvements Spot ITB Tolling (I-495 Route 29 in Rosslyn) 2017 Fairfax Dr EB Widening (DTR Fairfax Dr)
6 Modeling Need Traffic operational analysis to support EA/IJR Mainly focus on the impacts to freeway operations Single peak hour only Static demand inputs and Ods Freeway corridor network Regional traffic diversions and dynamic analysis To assess the impacts of tolling on traffic demand and diversion A dynamic multi-hour, multi-route analysis A larger sub-area network 6

7 Core Study Area N Fairfax Dr 7
8 Project Influence Area N Fairfax Dr 8
9 A Hybrid Multi-Resolution Modeling Approach N Microscopic simulation Mesoscopic simulation Legend Fairfax Dr 9

10 Traditional Approach Macro to Micro Macroscopic Modeling Regional Focus Microscopic Modeling Corridor Focus 10


11 Hybrid Approach A Hybrid Modeling Approach Multi-Resolution Components Macroscopic Modeling Regional Focus Mesoscopic Modeling Subarea Focus - DTA Microscopic Modeling Corridor Focus New Tools Available 11
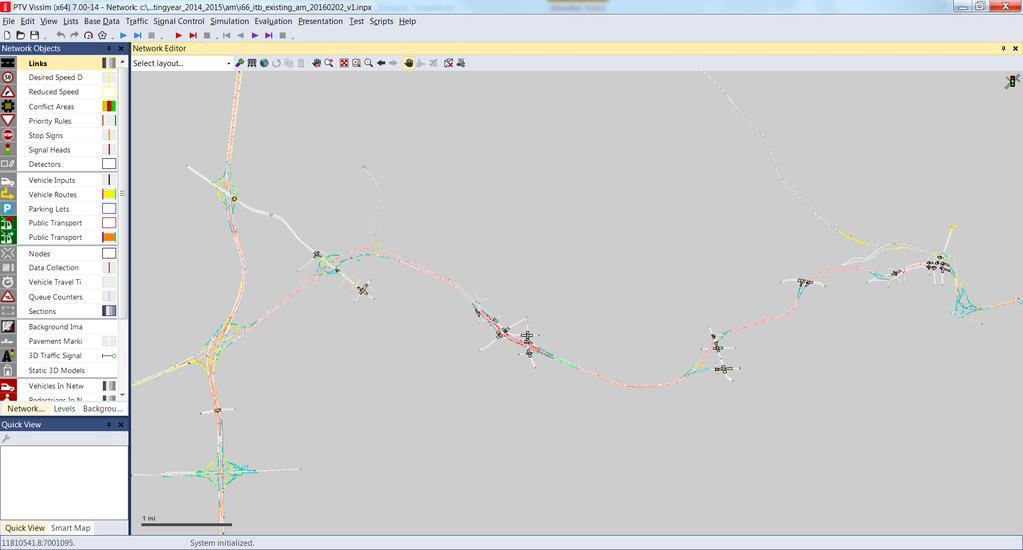
12 VISSIM Microsimulation Network
13 ) Existing Model INRIX Speed Color Scale Speed (mph) Color Scale (mph) EXIT 64 EXIT 66 EXIT 67 EXIT 69 EXIT 71 EXIT 73 Existing Model Speed Color Scale (mph) EXIT 64 EXIT 66 EXIT 68 EXIT 69 EXIT 71 EXIT 72 EXIT 73 EXIT 75 Speed Congestion Diagram Microsimulation Analysis Results I-66 Eastbound AM Peak Hour Speed Comparison 7:30 AM 5 7:35 AM 7:40 AM 15 7:45 AM 7:50 AM 25 7:55 AM 8:00 AM 35 8:05 AM 8:10 AM 45 8:15 AM 8:20 AM 55 8:25 AM 7:30 AM 5 7:35 AM Direction of Travel 7:40 AM 15 7:45 AM Direction of Travel 7:50 AM 25 7:30 AM 5 7:55 AM 7:35 AM 8:00 AM 35 7:40 AM 15 8:05 AM 7:45 AM 8:10 AM 45 7:50 AM 25 8:15 AM 7:55 AM 8:20 AM 55 8:00 AM 35 8:25 AM 8:05 AM 8:10 AM :15 AM N Washington Lee Highway Lee Highway Lee Highway 8:20 AM 55 8:25 AM I-66 Westbound AM Peak Hour Speed Comparison 13 7:30 AM 5 7:35 AM 7:40 AM 15


14 Mesoscopic Modeling Sub-Area Network Node Refinement Regional TDM Link Refinement Open Street Map (OSM) 14

15 Merged Network Model 15
 2.")

16 Trip Table Processing 1. From the sub-area regional model, aggregate trip tables to HOV and non-hov (HOT and non-hot for Build scenarios) 2. Expand trip table from peak period demand to 5 hour demand using expansion factors 3. Develop trip tables for every 30 minutes Regional Model Trip Tables SOV-Free SOV-Toll HOV2-Free HOV2-Toll HOV3-Free HOV3-Toll Trucks-Free Trucks-Toll Commercial- Free Commercial-Toll Airport-Free Airport-Toll Existing VISUM Model HOV (HOV2, HOV3+) Non-HOV Build VISUM Models HOT Non-HOT 16
17 Mesoscopic Modeling Methods VISUM Dynamic Traffic Assignment Deterministic, pre-determined link capacities and speeds With the capability of addressing queue spillover Dynamic User Equilibrium Assignment Captures time dependent changes to demand and network VISUM Simulation Based Assignment Stochastic analysis based on simplified car following theory More realistic in representing congestion effects and queues, but takes more computing and processing time VISSIM Meso Module Stochastic analysis based on simplified car following theory Micro and meso hybrid Microsimulation ready 17
18 Volumes (veh/hr) Sample MOEs Demand vs Throughput Total Demand vs. Throughput at All Screenlines: Eastbound Direction 20,000 15,000 10,000 5, :00 5:30 6:00 6:30 7:00 7:30 8:00 8:30 9:00 9:30 Time Interval Demand Throughput 18

19 Sample MOEs Intersection Operations 19

20 Sample MOEs Average Speeds 20
21 Summary and Lessons Learned Static microscopic simulation Highest level of details Static demand and assignment based on travel demand forecast Effort involved in volume processing, balancing and OD development Not able to capture dynamic variations within peak period Pre-determined diversions to/from arterial system Robust and matured modeling package Hybrid mesoscopic DTA Multi-level analysis resolutions Multi-hour and dynamic traffic assignment with timedependent demand and OD data Micro-regional impacts and diversion analysis on key parallel arterials Expandable for future detailed targeted analysis Significant data requirements Modeling package still under development 21

22 22