Singamas Container Holdings Limited
|
|
|
- Charlotte Banks
- 5 years ago
- Views:
Transcription
1 Singamas Container Holdings Limited (incorporated in HK with Limited Liability) Website: Stock Code: hk 013 Interim Results Announcement 7 August 013
2 Disclaimer The information contained in this presentation is for information purposes only and does not constitute an offer or invitation to sell or the solicitation of an offer or invitation to purchase or subscribe for any ordinary shares ( Shares ) or rights to purchase Shares in Singamas Container Holdings Limited ( Singamas or the Company ); nor does the information contained in this presentation constitute or form part of (and should not be construed as constituting or forming part of) an inducement to enter into any investment activity involving Singamas in any jurisdiction. This presentation should not, nor should anything contained in it, form the basis of or be relied upon in any connection with any contract, investment decision or commitment whatsoever; nor does it constitute a recommendation regarding the securities of Singamas. This presentation may contain forward-looking statements that involve risks and uncertainties. Actual future performance, outcomes and results may differ materially from those expressed in forward-looking statements as a result of a number of risks, uncertainties and assumptions. Although Singamas believes that such forward-looking statements are based on reasonable assumptions, it can give no assurance that such expectations will be met. You are cautioned not to place undue reliance on these forward-looking statements, which are based on current views of the management regarding future events. In addition, certain information in this presentation, including but not limited to information concerning strategic decisions, corporate principles and information relating to the Company's competitors in the shipping container industry, is not based on published statistical data or information obtained from independent third parties. Such information and statements reflect the Singamas directors' belief and best estimates based upon internal Company information and information obtained from trade and business organizations and associations and other contacts within the industry in which it competes, as well as information published by its competitors. This presentation has been prepared by Singamas. The information in this presentation has not been independently verified. The provision of the information in this presentation should not be treated as giving investment advice. No representation, warranty, express or implied, is made as to, and no reliance should be placed for any purpose whatsoever on, the fairness, accuracy, completeness or correctness of the information and opinions in this presentation. The information and opinions contained in this presentation are provided only as at the date of this presentation and are subject to change without notice. None of Singamas or its agents or advisers, or any of their respective affiliates, advisers or representatives, undertakes to update or revise any forward-looking statements, whether as a result of new information, future events or otherwise, and none of them shall have any liability (in negligence or otherwise) for any loss howsoever arising from any use of this presentation or its contents or otherwise arising in connection with this presentation. This presentation is given to you solely for your own use and information, and no part of this presentation may be copied or reproduced, or redistributed or passed on, directly or indirectly, to any other person in any manner or published, in whole or in part, for any purpose.
3 Corporate Profile Singamas Container Holdings Limited ( Singamas or the Company ) is the world s second largest container manufacturer and a major operator of container depots and terminals in the Asian-Pacific region The Company has been listed on the Hong Kong Stock Exchange since 1993 Manufacturing business Singamas manufactures a wide range of products including dry freight containers and specialised containers 11 factories1 are located in the PRC, with a total capacity of 1,000,000 TEUs in 013 Logistics business Its logistics business includes container depots/terminals and a logistics company 11 container depots/terminals, 8 at the major ports in the PRC, in Hong Kong and 1 in Thailand 1 logistics company in Xiamen Notes: 1. A company engaged in dry freight and specialised container manufacturing in Shunde was disposed in May A company that provides container depot and related logistics services was acquired by the Group in March 013, of which the Group has a 40% indirect interest. 3. TEU stands for Twenty-foot Equivalent Unit, a standard unit of measurement used for container transportation. 3

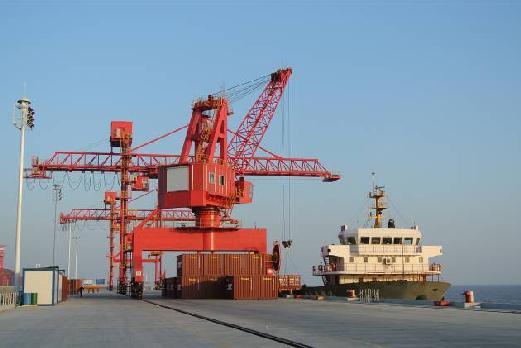
4 Comprehensive Container Factory and Depot Network FACTORIES Currently have 11 factories with 16 production lines Annual production capacity of 1,000,000 TEUs in 013 Manufacture of dry freight containers, refrigerated containers, 53 US domestic containers, tank containers and other specialised containers Phase of Qidong factory has completed producing several batches in April 013, and is expected to start contributing to the Group in 014 DEPOTS/TERMINALS Total yard size of approximate 1,160,000 m Total storage capacity of approximate146,000 TEUs The acquisition of a new container depot in Shanghai was completed in March 013 Container storage and handling services, dry & reefer container maintenance and repair, CFS, cargo stuffing and unstuffing and other container related services LOGISTICS Xiamen 4
5 Manufacturing Location Factories (effective equity stake) The PRC Tianjin Pacific (97%) Location Date of Commercial Operations No. of Production Lines Annual Production Capacity TEUs (Note ) 01 Products 013 Tianjin ,000 80,000 Dry freight and specialised containers Qingdao , ,000 Dry freight and US domestic containers Yixing ,000 30,000 Flatracks, bitutainers, pallet-wide containers, log carriers, other specialised containers and container components Shanghai Pacific (60%) Shanghai ,000 10,000 Tank containers Shanghai Baoshan (74%) Shanghai , ,000 Dry freight and other specialised containers Shanghai Reeferco (90.91%) Shanghai ,000 35,000 Refrigerated containers Xiamen ,000 70,000 Dry freight containers Shun An Da Pacific (100%) (Note 3) Shunde N/A 100,000 N/A Dry freight and other specialised containers Shunde Singamas Tank Shunde N/A 10,000 N/A Tank containers Hui Zhou Pacific (91%) Hui Zhou ,000 10,000 Dry freight and other specialised containers Ningbo Pacific (100%) Ningbo , ,000 Dry freight containers Qidong Singamas (100%) Qidong 01 75,000 00,000 Dry freight and other specialised containers Qidong Pacific (100%) Qidong 013 N/A 1 N/A 30,000 Refrigerated containers ,000 1,000,000 Qingdao Pacific (100%) Singamas Container Industry (75%) Xiamen Pacific (100%) (Note 1) (100%) (Note 3) Total Container Manufacturing (Note ) Notes: 1. With effect from 1 January 01, our effective shareholding in Xiamen Pacific has increased to 95.1% from 41.69%. We acquired the remaining 4.79% equity interest in December 01. Upon completion of the transaction, Xiamen Pacific became our wholly-owned subsidiary.. Annual production capacity is based on extended single shift. 3. Shun An Da Pacific and Shunde Singamas Tank were disposed in May 013 and October 01 respectively. 5
6 Container Depots / Terminals Location (Effective Equity Stake) The PRC Hong Kong Thailand Date of Commencement Yard size Storage Capacity** Dalian (36.84%) ,000 sq. m 14,000 TEUs Tianjin (100%) ,000 sq. m 8,000 TEUs Qingdao (60%) ,60 sq. m 1,000 TEUs Shanghai (40%) (note) ,000 sq. m 1,600 TEUs Qidong (100%) 01 14,000 sq. m. 30,000 TEUs Ningbo (40%) ,000 sq. m 19,500 TEUs Xiamen (8%) ,000 sq. m 7,000 TEUs Fuzhou (40%) ,500 sq. m 9,500 TEUs - DY Terminal (100%) ,500 sq. m 1,575 TEUs - Eng Kong (73.3%) ,000 sq. m 8,95 TEUs Laem- Chabang (5%) ,000 sq. m 3,000 TEUs 1,157,60 sq. m 146,100 TEUs Total Services Provided Container storage, handling, haulage, dry & reefer container maintenance and repair, cleaning and fumigation, C.F.S., etc. Container storage, handling, haulage, dry & reefer container maintenance and repair, hanger equipment installation, C.F.S., etc. Container storage, handling, haulage, dry & reefer container maintenance and repair, hanger equipment installation, C.F.S., forwarder, etc. Container storage, handling, haulage, dry & reefer container maintenance and repair, hanger equipment installation, C.F.S., etc. Container storage, handling and barging Container storage, handling, haulage, dry & reefer container maintenance and repair, hanger equipment installation, C.F.S., etc. Container storage, handling, haulage, dry & reefer container maintenance and repair, hanger equipment installation, C.F.S., etc. Container storage, handling, haulage, dry & reefer container maintenance and repair, hanger equipment installation, C.F.S., bonded warehousing & trading within bonded zone, etc. Container storage and repair, CFS, container haulage, reefer point & repair, hanger box decoration, stevedore and barge services, etc. Container storage and repair, CFS, container haulage, reefer point & repair, hanger box decoration, stevedore and barge services, etc. Container storage and repair, cargo storage & distribution, cargo stuffing & unstuffing, cargo packaging/repackaging, etc. Note: The acquisition of the new container depot in Shanghai was completed in March 013. ** Container (for both loaded and empty containers) storage only, excluding bulk cargo and other warehousing space. 6


7 Industry Overview 7

8 Dry Freight Container Industry Dynamics Dry Freight Container demand driven by trade / export volumes, not freight rates Traditionally, demand is seasonal in line with export and trade pattern Q-Q3 are peak seasons Materials cost is the major determinant of container price use cost-plus pricing model to set selling price Corten steel, a high-grade hot-rolled steel product, accounts for 5.1% of total dry freight container production costs in 1H013 Normal box to slot ratio is for new vessels. Refer to slide 1 for more details Size of current container fleet worldwide by end 01 is estimated to be 33 million TEUs, supporting million TEUs of shipping capacity The replacement rate prior to the financial crisis was about 5% to 7% p.a. of the total container fleet, depending on market conditions. Current replacement is irregular and this trend suggests that replacement of existing containers will become increasingly necessary, there is a pent up demand of new containers for replacement Containers were 54% owned by shipping lines & other transport carriers and 46% owned by container leasing companies as at the end of 01 (vs. 56% / 44% owned by shipping lines & other transport carriers and container leasing companies in mid-011). More orders are placed by container leasing companies since 010 8


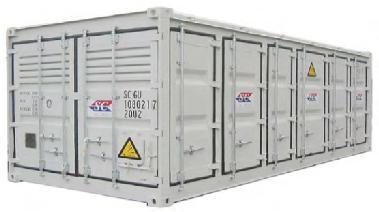
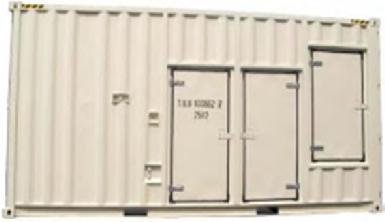
9 Specialised Container Industry Dynamics Specialised container industry has higher entry barrier and is less competitive. It normally enjoys higher margins than the standard dry freight container Demand for higher value-added specialised containers is less seasonal and cyclical than dry freight container demand Specialised containers include 53 US domestic, refrigerated, tank, open top and other higher profit margin non-dry freight containers Most of the old US domestic containers which are produced by aluminium have reached the replacement age and are expected to be replaced by steel structured containers. 53 US Domestic Container Refrigerated Container Tank Container Open-top Container 9


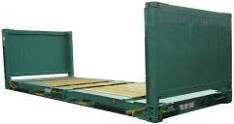


10 Manufacturing Specialised Containers Platform Container Bitutainer Lubetainer Open-side Container Gas Pack Container Half-height Container Log Carriers Generator Container Singatech (Flatrack) Container 0 Waste Container 45 Container Bulk Container 53 Container 10
 Container")
11 Container Prices vs. Steel Prices 1H013 ASP of 0ft dry freight container fell to US$,87, 6.7% lower than both 1H01 and full year of 01 Lower ASP due to the dropping of raw material prices 1H 013 average steel cost was US$633/ton (1H 01: US$710/ton and full year 01: US$687/ton) Container price along with other raw material prices are expected to stabilise in the coming months 000 1H 013 0ft. Dry Freight Container1 Price (ASP) vs. Average Steel Cost Per Ton ASP Steel Cost/ Ton US$ US$ 3, , , , , Year ASP Avg. Steel Cost Note: 1. one 0 container normally requires 1.8 tons (including wastage) of steel.. ASP stands for average selling price of Singamas. 11
12 Container Shipping Fleet Projections In normal circumstances, the box to TEU slot ratio is x That is, for every one new shipping slot, approximately two TEUs of new containers would be required Shipping capacity projected to grow steadily from million TEUs in 01 to million TEUs by 016 (representing a CAGR of 4.35% during this 4-year period) New shipping slots are expected to reach the peak of 1.6 million TEUs and 1.48 million TEUs in 013 and 014 respectively Shipping Capacity (in mil of TEUs) Rise p.a % % % % % New Shipping Slots (in mil of TEUs) New Shipping Slots (before slippage) Cellular Fleet as at 31 December Note: Based on order book as at 1 July 013 and assuming no ships are deleted after that date (other than those planned). Forecast figures take into account delivery deferrals and slippage. Expected fleet size after provision for future scrappings and delivery slippage is based on the following assumptions: i) Slippage: 17 ships for 70,000 TEUs planned for delivery in 013 are assumed to be delayed to ; and ii) Scrappings and de-ceilings are estimated to reach 450,000 TEUs in 013 and 75,000 TEUs in 014 and 00,000 TEUs in 015 and 016. Source: AXS-Alphaliner is a worldwide reference in liner shipping intelligence. 1
13 World's Second Largest Container Manufacturer Singamas is the world s second-largest container manufacturer, estimated market share remain stabled at around 1% in 013 (01 : 1%) The market is expected to remain an oligopoly as Singamas has the competitive strength to preserve a number of entry barriers As the world s second-largest manufacturer of containers, Singamas possesses both the expertise and the resources to ride out periods of weaker demand Entry Barriers 1 Production network and services Production network across the coastal regions Proximity to ports Higher land prices in coastal regions Difficult to find large area in coastal regions Singamas Competitive Positioning 11 factories across the coastal region in PRC with multi-location delivery capabilities eco-friendly container factories in Qidong well-poised to satisfy new demand and replacement demand in the upcoming year Incumbent with well established facilities, strong marketing network and customer relationships Most of its production facilities were established or acquired in the 1990s and early 000s and are now under continuous improvement and upgrade 13
14 Sustainable Business along the Industry Cycle Singamas has weathered various ups and downs along the industry cycle yet still maintained its leading position In the recent down-cycle from mid-008 to end of 009, Singamas quickly returned to profitability in 010 Singamas has a healthy financial position, with reasonable gearing ratio and sufficient cash on hand to support future business growth Production output and sales volume EBITDA and margin TEUs ( 000) % % % % 9.3% 10% 9.% % -11.9% % 110 (40) Production 01 1H01 1H013 (90) H01 1H013-0% (33) EBITDA (US$ m) EBITDA Margin (%) -30% Sales 14
15 Diversifying Product Mix to Stabilise Income To further diversify its businesses as well as providing a buffer against the trade driven volatile market for dry freight containers, Singamas is exploring higher-margin specialised containers with more stable demand Even revenue contributed by dry freight increased to 78% in 1H13, Singamas is still targeting sales of specialised containers to account for 40% to 50% of its total revenue in to 3 years by developing more higher-margin specialised containers Revenue breakdown for dry freight and specialised containers in the reporting period was 78% and % respectively Total Revenue % Breakdown (%) Manufacturing Volume % Breakdown 98 Containers manufacturing 98 (%) Logistics (%) Manufacturing Revenue % Breakdown Dry Freight Specialised Containers Dry Freight Specialised Containers 15


16 Qidong Factories Well-Poised for New Demand Two phases achieved respective development milestones in 1H 013 Phase I: Dry freight and specialised containers factory achieved operational breakeven point during the review period Phase II: Refrigerated container factory subsequently completed producing several batches of refrigerated containers from April 013 onwards, and is expected to begin contributing to the Group in 014 Well-poised with good logistic back up to satisfy new demand and replacement demand in the near future 16
17 013 Interim Results Agenda Financial Highlights Business Review - Business Segment Analysis Future Plans Appendix - Consolidated Income Statements 17
18 Financial Highlights: Revenue US$ M 1,50 1, , Six Months Ended 30 June Demand for new containers during Q013 failed to pick up after the traditionally slow 1Q Consolidated revenue amounted to US$580,854,000 (1H 01: US$886,33,000) 18
19 Financial Highlights: Consolidated Net Profit (Loss) Attributable to Owners of the Company US$ M (0) (7.4) 009 (40) (60) Six Months Ended 30 June Consolidated net profit attributable to owners of the Company was US$7,49,000 (1H01: US$38,0,000) 19
20 Financial Highlights: Basic Earnings (Loss) per Share & Dividend per Share Basic Earnings (Loss) per Share Dividend per Share HK cents 10 US cents Six Months Ended 30 June Six Months Ended 30 June Basic earnings per share was US1.14 cents Proposed an interim dividend of HK3 cents per ordinary share, representing a dividend payout of 34%
21 Financial Highlights: Net Assets Value per Share US cents As at 30 June As at 31 December 1
22 Business Review: Business Segment Analysis Revenue Profit Before Taxation US$ M US$ M 1, , Manufacturing 15.7 Logistic Services Manufacturing 1.4 Logistics Services % of Revenue 98 / 98 / Six Months Ended 30 June
23 Business Review: Manufacturing Revenue and Pretax Profit: Revenue from the segment decreased by 34.8% to US$567,84,000 partly as a result of the weakness persisting in the European and PRC economies and the resulting softer than expected demand for containers Pretax profit amounted to US$33,090,000 compared to US$59,645,000 million in the last corresponding period Business Performance: As at 30 June 013, the Group produced 74,519 TEUs (1H01: 35,79 TEUs, 01: 600,10 TEUs) Driven by the recovering US economy, US domestic container demand increased significantly Major Initiative: Disposal of 100% equity interest in Guangdong Shun An Da Pacific Container Co., Ltd. in May 013, which was principally engaged in dry freight and specialised container manufacturing The transaction has further streamlined the Group s operations and generated cash to further strengthen the Group s financial position After the completion of transaction, orders from Guangdong Province will be centrally produced in Huizhou factory 3
24 Business Review: Logistics Services Container Depots, Terminals and Mid-stream: Revenue and pretax profit: Due to the overall industry downturn and the resulting decline in handling and storage requirements, total revenue from the segment was US$13,570,000 (1H 01: US$15,706,000) Profit before taxation and non-controlling interests were US$8,199,000 (1H 01: US$1,43,000), which included a gain on disposal of a terminal in Shunde amounted to US$5,114,000. Business Performance: A total of 1,505,447 TEUs were handled during the reporting period (1H 01: 1,514,97 TEUs) Average daily container storage reached 97,630 TEUs against 105,94 TEUs in the preceding year Major Initiatives: The acquisition of Shanghai Huasing International Container Freight Transportation Co., Ltd, a company providing container depots and related logistics services, was completed in March 013 The acquisition will further bolster the Group s logistic business and potentially generate greater profit for the Group as a whole 4
25 Business Review: Logistics Services Container Depots, Terminals and Mid-stream: Handling, Repair and Storage Volumes 1H013 1H01 Total Handling TEUs Total Repair TEUs Daily Storage TEUs Total Handling TEUs % / Total Repair TEUs % / Daily Storage TEUs % / 1,31,36 1,016 87,599 1,343,95 1.7% 163, % 97,08 9.7% Hong Kong 155,845 40,606 9,17 146, % 35, % 7,58 1.8% Thailand 8,40 10, , % 10,55 0.6% 1, % 1,505,447 6,935 97,630 1,514,97 0.6% 09, % 105,94 PRC TOTAL 7.8% 5


26 Future Plans Industry Leadership Capabilities 1. Enhanced Competitiveness and Production Efficiency from Qidong Plants 6. Maintain High Product Quality. Strong Financial Position 5. Market Network and Global Reputation 3. Effective Cost-plus Pricing Strategy 4. Further develop higher-margin specialised containers by increasing the product mix 6


27 Appendix 7
28 Consolidated Income Statement I (Classification Of Expenses By Nature) Revenue Other income Changes in inventories of finished goods and work in progress Raw materials and consumables used Staff costs Depreciation and amortisation expense Exchange (loss) gain Other expenses Finance costs Investment income Reclassification of fair value loss of derivative financial instruments designated as hedging instruments from hedge reserve Share of results of associates Share of results of joint ventures Profit before taxation Income tax expense Profit for the period Attributable to: Owners of the Company Non-controlling interests Earnings per share Basic Diluted Six Months Ended 30 June US$'000 US$' ,854 13,930 70,373 (494,38) (43,18) (10,143) 886,33 1,433 (11,019) (676,631) (60,155) (10,65) (5,940) (69,453) (7,984),131 4,5 (63,360) (10,350) 1,869 4, (95) 41,89 (11,055) 30,34 (85) 79 (357) 61,077 (18,535) 4,54 7,49,74 30,34 38,0 4,340 4,54 US1.14 cents US1.14 cents US1.58 cents US1.58 cents
29 Consolidated Income Statement II (Classification Of Expenses By Function) Revenue Cost of sales Gross Profit Other income (expense) Selling and distribution expenses General and administrative expenses Exchange (loss) gain Profit from operations Finance costs Investment income Reclassification of fair value loss of derivative financial instruments designated as hedging instruments from hedge reserve Share of results of associates Share of results of joint ventures Profit before taxation Income tax expense Profit for the period Attributable to: Owners of the Company Non-controlling interests Earnings per share Basic Diluted Six Months Ended 30 June US$'000 US$' ,854 (506,31) 886,33 780,76 74,533 1,911 (15,707) (3,686) (5,940) 105,957 1,088 (16,659) (4,150) 4,5 4,111 (7,984),131 70,347 (10,350) 1,869 4, (95) (85) 79 (357) 41,89 (11,055) 61,077 (18,535) 30,34 4,54 7,49,74 30,34 38,0 4,340 4,54 US1.14 cents US1.14 cents US1.58 cents US1.58 cents