Researching Urban Freight. Bruce Lambert
|
|
|
- Evelyn Carter
- 5 years ago
- Views:
Transcription
1 Researching Urban Freight Bruce Lambert 1

2 Freight matters Daily 48.3 million tons of goods worth $46 billion Annually 57 tons per person Annually 9% of economy is spent on logistics 2


3 What Drink Can t You Live Without? When do you expect to get this? Where do you expect to get this? How much are you willing to pay in time or money to get it? What are your expectations? 3

4 What is Urban Freight? 4

5 Trucks on the Interstate 5
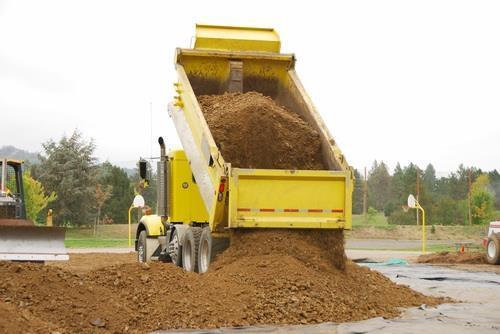
6 Local Deliveries 6

7 Train Movements, other modes 7
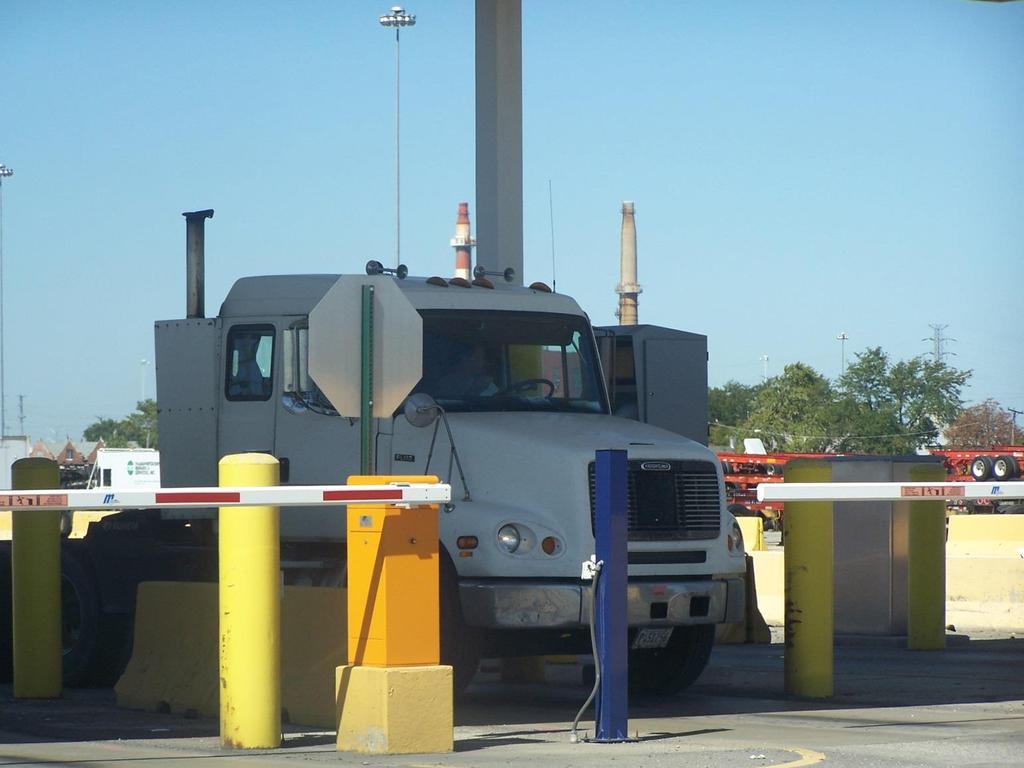
8 Drayage 8

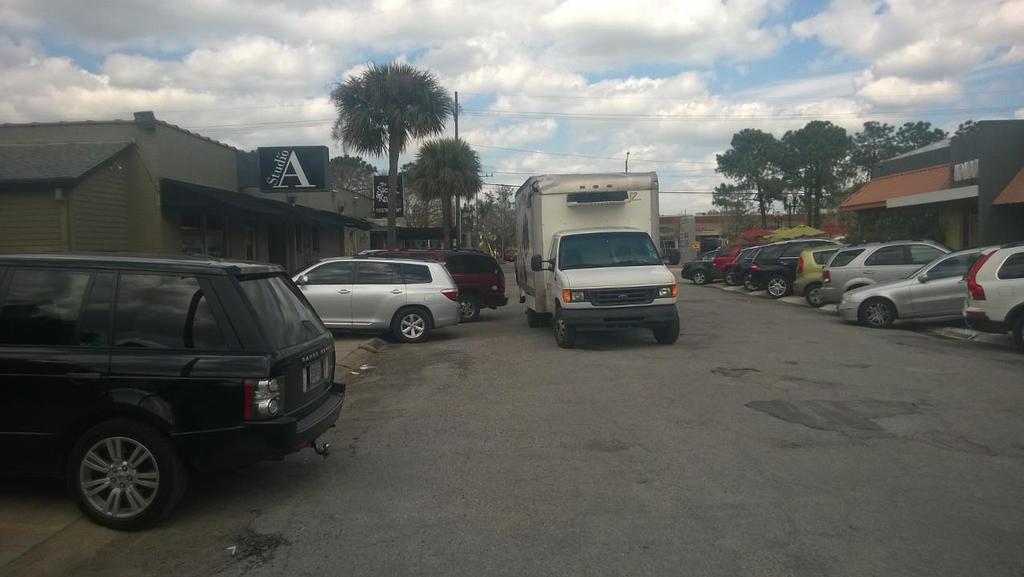
9 Truck Parking 9

10 Something Else? 10

11 Freight Goes Everywhere 11

12 Source: Wilbur Smith Associates,

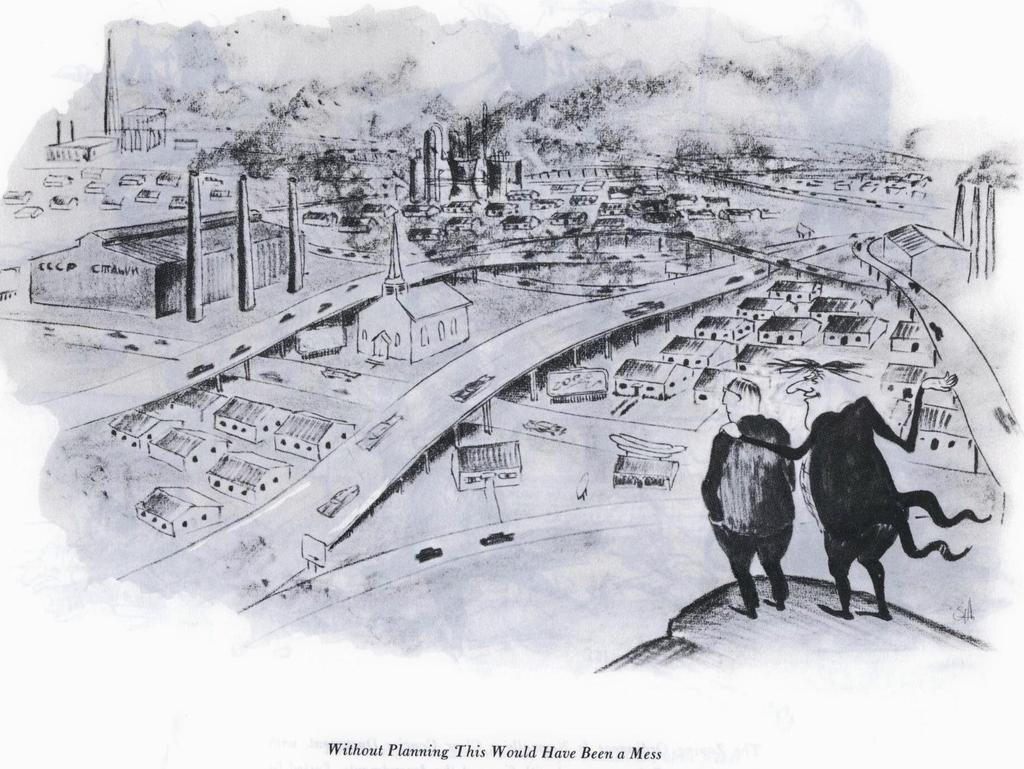
13 I don t care about deliveries when I go to local Sam s Club 13

14 Domestic Freight Mode Share by Distance 14
15 Urban Freight Different vehicles Different user expectations Different modes Different operational zones, routes, etc. Different schedules 15
16 Will Freight Generate Economic Growth 16

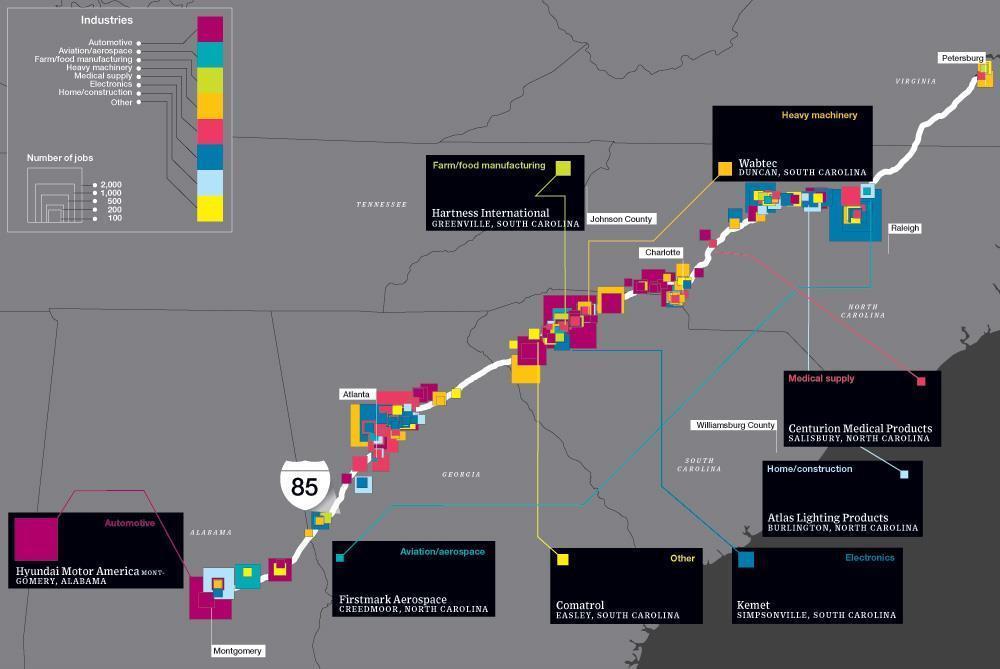
17 KY top 200 firms - Intermodal facilities Yellow Top 200 Firm Green Intermodal Facility 17


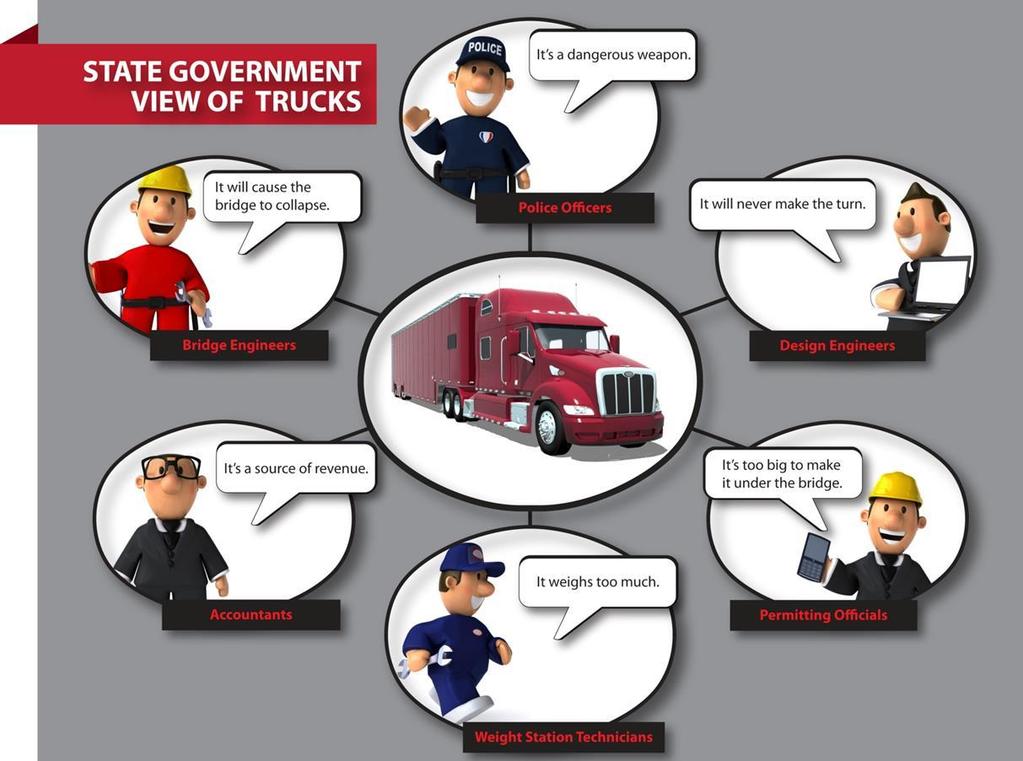
18 What is the Message Its about me Really? 18

19 Logistics Parks and Economic Development What type of facility? Trackage and Terminals Develop densities Drayage and equipment issues Domestic and international Shippers bear costs? Don t cannibalize other facilities 19
20 20


21 Who Are the Players? Private Shippers International Shippers Domestic Carriers Intermodal Carriers Drayage, Regional Public State Local Federal National 21

22 Who is Responsible for What? Vision Education Partnerships Private Sector Public Sector Transportation Utilities Cargo Density Transportation services Terminal Operations Workforce Development Business Clusters Intermediaries Business Climate Incentives 22
23 Freight advisory councils State/Federal LADOTD Activities Freight Advisory Councils MAP21 Other State models Local Initiatives Columbus Chamber of Commerce Logistics Council DVRPC 23
 WE/I get a piece of the pie?")
24 What Must We Do- Transportation/ Economic Development? What may change existing flows or create new markets? Can (will) WE/I get a piece of the pie? What can WE/I do to create opportunities? 24
25 25
26 Who benefits from transportation improvements? Carriers Ports Governments and other local industries Shippers Economic Development Agencies Who does not benefit? 26
27 27
28 Public Sector Planning for Freight - Today More modal balance Largest trading partners are neighbors Need to move along corridors To-From State Through Freight All Modes All cargos Discretionary routing Within State Mostly Trucks Tend to be heavier products Rural-urban flows Urban-urban flows 28
29 Freight Planning Is Becoming a Federal Issue MAP-21 PIIRA National Export Initiative Economic competitiveness push Trade policy 29
30 MAP-21 Freight Responsibilities Sec 1118 State Actions Trends, needs and issues Policies, strategies, performance measures Cost Sharing Formulas Federal Actions Establishment of a National Freight Network Critical Rural Freight Corridors National Freight Strategic Plan Data programs Develop conditions and performance 30
31 National Freight Network Primary freight network Designated within one year Based on inventory of freight volume 27,000 centerline miles, existing roadways 3,000 additional miles possible Redesignation every 10 years Other portions of the Interstate System Critical rural freight corridors. 31
32 What Does PRIIA focus on Authorizes Amtrak Funding for State of Good Repair Funding for debt service Three main areas: intercity passenger rail State sponsored corridors High Speed Rail Sec 303 Develop Statewide plan Freight and passenger rail Establish priorities and implementation strategies Basis for rail investment by Federal and State agencies 32


33 Putting National Goals at a local level See any trucks, railcars, barges or planes? 33
34 Freight Movements Not Going Away!! So Three Options Exist at local level: Build (improve) freight system capacity Increase Efficiencies and Operations Create or Support emerging transportation options (thinking outside the box) 34

35 Urban Freight Faces Unique Challenges - Ownership NHS Connectors Poor physical condition Poor geometrics Orphan status Inadequate coordination of investment strategies Functional Class Signage 35
 Beggar thy neighbor Freight generators")
36 Urban Freight Faces Unique Challenges Political Land Use Gentrification Rent seeking behaviors City expansion (taxes) Beggar thy neighbor Freight generators 36

37 Urban Freight Faces Unique Challenges - Operations Operations Parking Night Delivery Intermodal Terminals Shipper expectations Dimensions Routing Automation Fleeting Congestion costs 37

38 If I gave you one dollar 38 What would you buy?

39 Interstate Routes Average Speed 4-6 PM Weekdays 2012

40 Interstate and Major Routes Average Speed 4-6 PM Weekdays 2012

41 All Other Routes Average Speed 4-6 PM Weekdays 2012
42 Strategies Recommended By LATTS Utilization of Existing Infrastructure Add Physical Infrastructure Increase Operating Throughput Corridor Approach for Investing Develop Agile Freight Operations Improve Clearance at Gateways Attention to Connectors Encourage Technology Integration of Information ITS Applications Increase Public Awareness Improve Institutional Relationships Improve Freight Profile Partnerships 42

43 Getting the Goods without the Bads: Freight Transportation Demand Management Strategies to Reduce Urban Impacts CFIRE September 2013
44 Okay, we need a freight plan 44

45 Does Understanding The Big Picture Matter? Will imports/exports go up or down in 10 years? Where will people live in twenty years? Where will the state see more truck traffic? What if we go to heavier/longer trucks? What if the State attracts more manufacturing, energy jobs? Truck parking issues? What is my neighbor doing? What will this change and where? 45
46 Congratulations You just worked on a freight plan. 46
47 47

48 Where is Good, Free, Timely Freight Data? 48
 Time (date) associated with the shipment movement itself; Mode (truck, rail, water) and submode; Product origin and destination, including international shipments; Facility or")
49 The Ideal Database? (Based on TRB Reports) Time (date) associated with the shipment movement itself; Mode (truck, rail, water) and submode; Product origin and destination, including international shipments; Facility or equipment interchanges, including intermodalism; Type of equipment used to move the product; Product weight, density (measured in pounds per cubic foot) and value; Shipment size; Route used for domestic shipments. Shipper and receiver relationship (contractual); Transportation rates, fees, and costs; Time sensitivity (just in time, JIT) or perishablity of the product; Equipment movements, including repositioning empties and backhauls; Other products moving on the same piece of equipment (multiple products from either the same or different shippers); The economic multipliers associated with the shipment (tied to other modeling efforts); Cargo ownership, including the names and addresses of the shipper, receiver, and carriage provider; Tax and fuel payments tied to shipment; The relationship between goods movement to the economy and jobs; Timely data collection and reporting of the shipment event to others (the information is reported fairly quickly after the shipment occurred); Identifying the actual product that was shipped? 49
50 Data Sources Economic BEA, CBP, MSA Operational FAF, Trade Stats, CFS, Rail waybill, Corps of Engineers, BTS airplane Demographics Census Local and State economic development agencies 50
51 Some Basic Research and Data Gaps Economic Multipliers and Jobs Data/planning cross agency and cross modally Extreme Event response Corridor Research and access Land use decisions Program delivery and Transparency 51

52 Changing Values of Data and Information Data is everywhere Data is accessible Data will lead the way Data is cheap Data is timely Information is basis for decisions Information takes time, money and effort New Technologies for collection, visualization, and analysis changing acceptance of results Computer storage cheap 52

53 Everyone is surrounded by reports, studies, models, but We Want People To Make Better Decisions 53

54 I Need Your Help 54

55 Georgia s Work Plan- different study needs 55
56 ITTS Website and materials Word clouds State data Reports Newsletter Conference Network 56
57 Freight Template Elements Local Perspective Top Industries Interviews with 3 relevant groups Tell the Story- Data and analysis Transportation Data from MSA, CBP, FAF (where appropriate) Economic data Demographic data Graphics Map of inventory and key facilities Lots of local pictures Challenges and Future Efforts SWOT Analysis Long Range plan 57
58 Challenges to improving urban freight Hard Assets - Physical Cost increases ROW issues Existing Capital Stock Increased maintenance needs Realigning roadways Soft Assets - Operations Private, quasi public sector leadership Integrate with other programs Work zones Information Sharing Tell me why... Funding needs for capacity and operations Role of public and private sector actions not clearly identified Expectations for promised projects remain 58

59 What are you drinking next? It came from somewhere It was packaged ready for your needs It was available when you wanted it It should met your expectations concerning price and quality Did It generate any jobs in your area? You helped make this happen 59

60 Bruce Lambert Executive Director Institute for Trade and Transportation Studies Visit ittsresearch.org for: Newsletter State Statistics Reports and Presentations 60